J. Cent. South Univ. Technol. (2010) 17: 1070-1078
DOI: 10.1007/s11771-010-0599-9

Centrifuge modeling of dynamic behavior of pile-reinforced slopes during earthquakes
YU Yu-zhen(������), DENG Li-jun(������), SUN Xun(��ѷ), L? He(����)
State Key Laboratory of Hydroscience and Engineering, Tsinghua University, Beijing 100084, China
? Central South University Press and Springer-Verlag Berlin Heidelberg 2010
Abstract: A series of centrifuge model tests of sandy slopes were conducted to study the dynamic behavior of pile-reinforced slopes subjected to various motions. Time histories of accelerations, bending moments and pile earth pressures were obtained during excitation of the adjusted El Centro earthquake and a cyclic motion. Under a realistic earthquake, the overall response of the pile-reinforced slope is lower than that of the non-reinforced slope. The histories of bending moments and dynamic earth pressures reach their maximums soon after shaking started and then remain roughly stable until the end of shaking. Maximum moments occur at the height of 3.5 m, which is the deeper section of the pile, indicating the interface between the active loading and passive resistance regions. The dynamic earth pressures above the slope base steadily increase with the increase of height of pile. For the model under cyclic input motion, response amplitudes at different locations in the slope are almost the same, indicating no significant response amplification. Both the bending moment and earth pressure increase gradually over a long period.
Key words: earthquake; slope; stabilizing pile; dynamic behavior; centrifuge modeling; earth pressure; acceleration; bending moment
1 Introduction
Landslides caused by earthquakes, such as the 1999 Chi-Chi earthquake in Taiwan, the 2005 Niigata earthquake in Japan and the 2008 Wenchuan earthquake in China, have frequently been observed. Ensuring the dynamic stability of both constructed embankments and natural slopes is one of the major concerns to geotechnical engineers. Stabilizing piles are widely used in engineering practice and proved to be an effective solution, because piles can be installed without disturbing the general fabric of slope soils. The slope�Cpile system is able to remain stable by transferring the active force of the failing mass to lower layers or to bedrock [1].
For the analysis and design of the slope-pile system, many methodologies and procedures were developed on the basis of either the plastic state theory [2-3] or its combination with limit equilibrium [4-5]. The analysis of a slope reinforced with stabilizing piles requires the distribution of the loads applied to the piles, including the active force of the failing mass and the passive resistance of the base. Many assumptions about force distributions were proposed for different soil types [6]. The applicability of these procedures and analyses to seismic design is still uncertain, however, due to the lack of experimental data or field observations. Furthermore, there is insufficient understanding of the mechanisms involving the dynamic soil�Cpile interaction under earthquake loads, thus making it difficult to extend current methodologies to dynamic analyses of slopes with stabilizing piles.
With the development of the centrifuge technique and shaking table facilities over the past 20 years, geotechnical researchers can carry out dynamic centrifuge modeling on the performance of slopes with stabilizing piles and soil�Cpile interaction to verify the theoretical analyses or to help practical design. The results of eight centrifuge models of vertical single piles and pile groups subjected to earthquake-induced liquefaction and lateral spreading were presented by Abdoun et al [7]. Brandenberg et al [8] evaluated the horizontal loads on embedded piles and pile caps during lateral spreading due to the liquefaction of mildly sloping ground. Similar dynamic tests were also conducted on centrifuge shaking tables to gain insight into piled foundations in liquefiable or lateral spreading ground [9-12]. Those experimental studies were involved in the modeling of piled foundations in liquefied sand, upon which a superstructure was typically included to consider soil-pile-structure interaction. Differing from pile foundation, stabilizing piles in slopes would be essentially affected by the lateral spreading of slopes. Currently, however, there is still much uncertainty regarding the response and failure mechanisms of slopes reinforced with stabilizing piles under seismic loads. In addition, few accurate data about the dynamic performance of pile-reinforced slopes are available so far. Resolving these facts will require the support of dynamic experimental data or field investigations.
In response to these facts, a series of centrifuge model tests were conducted to investigate the dynamic behavior of pile-reinforced slopes during earthquakes. LI [13] described the dynamic failure process of stabilizing piles in slope with saturated substratum. The results of model tests with dry sand were presented and discussed in this work. Ground motions recorded in El Centro earthquake or cyclic waves were applied to the models.
2 Centrifuge tests
2.1 Test equipment and materials
The centrifuge tests were performed on the geotechnical centrifuge of Tsinghua University, which was equipped with an electrohydraulic servo-controlled shaking table. A rigid-wall container with internal dimensions of 495 mm (length)��200 mm (width)�� 350 mm (height) was fabricated for this work.
The soil used in this work was obtained from a sand deposit in Beijing.
The model pile was made up of an aluminum alloy tube with external dimensions of 24.9 mm��24.8 mm, which is about 1/8 of the container width. A stabilizing pile group normally has a dimension-to-spacing ratio of 1/3 or 1/4 in practical slope stabilization. Although this test series used a single pile which is not common in practice, it provided a useful basis for prediction and further research. Some major properties of the pile are summarized in Table 1 in both the model and prototype units. The pile tip was fixed at the container bottom before sand model construction to simulate a drilled or cast-in-place pile. The fixity boundary condition can greatly simplify the construction work and will be convenient for simple analysis.
More details about the equipment, soil, model container and procedures of model construction were described by YU and DEND [14] and Yu et al [15].
Table 1 Properties of stabilizing pile of aluminum alloy

2.2 Test cases and input motions
Three tests with stabilizing piles, EP1, EP2 and CP3, were carried out. The details of model test EP1 were described by YU and DENG [14]. The model test C-3, presented in Ref.[15], can be regarded as a reference case. Model C-3 was constructed with a very similar profile and the same soil properties as EP1, however, there was no stabilizing pile built in this model. The details of the four tests and input motions are shown in Table 2.
Scaled ground motion from 1964 El Centro earthquake in California was input to cases EP1, EP2 and C-3, while a packet of cyclic waves was input to the case CP3. The earthquake motion can reasonably produce the full range of frequencies that exists in actual earthquake motions, thereby simulating the realistic conditions for the model. Scaled El Centro ground motions had peak accelerations of 0.27g, 0.18g and 0.25g (1g=9.806 65 m/s2), respectively. The input amplitude of EP2 was reduced for comparison purpose. CP3 was excited with cyclic waves consisting of 16 cycles of uniform acceleration having 0.57 Hz dominant frequency and 0.25g acceleration amplitude.
2.3 Instrument and measurements
A schematic of model configuration and instrumentation of EP1 as a typical case is shown in Fig.1. In all four cases, the soil profiles were similar except for the difference of the slope angle, which was around 38?. Some geometric and physical properties of all soil profiles are summarized in Table 2. Note that all measurements, times, lengths and other results are presented hereafter in prototype engineering units unless otherwise noted.
Three accelerometers (A# in Fig.1) were located at
Table 2 Summary of slopes and input motions


Fig.1 Layout and instrumentation of slope and pile in EP1 (unit: m): (a) Slope; (b) Pile
the substratum section of the profile and the other six at the slope section to measure the lateral responses of respective locations. Note that A1, A2 and A4 were not set inside but beside the pile. Six couples of strain gauges (SG#) were glued to the upslope and down-slope surfaces of the pile to measure the moment distribution on the pile. Five soil pressure sensors (SPS#) were installed on the upslope surface.
3 Response accelerations of slope
3.1 Test results under earthquake motions
The effect of the stabilizing pile on slope response was evaluated by focusing on the recordings of the group of A4, A5 and A6 and another group of A7 and A8 which shared the same height in the soil profile. Fig.2 shows the input motion and several acceleration histories recorded at the 6.5 m high slope base and the 11.0 m slope part in model EP2. For the plain slope, it is typically expected that the response near the slope surface (i.e., A4) will be stronger than that in the internal free field (i.e., A5 and A6) because of the difference in vertical stress level. The zone close to slope surface is subjected to smaller overburden stress, tending to be more

Fig.2 Acceleration histories at slope base and mid slope of EP2: (a) Base, ap=0.18g; (b) A4, ap=0.18g, 6.5 m; (c) A5, ap=0.20g, 6.5 m; (d) A6, ap=0.21g, 6.5 m; (e) A7, ap=0.21g, 11.0 m; (f) A8, ap=0.21g, 11.0 m
active in dynamic loading. The tendency was found in other similar centrifuge test results [16-17]. Nevertheless, in this work with stabilizing piles, the response near the slope surface (A4) is lower than that in the free field (A5 and A6). This tendency in the response may be associated with the presence of the stabilizing pile that can restrain the response of surrounding soil. However, it should be pointed out that the restraining effect is limited to a very close extent, because the slope reaction at A7 becomes greater than that at A8 in general, both of which are far away from the stabilizing pile.
The characterization of slope response cannot be complete without consideration in frequency domain. For each acceleration time series, the acceleration response spectra (ARS) of a single-degree-of-freedom (SDOF) system can be calculated. From acceleration response spectra, a spectral amplification factor can be defined according to the following equation:
��sp(f)=asp(f )/asp,in(f ) (1)
where f is the frequency; asp(f ) is the calculated spectral acceleration; and asp,in(f ) is the spectral acceleration of the input motion.
Several ARS amplification factor curves of EP1 are shown in Fig.3. These curves demonstrate that different frequency contents of the input event are amplified to different extents during the propagation of the shear wave. An individual slope has a particular frequency range within which the frequency contents of the input event are amplified most significantly if the slope is subjected to a broad-frequency shaking. In this case, the maximum amplification ��sp,max=4.48 occurs at the slope crest and the corresponding frequency is 6.5 Hz. According to the theory of resonance vibration, the natural frequency of the reinforced slope in model EP1 may be approximately 6.5 Hz. Fig.4 shows several ARS amplification factor curves of EP2. It seems that the natural frequency of model EP2 under a small earthquake is higher than that of EP1 under a larger earthquake motion.

Fig.3 ARS amplification factors of EP1: (a) A4, A5, A6; (b) A7, A8; A9
The maximum ��sp at the slope crest in model C-3 without stabilizing pile is 5.27 [15], which is much larger than that at the crest, 4.48, in the case of EP1. In addition, ��sp values at other positions in C-3 are also usually

Fig.4 ARS amplification factors of EP2: (a) A4, A5, A6; (b) A7, A8
greater than those at the same positions in EP1. The difference can only be accounted for by the presence of the stabilizing pile. Because amplification factors will evaluate the response behavior of an earth structure in the frequency domain, this finding through comparing ��sp affirms the restraining effects of stabilizing piles on the seismic response of slopes. The natural frequency of model C-3 is about 5.7 Hz, which is lower than that of EP1.
3.2 Test results under cyclic motions
Model CP3 was stimulated with a sinusoidal wave in an attempt to investigate the slope responses to various input types. Consisting of 16 cycles of 0.57 Hz frequency, the event has 32 s duration and a nearly constant amplitude with a peak acceleration ap=0.25g (Table 2).
Fig.5 presents four acceleration histories measured at representative locations A2, A4, A6 and A8. Clearly, response amplitudes of the slope are lower than the base input. As the wave propagates from the bottom to the top of the slope, the overall cyclic response recorded by A6 and A8 becomes more active, but significant response amplification is not observed.
From the raw acceleration series, the ARS of SDOF systems at 5% damping ratio were computed, as shown in Fig.6. The maximum spectra accelerations of A4, A6

Fig.5 Acceleration histories of CP3: (a) Base, ��p=0.25g; (b) A2, ��p=0.20g; (c) A4, ��p=0.21g; (d) A6, ��p=0.20g; (e) A8, ��p= 0.25g
and A8 are 1.16g, 1.09g and 1.17g, respectively. There appears to be minimal variation in these spectra curves. Fig.7 shows some ARS amplification factors defined by Eq.(1). The values of ARS amplification factors in CP3 are much smaller than those for model EP1. For example, the maximum of ��sp at A8 in CP3 is only 1.18 while the maximum ��sp at A8 in EP1 is 2.94. In addition, these curves in CP3 are fairly flat with no predominant peak value, so it is difficult to estimate the natural frequency of the slope from the results.
In general, CP3 shows distinctively different behaviors from the previous cases subjected to El Centro earthquakes. Under cyclic waves, the dynamic response of the slope is not as active as that under realistic earthquake events. The diversity of the two types of response may be attributed to the frequency characteristics of the input motions that are described by their respective response spectra. Realistic earthquakes produce complicated loading with components of motion that span a broad range of frequencies, including the natural frequency of the earth structure. For cyclic waves, however, the amplitude of a motion is distributed within a narrow frequency band, illustrated by the acceleration spike (shown in Fig.6), corresponding to 0.57 Hz that is

Fig.6 Acceleration response spectra of CP3:(a) Base; (b) A4, A6, A8

Fig.7 ARS amplification factors of CP3
far away from the natural frequency of the slope system.
4 Pile performance
Six strain gauge couples were glued to both the upslope and down-slope sides of the pile to measure bending strains during shaking. Initial offsets of bending moments caused by soil self-weight were removed in order to obtain pure dynamic moments.
Figs.8 and 9 provide the histories of bending moments in models EP1, EP2, and CP3, respectively. The

Fig.8 Histories of pile bending moments in EP1 and EP2 at different heights of measurement: (a) 1.75 m; (b) 3.50 m; (c) 5.25 m; (d) 7.00 m; (e) 8.75 m
bending moments were calculated from the measured raw bending strains and were converted to prototype scale values. The heights of the location of the histories are noted in the captions of Figs.8 and 9. SG1 was located near the slope surface and showed tiny values; therefore, the recordings are not shown in Figs.8 and 9. Down- slope compression is defined as a positive bending moment as a sign convention. Figs.8 and 9 show that the upslope face of the pile is in tension, while the down-slope face is in compression, which is consistent with the displacement direction of the slope.
Fig.8 shows that, for models EP1 and EP2, bending moments reach peak values soon after the shaking begins and then remain roughly stable during the rest of shaking. The maximum moment Mmax on the pile occurs at 3.5 m elevation which is in the deeper section of the pile. Shortly after the shaking begins (at 6.4 s in EP1 and 6.9 s in EP2) when the input El Centro earthquake just undergoes its maximum amplitude, the moments increase rapidly from the initial values to the maxima. Then, the moments generally appear stable despite some minor fluctuation. Moment variation versus time is associated
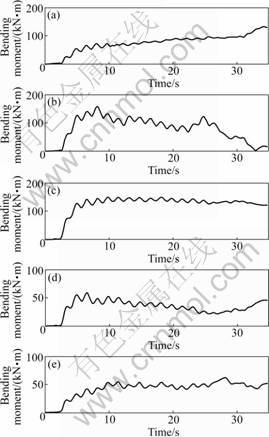
Fig.9 Histories of pile moments in CP3 at different heights of measurement: (a) 1.75 m; (b) 3.50 m; (c) 5.25 m; (d) 7.00 m; (e) 8.75 m
with the displacement characteristics of the soil slope. Pile deformation and bending moment are primarily caused by soil displacement, which is completed during the early shaking stage when the input acceleration amplitude is the greatest. Moreover, the soil displacement is irreversible in the slope, resulting in the roughly stable pile moment most of the time. During model tests of pile foundations in laterally spreading ground subjected to real earthquake motions [8], pile moments show different patterns varying with time during the input earthquake. This observation, if used in conjunction with results from EP1 and EP2 in this work, suggests that soil displacement affects pile moment variation.
For test EP1, the values of Mmax from SG2 to SG6 are 53.2, 77.7, 171.4, 265.1 and 226.8 kN?m, meaning that the moments first increase and then decrease from the pile tip to the head. The results from EP2 and CP3 also show the same tendency. Fig.10 shows the distribution of maximum moments during and at the end of the shaking versus height in three cases. The maximum moment occurs at the height of 3.50 m, the low�Cmiddle section of the pile, suggesting an interface between passive resistance and active slide pressure

Fig.10 Variation of maximum bending moments of pile
applying to pile body. Below 3.50 m, passive resistance from the down-slope soil is predominant; while on the section above 3.5 m, active slide pressure may be the major force on the pile. The maximum moment profile may benefit greatly in determining the interface height of the passive and active forces on the pile. Comparing the bending moments of EP1 and EP2 at the same height reveals that Mmax of EP1 is 1.2-2.3 times as large as of EP2, while the input acceleration amplitude of EP1 is 1.5 times as large as that of EP2. This characteristic may contribute to estimating the loading magnitude on a stabilizing pile in a slope subjected to similar earthquake loads.
Histories of pile moments for model CP3 during excitation with cyclic motion, presented in Fig.9, show some different characteristics from those of EP1 and EP2 under realistic earthquake motions. Apart from the long-period permanent components, relatively low-frequency cyclic components obviously exist within the overall moments. There are 16-18 cycles during the whole procedure of shaking, and the frequency is nearly the same as the cyclic input motion. Generally, most of the moments except for SG6 at 1.75 m height reach maximum values in 8-20 s after the shaking begins and then starts vibrating at the input frequency. This phenomenon may reveal that soil displacement was completed but will possibly vibrate around the permanent displacement.
Fig.10 demonstrates that for CP3, the maximum moment also occurs at the height of 3.50 m, the same height as that of the previous two cases. The maximum moment, 157.8 kN?m, is much smaller than that in EP1 but a little larger than that in EP2.
5 Dynamic earth pressure
Lateral loads applied to piles are essentially important for the design and safety evaluation of piles. Several solutions were developed to solve dynamic earth pressure problems. The pseudo-static analysis considering seismic inertial effects based on the Mononobe-Okabe theory [18] is most widely used in design principles. However, there are few experimental measurements of lateral loads on a stabilizing pile in a slope because of the complexity of these problems.
Figs.11 and 12 present the histories of dynamic earth pressures recorded during shaking. The initial pressure values caused by soil self-weight are removed to consider only the dynamic components of the pressure.

Fig.11 Histories of dynamic earth pressure in EP1 and EP2 at different heights of measurement: (a) 2.63 m; (b) 4.38 m; (c) 6.13 m; (d) 7.88 m; (e) 9.63 m
From the histories of models EP1 and EP2 shown in Fig.11, the dynamic earth pressures show similar variations to the bending moments recorded in these two models. The pressures rise to the first peak values within 4.70 s after the motion is input, and the values continue increasing to the peak at 7.10 s, by this time the main part of the motions are imparted. After that, most of the pressure histories remain roughly stable except for the histories recorded at 6.13 m and 2.63 m height in EP1.
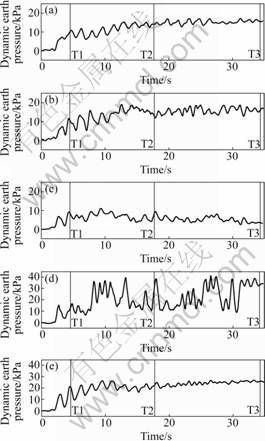
Fig.12 Histories of dynamic earth pressure in CP3 at different heights of measurement: (a) 2.63 m; (b) 4.38 m; (c) 6.13 m; (d) 7.88 m; (e) 9.63 m
Three representative time points, T1, T2 and T3, are noted in Figs.11 and 12, and the profiles of dynamic earth pressure versus height at these points as well as maximum pressures are plotted in Fig.13.
For models EP1 and EP2, the maximum dynamic earth pressures are 35.6 and 21.5 kPa, respectively, occurring at a height of 9.63 m, below the slope surface. Opposite to the distribution of static earth pressures, the dynamic earth pressures measured at positions higher than 6.50 m show a steady increase with the increase of height of pile. It is the potential failing mass that causes the relative high excess dynamic earth pressure. On the substratum section of the earth structure below 6.50 m, the pressure is fairly small compared with the maximum value because there is almost no sliding mass in this section. In addition, it is observed that the pressure at positions higher than 6.50 m in model EP1 is 1.6-1.8 times as large as that in model EP2, demonstrating that stronger earthquake loading will result in more extensive potential failure of slopes.
Fig.12 presents the histories of the dynamic earth pressures in model CP3. The histories consist of a permanent component and a cyclic component during the whole course of shaking. Generally, the permanent

Fig.13 Variation of maximum dynamic earth pressures under different models: (a) EP1; (b) EP2; (c) CP3
components of all five histories increase gradually with the increase of time. This tendency is different from that of EP1 and EP2 because the real earthquake motions reach peak values soon and keep large magnitudes only in narrow periods of time while the cyclic motion keeps the peak value almost in the whole duration. Regarding the cyclic component, there are 16-18 cycles, and the vibration frequency is similar to the input cyclic motions. Vertical profiles of the dynamic earth pressure shown in Fig.13 indicate that the maximum pressure occurs at a height of 7.88 m. The pressure in the slope section is much greater than that of the substratum section.
6 Conclusions
(1) Acceleration histories and response spectra analyses reveal the seismic response mechanisms of the slopes. Under excitation of a realistic earthquake, compared with a nonreinforced slope, the overall response of the slope with pile reinforcement is obviously mitigated by the pile, and the soil surrounding the pile is restrained. Spectral analyses show that the natural frequency of the pile-reinforced slope is around 6.5 Hz. The natural frequency of reinforced slope is augmented. For the model under cyclic input motions, response amplitudes at different locations in the slope are almost the same, indicating no significant response amplification that is observed in the other model tests in this work under actual earthquake ground motions.
(2) Dynamic bending moments indicate the downslope direction of pile deformation. Each moment history under the adjusted El Centro earthquake reaches its maximum soon after the shaking starts and then remains roughly stable until the end of shaking. Maximum moments occur on the deeper section of the pile, indicating the interface between active loading and passive resistance region. Under cyclic input motions, the moment histories show some different characteristics from those under earthquake motions. Apart from the long-period permanent components, low-frequency cyclic components obviously exist in the whole course of shaking. The time at which the bending moment reaches the maximum value is later than that for models EP1 and EP2.
(3) The records of dynamic earth pressures show that the pressures increase rapidly to the peak values shortly after the excitation of the input El Centro earthquake. After that, most pressure histories decrease a little and then remain stable. The dynamic earth pressure at positions higher than 6.50 m shows a steady increase with the increase of height of pile, which is opposite to the distribution of the static earth pressure. In the substratum section of the earth structure, below 6.50 m, the pressure is fairly small, compared with the maximum value. The pressure histories under cyclic motion also show vibration characteristics; however, they increase gradually over a long period.
References
[1] Zhao Ming-jie, He Guang-chun, Wang Dou-yin. Treatment techniques in slope engineering [M]. Beijing: China Communications Press, 2003: 89. (in Chinese)
[2] Ito T, Matsui T. Methods to estimate lateral force acting on stabilizing piles [J]. Soils and Foundations, 1975, 15: 43-59.
[3] Ito T, Matsui T, Hong W P. Extended design method for multi-row stabilizing piles against landslide [J]. Soils and Foundations, 1982, 22: 1-13.
[4] Hassiotis S, Chameau J L, Gunaratne M. Design method for stabilization of slopes with piles [J]. Journal of Geotechnical and Geoenvironmental Engineering, 1997, 123(4): 314-323.
[5] YANG Xiao-li, SUI Zhi-rong. Seismic failure mechanisms for loaded slopes with associated and nonassociated flow rules [J]. Journal of Central South University of Technology, 2008, 15(3): 276-279.
[6] Dai Zi-hang. Study on distribution laws of landslide-thrust and resistance of sliding mass acting on antislide piles [J]. Chinese Journal of Rock Mechanics and Engineering, 2002, 21(4): 517-521. (in Chinese)
[7] Abdoun T, Dobry R, O��Rourke T, Goh S H. Pile response to lateral spreads: Centrifuge modeling [J]. Journal of Geotechnical and Geoenvironmental Engineering, 2003, 129(10): 869-878.
[8] Brandenberg S J, Boulanger R W, Kutter B L, Chang D. Behavior of pile foundations in laterally spreading ground during centrifuge tests [J]. Journal of Geotechnical and Geoenvironmental Engineering, 2005, 131(11): 1378-1391.
[9] Taji Y, Sato M, Yanagisawa E. Modeling of a prototype soil�Cpile-structure system during seismic ground liquefaction [C]// Proceedings of the Centrifuge 98. Rotterdam: Balkema, 1998: 283-288.
[10] Satoh H, Ohbo N, Yoshizako K. Dynamic test on behavior of pile during lateral ground flow [C]// Proceedings of the Centrifuge 98. Rotterdam: Balkema, 1998: 327-332.
[11] Horikoshi P, Fujiwara T, Tateishi A. Pile behavior during seismically-induced lateral spreading of liquefied sand [C]// Proceedings of the Centrifuge 98. Rotterdam: Balkema, 1998: 337-382.
[12] Boulanger R W, Curras C J, Kutter B L, Wilson D W, Abghari A. Seismic soil-pile-structure interaction experiments and analyses [J]. Journal of Geotechnical and Geoenvironmental Engineering, 1999, 125(9): 750-759.
[13] LI Rong-jian. A study on the aseismic reinforcing mechanism of stabilizing piles in soil slope [D]. Beijing: Tsinghua University, 2008: 37-82. (in Chinese)
[14] YU Yu-zhen, DENG Li-jun. Centrifuge modeling of seismic behavior of slopes reinforced by stabilizing pile [J]. Chinese Journal of Geotechnical Engineering, 2007, 29(9): 1320-1323. (in Chinese)
[15] Yu Yu-zhen, Deng Li-jun, Sun Xun, Lu He. Centrifuge modeling of slope response to earthquake [J]. Bulletin of Earthquake Engineering, 2008, 6(3): 447-461.
[16] Madabhushi S P G, Haigh S K, Subedi B R. Seismic behavior of steep slopes [C]// Proceedings of Physical Modeling in Geotechnics. Rotterdam: Balkema, 2002: 489-494.
[17] Taboada-Urtuzuastegui V M, Martinez-Ramirez G, Abdoun T. Centrifuge modeling of seismic behavior of a slope in liquefiable soil [J]. Soil Dynamics and Earthquake Engineering, 2002, 22: 1043-1049.
[18] Mononobe H. Considerations into earthquake vibrations and vibration theories [J]. Journal of Japan Society of Civil Engineers, 1924, 10(5): 1063-1094. (in Japanese)
(Edited by YANG You-ping)
Foundation item: Project(50639060) supported by the National Natural Science Foundation of China; Project(610103002) supported by the State Key Laboratory of Hydroscience and Engineering, Tsinghua University, China
Received date: 2009-12-10; Accepted date: 2010-03-18
Corresponding author: YU Yu-zhen, Professor; Tel: +86-10-62797200; E-mail: yuyuzhen@tsinghua.edu.cn

