J. Cent. South Univ. Technol. (2007)02-0196-06
DOI: 10.1007/s11771-007-0039-7 
Optimization strategies for separation of sulfadiazines using Box-Behnken design by liquid chromatography and capillary electrophoresis
GONG Wen-jun(���ľ�)1, ZHANG Yu-ping(��ԣƽ)1, ZHANG Yi-Jun(�����)1, XU Guang-ri(������)1,
WEI Xin-jun(κ�¾�)1, LEE Kwang-pill2
(1. Henan Institute of Science and Technology, Xinxiang 453003, China;
2. Department of Chemistry, Graduate School, Kyungpook National University, South Korea)
Abstract: Development of effective chromatographic or electrophoretic separation involves judicious deciding of selection of optimal experimental conditions that can provide an adequate resolution at a reasonable run time for the separation of interested components. Box-Behnken factorial design was effectively applied for the separation optimization of eight structurally related sulfonamides using capillary zone electrophorosis and reverse high performance liquid chromatography. Optimum values for volume ratio of THF to H2O in eluent, column temperature and flow rate of eluent are found as 12 to 88, 35 �� and 1.0 mL/min, respectively. Box-Behnken modified optimization model is extended to separation by capillary electrophoresis (CE). While using CE, a satisfactory separation is achieved with a minimum resolution larger than 1.0 for a separation time less than 10 min.
Key words: Box-Behnken design; high performance liquid chromatography; capillary electrophoresis; sulfadiazine; multi-criteria decision
1 Introduction
Separation and monitoring of sulfonamides are given priority in recent periods, which belong to the family of antibiotics and are widely used for treating bacterial infections. The usage of these compounds is regulated as it may cause side-effects to health problems. In the present study, a mathematical model was evolved for the separation of eight sulfadiazine classes of compounds by high performance liquid chromatography (HPLC) and capillary electrophoresis (CE) as well. Box-Behnken factorial design was applied for the optimization to obtain the satisfied resolution and rapid analytical speed[1-2]. Compared with the traditional optimization method, it has some advantages such as the use of minimum number of experiments, shorter time of operation and feasiblity of generating data that may be analyzed statistically to provide valuable information on the interactions among experimental parameters. The Box-Behnken design is an independent quadratic design in which it does not contain an embedded factorial or fractional factorial design. In this design the treatment combinations are at the midpoints of edges of the process space and at the center. These designs are rotatable(or near rotatable) and require three levels of each factor as well as fifteen statistical experiments were designed to develop this mathematical model by establishing an empirical equation using the minimum effective resolution and maximum retention as a function of three factors. Diagrams of global optimum, which are more direct and visual with a Pareto-optimal plot, were made[3]. Optimum conditions for the separation of eight compounds were predicted and tested experimentally. We have also extended this design for capillary zone electrophoresis and optimize the least resolution and migration time for the eight structurally related sulfonamides.
2 Experimental
2.1 Chemicals
Sulfadiazines standard samples were kindly provided by Department of Food Engineering, Henan Institute of Science and Technology. Tetrohydrofuran (THF), phosphate buffers and other reagents were purchased from Beijing Chemical Reagent Company and Luoyang Chemical Reagent Company, China. All solvents used were of HPLC or analytical reagent grade. Distilled water was obtained from a super-purification system (Danyangmen Corporation, Jiangsu, China). All solutions were degassed with ultra-sonication and filtered through a membrane (0.45 ?m) before use. In typical chromatographic or electorphoretic experiment, sulfadiazine compounds were dissolved in methanol and injected for peak identification. For the separation of the eight sulfadiazines, the compounds were properly mixed and used for the optimization of conditions and effective separations.
2.2 Apparatus
Chromatographic measurements were made on a HP1100 Series HPLC system (Agilent Technologies, Inc., Walbronn, Germany) equipped with a quaternary pump, a vacuum degasser module, a Rheodyne injector with a 20 ?L sample loop, a temperature controlled column compartment and a variable wavelength UV detector set at 265 nm. A HPLC separation was performed on a 15 cm��4.6 mm area, i.d., stainless steel column packed with ZORBAX SB-C18 (5 ?m particle size, 10 nm pore size). CE separation was performed with a HP 3DCE system with a photodiode array detector (Agilent Technologies, Inc., Walbronn, Germany). An uncoated fused-silica capillary of 75.0 ?m I.D. and 80.5 cm (72 cm effective length) and a high sensitivity detection cell were used. The capillary was conditioned before each analysis by flushing successively with H2O, and buffered for 1 min, respectively. Samples were injected with a pressure of 5 kPa for 5 s and separated at 20-30 kV. Data were collected in the range of 190-600 nm and processed with CE ChemStation software.
2.3 Software
Microsoft Excel Program (Microsoft Corporation) was used for setting the polynomial equations and the statistical analysis of the response variables. Origin 6.0 (OriginLab Corporation) was used for making the response surface diagrams.
3 Results and discussion
3.1 Experimental design for HPLC separation
In the present work, volume fraction of the eluent (THF), flow rate and column temperature were optimized to effectively separate the eight sulfadiazines by employing the experimental design strategy similar to the methodology adopted elsewhere[4]. Fifteen experimental conditions were chosen from the strategic positions in a cubic diagram (Fig.1). These experimental conditions are described in Table 1. Maximum and minimum contents of THF (x1) were fixed as 12% and 8%, respectively. Likewise, a minimum and maximum values for flow rate of the Box-Behnken experimental design for three mobile phase (x2) were selected as 0.8 mL/min and 1.2 mL/min, respectively. Column temperature (x3) was kept between 15 �� and 35 ��. The minimum effective resolution among the eight peaks (resolution of the least resolved pair of peaks) and the maximum retention time (for the last eluting peak) were noted as responses to these experiments.

Fig.1 Boc-Behnken design
Results of the selected fifteen experiments (Table 1) for the separation of the compounds were effectively used to evaluate the resolution (Rs) between each pair of peaks through Rs=2(t2-t1)/(��2+��1), where t1 and t2 are the retention times of two adjacent peaks, w1 and w2 are the widths of the two pairs of peaks. The experimental responses were then fitted into the following polynomial equation[5-6]:
Y=��0+��1x1+��2x2+��3x3+��12x12+��13x13+��23x23+
��11x12+��22x22+��33x32 (1)
Table 1 Optimization parameters of HPLC for Box-Behnken experimental design and response results for minimum resolution and retention time
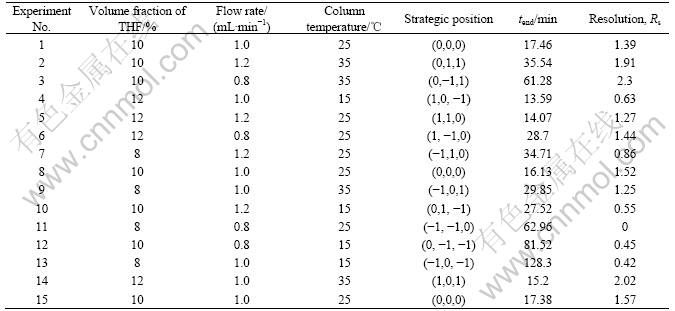
where Y is the response to be modeled (resolution and retention time); ��i, ��ij are the coefficients of each factor. The coefficients appeared in the above equation were determined using Microsoft Excel Regression Kit. By knowing the coefficients, the function of experimental responses related to the three factors was obtained. The coefficients of the second-order polynomial model were estimated by the least square regression analysis. The equation models for the minimum resolution (Y1) and the retention time (the last eluted peak Y2) were as follows:
Y1=-23.47+2.704x1+17.677x2+0.06x3-0.644x1x2+
0.007x1x3-0.061x2x3-0.103x12-4.729x22 (2)
Y2=1 286-88.5x1-728.1x2-28.2x3+8.51x1x2+
1.06x1x3+3.53x2x3+2.14x12+239x22+0.249x32 (3)
These data from Box-Behnken were entered into the Microsoft Excel Program, which produced a correlation between observed and predicted response to test the validity of the models. The correlation between the predicted and experimental responses can be visualized through linear relations (Figs.2(a) and (b)). R2 values of the minimum resolution and the maximum retention time were 0.94 and 0.87 respectively. For a valid model, R2 should be ��0.6. The observed higher R2values give a clue that the predicted conditions using the Box-Behnken model would be an index for accuracy for the experimental usage.
Generally, responses (resolution, retention time) were usually transformed into an appropriate desirability scale to balance between desired resolution and minimization of analysis time. In that process, different weight factors are to be assigned for each of the responses. Larger and smaller weight factors can be given to more important responses and less important responses, respectively[7].. After obtaining the individual desirabilities for each of the response, they were combined to get a measure of the composite desirability of the multi-response system. This is the measure of the weighted geometric average of the individual desirabilites or the responses. Sometimes, difficulties may arise in
choosing different weights according to the importance of different factors. In such cases, a desirable or comprising condition can be used by Pareto strategies. Interestingly, this strategy does not require any preliminary information. As a result, a compromise between different criteria can be visualized. The Pareto-optimal plot is depicted in Fig.3. The three factors were combined to generate 45 combinations with x1�� x2��x3 ere x1 consisted of 5 levels��8%��9%��10%��11%��12%��, x2 consisted of 3 levels (0.8, 1.0, 1.2 mL/min) and x3 consisted of 3 levels (15��25��35 ��). It was further decided to optimize the chromatographic separation efficiency based on two objectives: resolution as a measure of the quality of separation and the analysis time as a measure of the cost of analysis. Here, the minimum effective resolution (resolution of the least resolved pair of peaks) and the maximum retention time(for the last eluting peak) of 45 combinations were visually plotted in the two-dimensional plot. The requirements of separations were as follows: tend=15 min and Rs =1.25.
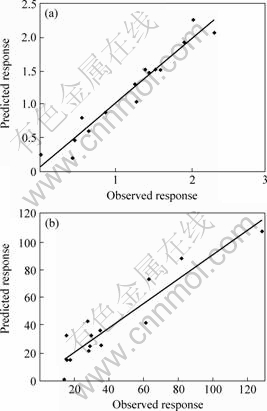
Fig.2 Correlation of predicted responses vs. observed responses(a) Minimum resolution; (b) Retention time
The points (quadrant left-above in Fig.3) are called non-inferior combination or Pareto-optimal points. All other points in the feasible criteria space are inferior to these points. The points in the feasible criteria space are Pareto-optimal points (if no other point exists in that space) that can give improvement in any criterion without affecting the other criterion. To test the validity of this optimization scheme and obtain the optimum separation, one point within Pareto-optimal range in Fig.3 was selected to perform the experiments. The success of the predictions through the modified Box-Behnken model in this study can be seen in the effective separation of eight sulfadiazines under the optimum conditions. The eight sulfadiazines were baseline-separated within 16 min with a minimum resolution larger than 1.5 (Fig.4).
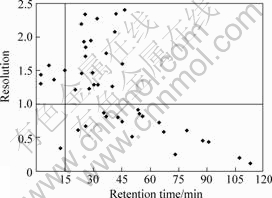
Fig.3 Plot of feasible criteria space Pareto-optimality
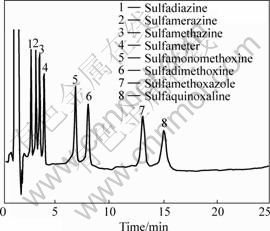
Fig.4 Chromatography of 8 sulfonamides dotained under optimal conditions
(Flow rate 1.0 mL/min, V(THF)/V(H2O)=12%, column temperature 35?, wavelength 265 nm)
3.2 Comparative separation of sulfopnamides using capillary zone electrophoresis
The modified Box-Behnken design was extended for electrophoretic separation by the capillary zone electrophoresis (CZE) for the same compounds. These compounds were usually separated as negatively charged species by CZE at an optimum pH value in the range of 6.0-8.0 using various types of buffer, with or without the addition of electrolyte modifier[8-10]. Precise optimization of buffer pH is curial to further improve the separation of sulfonamides[11]. It is possible to improve the separation efficiency and resolution by altering the capillary temperature and operating voltage in the separation of a mixture of analytes. Fifteen experiments were also chosen and carried out similar to HPLC method. Maximum and minimum for pH (x1) were fixed as 6.6 and 7.0, respectively. Likewise, voltage (x2) was operated in the range of 20-30 kV with a capillary temperature (x3) of 20-30 ��. The response data obtained for the minimum resolution (Rs) and migration time (tend) are given in Table 2. By using a fitted full quadratic model Eqn.(2), a response surface regression analysis for each response factor was performed.
Table 2 Response results for resolution (Rs) and migration time of last peak (tend) using Box-Behnken experimental design in CE

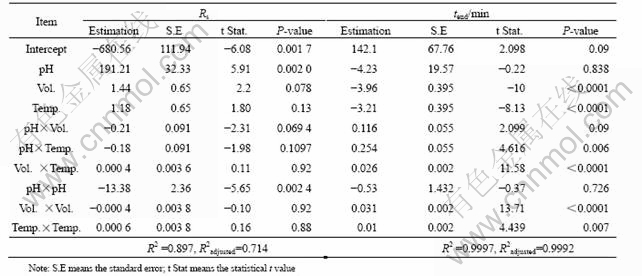
The estimation of experimental error variance allows the significance of the coefficients to be evaluated and analysis of variance (ANOVA) to be carried out. The ANOVA (Table 3) pointed out that the regression models assumed were significant, thus indicating that the change in the observed response was due to the level change of factors. Using a 5% significance level, a factor is considered to affect the response if the coefficients differ from zero significantly and P-value is less than 0.050. From Table 3, it can be seen that the minimum resolution was most significantly affected by the pH value of the buffer (P value of 0.002). In addition, separation voltage and temperature were significant to the migration time of the last peak, with P value less than 0.050 respectively.
Table 3 Estimation (coefficients of linear model founded by least squares) of parameters in linear model and hypothesis test
Response surface diagrams were produced for each response. Since the model has more than two factors, one factor was held constant in making the diagram. Fig.5 shows the response surface diagrams for the buffer pH and voltage for two responses, keeping the temperature at 30 ��. For obtaining satisfactory separation with the maximum Rs, pH should be kept around 6.75. Also, increase in the operating voltage and pH were shown to be advantageous for fast separation.

Fig.5 Response surface and contour of minimum resolution (a) and migration time (b) for buffer pH and voltage at constant capillary temperature of 30 ��
To validate the optimization as predicted by us through Box-Behnken design, three more supporting experiments in the optimal range were carried out. Experimental conditions were selected according to the response diagrams (Fig.5) and electropherogram obtained using one of the conditions is presented in Fig.6. The predicted values agree well with experimental values and support our modified approach, with average errors less than 10% and 5% for the minimum resolution and the migration time, respectively. The optimum conditions were established to be 35 mmol/L phosphate buffer at pH 6.75 and an applied voltage of 30 kV with a temperature control at 30 ��.
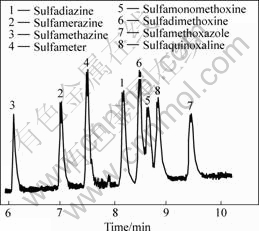
Fig. 6 Electropherogram of 8 sulfonamides obtained under optimal conditions
4 Conclusions
1) The comparative study shows that capillary electrophoresis CE offers a few advantages compared with HPLC for the separation of the studied compounds. CE offers advantages like easy operation and less cost for the separation in comparison with HPLC.
2) Box-Behnken design can be used with suitable modifications and improvements in HPLC and CE to predict the optimal parameters for the resolution.
3) The optimized conditions could be experi- mentally used for the analytical separation of various sulfadiazines with defined resolution and separation time using chromatographic and electrophoretic methods.
References
[1] ZHANG Y P, LEE K P, KIM S H, et al. Comparative study on the chiral separation of phenyl alcohols by capillary electrophoresis and liquid chromatography[J]. Electrophoresis, 2004, 25: 2711-2719.
[2] RAGONESE R, MACKA M, HUGHES J, PETOCZ P. The use of the Box�CBehnken experimental design in the optimisation and robustness testing of a capillary electrophoresis method for the analysis of ethambutol hydrochloride in a pharmaceutical formulation[J]. J Phar Bio Anal, 2002, 27: 995-1007.
[3] CORSTJENS H, BILLIET H A H, FRANK J, et al. Optimisation of selectivity in capillary electrophoresis with emphasis on micellar electrokinetic capillary chromatography[J]. J Chromatogr A, 1995, 715: 1-11.
[4] HOWS M E P, PERRETT D, KAY D J. Optimisation of a simultaneous separation of sulphonamides, dihydrofolate reductase inhibitors and ��-lactam antibiotics by capillary electrophoresis[J]. J Chromatograph A, 1997, 768: 97-105.
[5] HARANG V, TYSK M, WESTERLUND D, et al. A statistical experimental design to study factors affecting enantioseparation of propranolol by capillary electrophoresis with cellobiohydrolase (Cel7A) as chiral selector[J]. Electrophoresis, 2002, 23: 2306-2319.
[6] ZHANG Y P, ZHANG Y J, GONG W J, et al. Rapid separation of Sudan dyes by reverse high performance liquid chromatography through statistically designed experiments[J]. J Chromatogra A, 2005, 1098: 183-187.
[7] AKESOLO U, GONZALEZ L, JIMENEZ R M, et al. Multivariate optimisation of a cyclodextrin-assisted-capillary zone electrophoretic method for the separation of torasemide and its metabolites[J]. J Chromatogra A, 2003, 990: 271-279.
[8] FUH M R S, CHU S Y. Quantitative determination of sulfonamide in meat by solid-phase extraction and capillary electrophoresis[J]. Anal Chim Acta, 2003, 499: 215-219.
[9] JALALI-HERAVI M, GARLANI-NEJAD Z. Prediction of electrophoretic mobilities of sulfonamides in capillary zone electrophoresis using artificial neural networks[J]. J Chromatogr A, 2001, 927, 211-218.
[10] LIN C E, LIN W C, CHEN Y C, et al. Migration behavior and selectivity of sulfonamides in capillary electrophoresis[J]. J Chromatogr A, 1997, 792: 37-47.
[11] LIN C E, CHANG C C, LIN W C. Migration behavior and separation of sulfonamides in capillary zone electrophoresis II. Positively charged species at low pH[J]. J Chromatogr A, 1997, 759: 203-209.
Foundation item: Project(20235010) support by the NSFC-KOSEF Scientific Cooperation Program; Project supported by the Program for New Century Talents of University in Henan Province; Program for Backbone Teacher in Henan Province, China
Received date: 2006-06-25; Accepted date: 2006-08-18
Corresponding author: ZHANG Yu-ping, Professor, PhD; Tel: +86-373-3040861; E-mail: yupzhang@hotmail.com
(Edited by YANG Bing)

