Online monitoring and assessment of energy efficiency for copper smelting process
来源期刊:中南大学学报(英文版)2019年第8期
论文作者:宋彦坡 陈卓 祝振宇 王晓娜
文章页码:2149 - 2159
Key words:energy consumption; energy efficiency; online assessment; copper flash smelting
Abstract: The copper flash smelting process is characterized by its involvement of wide energy sources and high energy consumption, so the energy conservation is usually a highly concerned topic for the flash smelting enterprises. However, due to the complexity of the system, it is quite difficult to perform a timely comprehensive analysis of the energy consumption of the whole production system. Aiming to realize an online assessment of the energy consumption of the system, great effort was first made in Jinguan Copper, Tongling Nonferrous Metals Group Co. Ltd. Methods were proposed to solve technical difficulties such as the acquisition and processing of data with different sampling frequencies, the online evaluation of the electricity consumption, and timely evaluation of product output in the periodic process. As a result, a software system was developed to make the online analysis of the energy consumption and efficiency from the three levels ranging from the system to the equipment. The analytical results at the system level was introduce. It’s found that electricity is the most consumed energy in the system, accounting for 77.3% of the total energy consumption. The smelting unit has the highest energy consumption, accounting for 52.8% of the total energy consumed in the whole enterprise.
Cite this article as: CHEN Zhuo, ZHU Zhen-yu, WANG Xiao-na, SONG Yan-po. Online monitoring and assessment of energy efficiency for copper smelting process [J]. Journal of Central South University, 2019, 26(8): 2149-2159. DOI: https://doi.org/10.1007/s11771-019-4162-z.

ARTICLE
J. Cent. South Univ. (2019) 26: 2149-2159
DOI: https://doi.org/10.1007/s11771-019-4162-z

CHEN Zhuo(陈卓), ZHU Zhen-yu(祝振宇), WANG Xiao-na(王晓娜), SONG Yan-po(宋彦坡)
School of Energy Science and Engineering, Central South University, Changsha 410083, China
 Central South University Press and Springer-Verlag GmbH Germany, part of Springer Nature 2019
Abstract: The copper flash smelting process is characterized by its involvement of wide energy sources and high energy consumption, so the energy conservation is usually a highly concerned topic for the flash smelting enterprises. However, due to the complexity of the system, it is quite difficult to perform a timely comprehensive analysis of the energy consumption of the whole production system. Aiming to realize an online assessment of the energy consumption of the system, great effort was first made in Jinguan Copper, Tongling Nonferrous Metals Group Co. Ltd. Methods were proposed to solve technical difficulties such as the acquisition and processing of data with different sampling frequencies, the online evaluation of the electricity consumption, and timely evaluation of product output in the periodic process. As a result, a software system was developed to make the online analysis of the energy consumption and efficiency from the three levels ranging from the system to the equipment. The analytical results at the system level was introduce. It’s found that electricity is the most consumed energy in the system, accounting for 77.3% of the total energy consumption. The smelting unit has the highest energy consumption, accounting for 52.8% of the total energy consumed in the whole enterprise.
Key words: energy consumption; energy efficiency; online assessment; copper flash smelting
Cite this article as: CHEN Zhuo, ZHU Zhen-yu, WANG Xiao-na, SONG Yan-po. Online monitoring and assessment of energy efficiency for copper smelting process [J]. Journal of Central South University, 2019, 26(8): 2149-2159. DOI: https://doi.org/10.1007/s11771-019-4162-z.
1 Introduction
As the energy shortage and the environmental protection are better acknowledged by the society, the energy conservation has become an important theme nowadays in the industrial enterprises, and to some extent becomes a key issue to their development. To achieve the energy-saving targets, the energy-saving transformation has been one of the most widely used measures, including eliminating the high energy-consuming equipments, improving the energy efficiency through system modification, and adopting waste heat recovery technologies [1, 2]. Meanwhile, optimization of the energy system is also an important method for the energy-saving purpose. It is not only to expand the energy sources from heavy oil and natural gas to renewable fuel such as biofuel [3] and solar energy [4], but also to give guidance for process operations based on the analysis of equipment/system energy efficiency.
The evaluation of energy efficiency has been widely used in studies of buildings and indoor facilities, for example, analyzing the energy consumption in offices [5, 6], air-conditioning [7, 8], ventilation systems [9] and elevator controllers [10]. Models have also been developed for energy efficiency analysis of industrial equipments, such as electric and induction motors [11, 12], turbine generator [13], condensing boiler [14] and MEE-MSF (multi effect evaporation and hybrid multi effect evaporation multi-stage flash) systems [15]. Applications were then quickly spread to energy studies of the wastewater treatment plants [16], manufacturing systems [17, 18] and waste heat recovery systems [19, 20].
Heat balance is the basis of most models for the energy efficiency analysis. The result of the heat balance calculation generally tells how the energy quantities change in the system, and it cannot reflect the difference in the quality of energy flowing through the equipment/system. Therefore, the exergetic analysis was adopted, and models introduced by ARAUJO [21], YARI [22], KELLY et al [23] and SINGH et al [24] have been developed in analysis of the distillation processes, geothermal power plants, solar thermal power system and so on. The techno-economic assessment models were also developed and applied in the study of the renewable energy system [25, 26].
The energy efficiency evaluation and analysis have also been carried out in the high-energy consumption enterprises such as the steel, non-ferrous metallurgical and petrochemical industries. JIANG et al [27] and GE [28] calculated the income and expense distribution of energy and exergy in the energy analysis of the blast furnace and alumina production, respectively. ANDERSEN [29] carried out analysis of the material flow and energy flow in a steel industry with the end-use model and the process-step model respectively, and made a detailed comparison of the differences between the two models. NAJDENOV et al [30] and HE [31] provided suggestions to improve the energy efficiency after making an analytical study of the energy consumption in the copper smelting process. SIITONEN et al [32] calculated the specific energy consumption with different boundaries at the process level and the mill level, and developed an index to analyze the energy efficiency. LIU [33] summarized the energy flow at the process level and constructed a mathematic model to calculate the energy flow in the whole steelworks according to the input and output balance. LIU et al [34] developed a hierarchical SDA model to analyze the key factors resulting in the energy consumption changes in a steel plant. GAO et al [35] built the energy index system of different layers and developed a multi-stage energy efficiency evaluation method to make a comprehensive evaluation for a petrochemical enterprise.
Though the analysis of energy consumption and efficiency has been carried out widely for the production process, it is still limited to offline running and the equipment or process level. The difficulties encountered in the online energy analysis of the whole process as resulted from three aspects, i.e., the synchronous data acquisition, the unified measurements of different energy media, and the timely measurement of the production output. This is particularly difficult for the non-ferrous metallurgical enterprises, because they are usually characterized by their complex production processes, involvement of a good variety of energy media, and the lack of modern testing measures. Therefore, seeking solutions to these problems is the premise for carrying out an online analysis of the energy utilization and efficiency in a non-ferrous metallurgical enterprise.
Sponsored by the Science and Technology Research Project of Anhui Province, China, efforts were first made in the Jinguan Copper, Tongling Non-ferrous Metal Group Co. Ltd., to realize an online monitoring and analysis of energy consumption and efficiency at three levels, i.e. the equipment level, the process level and the system level. The energy analysis at the system level includes two parts. One is to calculate the amount of different energy media (electricity, natural gas, diesel and water) consumed in the production system, and the other is to show how the energy media flow and distribute in the system. For the energy analysis at the process level, the whole production system is divided into six units according to the functional partitioning, that is, the mineral processing unit, the smelting unit, the electrolysis unit, the sulfuric acid unit, the public utility unit and the office unit. Except that the public utility unit and the office unit are consisted of processes for the same service function, other units at the process level are defined based on the production process, and characterized by the purpose of producing a certain product, from the beginning of the main raw material entering the process to the completion of the intermediate product exiting the process. The energy analysis at the process level then includes the calculation of the energy consumption, the energy efficiency and the unit product energy consumption in the process of each unit. At the equipment level, the analysis is only for the key energy-consuming equipment in a process, and it is to calculate the values of the energy consumption, the energy efficiency, and the energy consumption per unit of product of these key equipments. Solutions to difficulties such as the acquisition and processing of data with different sampling frequencies, the online evaluation of the unit electricity consumption, and the timely evaluation of the product output for the periodic process are to be introduced in the paper, and examples of the online analysis of the energy flow in the system are illustrated as well.
2 Energy consumption in Jinguan Copper
The Jinguan Copper company adopts the double flash technology (i.e. the flash smelting and the flash converting technology) to produce the cathode copper, the sulfuric acid and other by-products. A good variety of energy media including electricity, diesel, natural gas and water are used in the production process [36]. The main material and energy flows in the production system are shown in Figure 1.
On the whole, the production and the energy consumption system in the enterprise is a typical hierarchical structure. The production system is on the top of the structure. The six process units can be regarded as the primary subsystems at the second level. A number of processes in a particular unit are the secondary subsystems at the third level. And the single equipment in a specific process is the fourth level at the bottom of the structure. Hence, a multi-level structure for the online assessment of the system consumption and efficiency is established.
3 Solutions to technical difficulties in online energy analysis
The energy consumption system of Jinguan Copper is complicated. The complexity lies in two aspects. One is that the system consists of both pyro- and hydro- metallurgical processes and many types of energy media, and the other is that the statistical time scale of the product and energy data is inconsistent between processes of the system. For example, the acquisition frequency of the production data is 1 s for the flash smelting furnace. However, the statistical cycle of the product output for the anode furnace is a shift (8 h). The large difference between the data sampling time of the processes thus makes it difficult to perform the data acquisition, statistical analysis, and the real-time assessment of the system energy consumption. Therefore, efforts are made to solve the problems of energy data acquisition and timely measurement of product output.
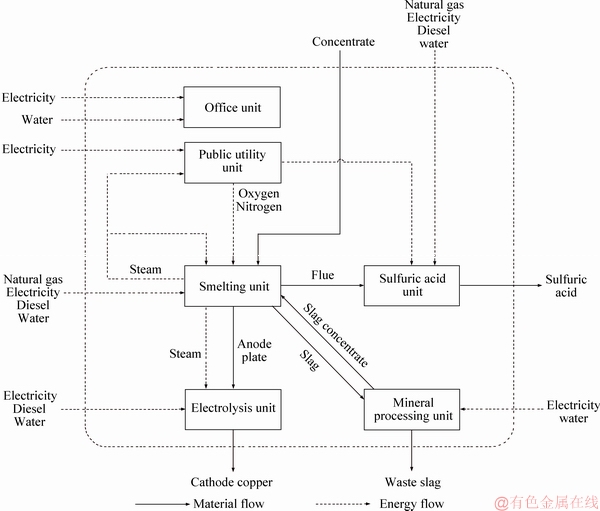
Figure 1 Material and energy flows of whole plant
3.1 Structure of online analysis system
The original data needed for the energy analysis in Jinguan Copper includes three types. The first is the data acquired directly from the DCS system in real time, such as the concentrate feed rate and the air flow rate. The second is the manual input data, such as XRF results of the concentrate and the product output of the cathode copper. The third is some constant data that usually does not need to be modified, such as the material density and the enthalpy value required for the energy efficiency calculation.
The sampling frequencies for different types of data are also different. For instance, the sampling period for the instantaneous data collected from the DCS system is 1 min, and the frequency for the cumulative data collected from the DCS system is once an hour, while for the manual input data and constant data, no sampling and modification with be made until it is required.
In order to analyze the data with different sampling frequency, the data must be first collected and stored, until it is needed to be processed to obtain kinds of energy efficiency indicators. Hence, the software system for the online energy analysis consists of three functional modules to achieve the desired functions, that is, the database module, the energy efficiency calculation module and the results display module (Figure 2). In the data acquisition module, the real-time data are copied from the PI system to the Historian database, and synchronized together with the manual input data as well as the data from the distribution room to the MongoDB where all the data are stored. Afterwards, the energy efficiency calculation module is activated, in which the multi-thread high-speed calculation method is adopted in order to accelerate the calculation speed. The results are then authorized to different users and finally displayed based on the Process book.
3.2 Online data acquisition and correction
The flash copper smelting enterprise has a high degree of automation. Though lots of important energy consumption data can be measured online from the distributed control system, some important data cannot be obtained due to the lack of necessary meters or even proper measurement methods.
The data acquisition refers to the direct collection of raw data required for the calculation of the energy consumption and efficiency. The difficulty results from that the data acquisition frequencies are different for different processes and different data types. For example, for most continuous processes, the data is usually sampled at an interval of 1 s. However, for a period process, the data may not be updated for every 8 h. Besides, the instantaneous data is copied from the DCS system per min, but the accumulated data is collected from the DCS system once an hour, such as the electricity from the distribution room. For the manual input data and some constant data, it will not be revised until needed.

Figure 2 Structure of online energy analysis software system
As the instantaneous data is read directly from the online measurement, its accuracy is easily influenced by either the internal fault of spot meters or the external random interference. When the detection error becomes large, reliability of the data must be judged and correction must be made in order to guarantee the quality of the data.
The way to eliminate the abnormal data is to save at least six consecutive values of the same variable, i. e. the current value I′(k) and the previous five values I(k-i), i=1, 2, 3, 4, 5. If the current value I(k) is beyond the set variation range of the variable, it will then be replaced by the average of the previous five consecutive values, so that the unexpected fluctuation in the data metering can be avoided. The formula for the data correction is shown in Eq. (1).
 (1)
(1)
3.3 Online estimation of electricity consumption
The power supply in Jinguan Copper includes two stages. The 110 kV central step-down substation supplies power to the 10 kV high-voltage power distribution room through the main transformer. The high-voltage power distribution room then supplies power to the low-voltage power distribution rooms and some high-power electrical apparatuses. As the “nearby” principle is adhered in the power supply to the production processes, the supply relationship of the power distribution rooms is complicated. On the one hand, a low-voltage power distribution room may supply power to different processes at the same time, and on the other hand, a production process receives power supply from several distribution rooms. Specifically, in the six process units, there are only two units of which the processes receive the electricity supply respectively from the unique corresponding low-voltage power distribution room. For these processes, the electricity data required for the energy efficiency assessment at the process level can be obtained directly by reading the inlet cabinet display of the low-voltage distribution room.
However, the situation is much more complicated in the units such as the smelting unit, the sulfuric acid unit and the public utility unit. In these units, one low-voltage power distribution room supplies power to several processes, and the power supplied to most equipments is even not metered. So, the electricity supply is hard to be calculated accurately.
In order to solve the technical problem for the online analysis of the energy consumption, a calculation method was proposed to make a timely evaluation of the electricity utilization in different processes.
Supposing the electricity supplied to the process Pi comes from several high-voltage power distribution rooms and several low-voltage power distribution rooms, its power consumption is calculated by:
 (2)
(2)
In which, A is the number of the high-voltage power distribution rooms that directly supply power to the process Pi, and  denotes the amount of electricity power supplied to the process by the high-voltage power distribution room; B is the number of the low-voltage power distribution rooms that directly supply power to the process Pi, and
  denotes the amount of electricity power supplied to the process Pi from the low-voltage power distribution room.
In the high-voltage power distribution room HTa, since the facilities running for the process Pi have their own meters to record the electricity consumption, can be calculated by Eq. (3).
 (3)
(3)
where  is the total electricity consumption of power-consuming facility Ek; K is the number of facilities in the process Pi receiving their electricity supply from the high-voltage power distribution room.
In the low-voltage power distribution room LTb, although some of the high-power facilities in the process Pi have their corresponding meters, most low-power facilities are not metered, and one power distribution room generally provides power supplies to several processes. In the case where one low-voltage distribution room LTb supplies power to m processes (respectively referred to as P1, P2, …, Pm,  , the procedure to calculate the electricity utilization in the process Pi provided by the low-voltage distribution room LTb is as follows.
1) Adding up all the metered electricity of high-power electrical facilities belonging to the process Pi in the low-voltage power distribution room LTb.
2) Subtracting the electricity consumption of all the electrical facilities that have meters in the low-voltage power distribution room LTb from the total electricity consumption in the same room, to obtain the electricity of all processes that are not metered in the room LTb.
3) Multiplying the electricity consumption that is not metered by the distribution coefficient of the process Pi, and get the amount of the electricity which is consumed but not metered by the process Pi.
Therefore, the can be calculated by Eq. (4).
 (4)
(4)
where  is the electricity consumption of Pi which is metered in the low-voltage power distribution room LTb; K is the number of the power-consuming facilities;
  is the total power consumption in the low-voltage power distribution room LTb;
  is the electricity consumed by all the electrical facilities which receive electricity supply from the low-voltage power distribution room LTb ; ci is the distribution coefficient describing the ratio of the un-metered electricity in the power distribution room supplied to the process Pi.
In particular, the distribution coefficient of each power distribution room needs a manual input. It can be estimated according to the power and operating rate of the equipment. For example, supposing a power distribution room suppling power to m processes, the distribution coefficient can be calculated by Eq. (5).
 (5)
(5)
where  and
and  are the power and operating rate of the k-th facility in the process Pi respectively.
3.4 Online estimation of product output of periodic process
The electrolytic refinery process is a typical periodic process in the double flash production system. One of the technical difficulties encountered in the online energy analysis of the process is that the estimation of its product output is too much lagged in time, which is generally made every electrolytic period (210-240 h). So a timely evaluation and correction method is proposed for this periodic process in order to meet the data requirement of the online energy analysis.
Known by the mechanism of the electrolysis process, the generation rate of the cathode copper can be calculated by Eq. (6).
 (6)
(6)
where α is the generation rate of the cathode copper, t/h; η is the current efficiency of the electrolytic cell; k is the copper electrochemical equivalent, 1.185×10⁻⁶ t/(A・h); I is the current intensity, A; And N is the number of the electrolytic cells.
Among the four parameters in Eq. (6), k and N are constants, and I can be measured in real time. In normal situations, η ranges in a small range, which can be set according to historical data or with experience. Once obtaining the generation rate of the cathode copper by Eq. (6), the product output of the cathode copper can be calculated for different statistical periods. However, the calculated value is suggested to be compared with the actual production data, and the current efficiency then needs to be revised in order to improve the evaluation accuracy.
4 Results and discussion
The online energy analysis of the double flash system is performed from three levels. As the energy analysis has been reported a lot at the equipment and process level, here it gives only examples to demonstrate the online analysis of energy consumption of the whole production system.
4.1 Energy consumption of production system
There are a good variety of energy media involved in the copper production of Jinguan Copper. Some of the media like the electricity, natural gas, diesel and water, are the energy sources that need to pay. Others such as the steam, oxygen, nitrogen, and compressed air are self-produced sources and are generally not included in the cost of production of the enterprise. So in calculation of the energy consumption of the system, only outsourced energy media are included, and the consumption is converted into the standard coal to calculate the proportion of each medium. As illustrated in Figure 3, the electricity is the most consumed energy source in the system, which accounts for 77.3%. It is then followed by the natural gas and the diesel, accounting for 12.2% and 10.2% respectively in the total energy consumption of the system.

Figure 3 Consumption of different energy media consumed by the production system
For the energy analysis of each process unit, since the steam, oxygen, nitrogen and compressed air are no longer the self-produced sources in the unit, it must be included in the energy consumption by converting all the consumed energy media into the equivalent standard coal. As found in Figure 4, the highest energy consumption takes place in the smelting process unit, accounting for 52.8% of the total energy consumption of the system. This is because the smelting unit has the main processes such as the flash smelting (FS), the flash converting (FC), and the anode refining. All these pyro- metallurgical processes consume a large amount of electricity, natural gas, oxygen and steam. This is followed by the public utility unit and the electrolysis unit. The public utility unit is responsible for suppling the self-produced energy to other units, and it consumes nearly a quarter of the total energy in the system. In addition, the sulfuric acid unit and the mineral processing unit consume relatively less energy, accounting for only 8.4% and 4.3% in the total amount of energy consumed in the system.
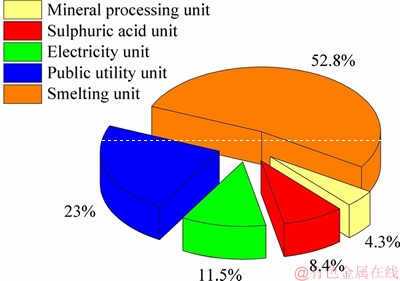
Figure 4 Energy consumption in different process units
4.2 Flow of steam
The steam is a self-produced energy source, however, the steam used in the production system is at three different pressure levels: the low-pressure (0-0.6 MPa), the medium-pressure (0.6-2.5 MPa) and the high-pressure (2.5-6 MPa). Aiming to make a more efficient utilization of the stream at different pressure levels, a steam flow chart through the system was included in the online energy analysis, as shown in Figure 5.
From the perspective of the whole production system, the steam mainly comes from the waste heat boilers, and is consumed by the drying process, the power generation and the flash smelting and converting processes.
Specifically, the high-pressure steam of 5.5 MPa is produced by the waste heat boilers of the flash smelting furnace (FSF) and the flash converting furnace (FCF). It is then used to generate electricity, discharging the steam of 2.2 MPa which enters the medium-pressure steam pipe network. In parallel, the medium-pressure steam of 2 MPa produced by the waste heat boiler in the sulfuric acid unit enters the medium-pressure pipe network as well. These medium-pressure steam streams are then mainly consumed in processes, such as the steam drying, the flash smelting, the flash converting, the circulating water system and the oxygen production. The low-pressure steam of 0.6 MPa is produced by the waste heat boiler in the sulfuric acid unit. It enters the low-pressure pipe network, and is mainly used in the electrolysis, the deaeration water supply and the waste heat power generation. The auxiliary boiler is responsible for supplying insufficient steam to the smelting process or others.
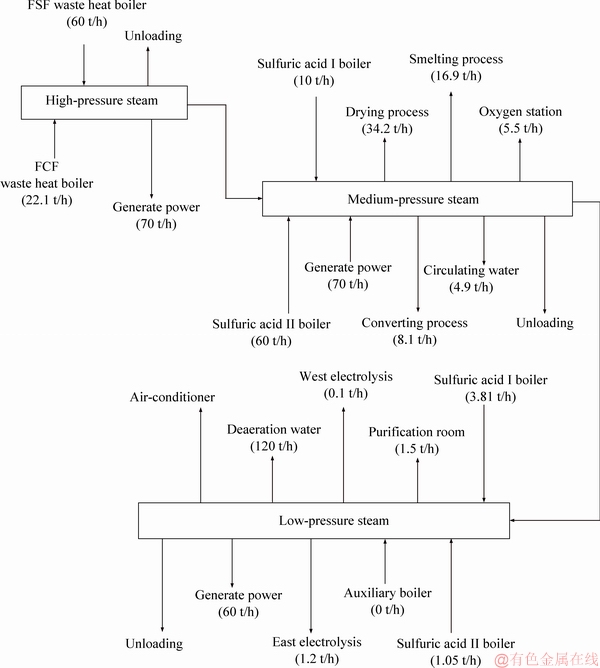
Figure 5 Flow of steam in the production system
4.3 Energy consumption of three main process units
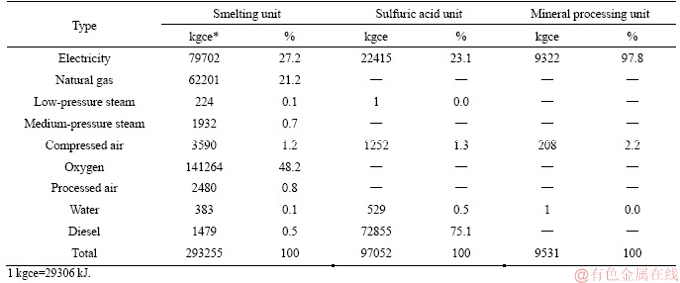
The three major process units are the smelting unit, the sulfuric acid unit and the mineral processing unit. An example of the daily energy consumption of the three units is listed in Table 1.
The smelting unit has the highest energy consumption in the enterprise. The energy media involved in this unit are electricity, natural gas and oxygen. This is because the smelting unit has the main processes of the copper pyro-extraction, it requires a large amount of oxygen. In addition, the excess oxygen over supplied to the processes is usually directly discharged. This causes a kind of waste of the oxygen and to some extent results in a high value of the energy consumption of these processes. In contrast, the sulfuric acid system and the mineral processing system are auxiliary processes, so their energy consumption is relatively low.
Table 1 Example of daily energy consumption of three major units
5 Conclusions
Due to the complexity of the system and the diversity of energy media involved in the system, it is difficult to perform an online analysis of the energy consumption and efficiency for large enterprise, especially for the non-ferrous enterprise. Work has been carried out first in Jinguan Copper, to perform an online analysis of the energy consumption and efficiency from the system, process and equipment levels respectively. The main work and conclusions are summarized as follows.
1) Based on the characteristics of the production processes, the whole double flash production system is divided into six process units according to the functional partitioning. A multi-level energy analysis method was proposed to make a comprehensive analysis of the energy consumption and efficiency from the system level, the process level and the equipment level respectively.
2) In order to tackle the technical difficulties for the online energy analysis of the double flash production system, methods were also proposed for problems such as the online acquisition and processing of data with different sampling frequencies, the online evaluation of the unit electricity consumption, and the timely evaluation of the product output for the periodic process. The solutions to these problems are of great help for the implementation of the online energy analysis.
3) A software system was developed and put into practice for the multi-level assessment of the energy consumption and efficiency in the copper double flash enterprise. As a demonstration, the flow of the steam and the energy consumption at the system level were analyzed. The results show that electricity is the most consumed energy in the system, accounting for 77.3% of the total energy consumption. And the smelting unit has the highest energy consumption, accounting for 52.8% of the total energy consumed in the whole enterprise.
Acknowledgements
The authors are sincerely grateful to all the technical support from the Jinguan Copper Company, Tongling Non-ferrous Metal Group Co. Ltd.
References
[1] YANG Sheng, WANG Yi-fan, GAO Jun, ZHANG Zhi-en, LIU Zhi-qiang, OLABI A G. Performance analysis of a novel cascade absorption refrigeration for low-grade waste heat recovery [J]. ACS Sustainable Chemistry & Engineering, 2018, 6(7): 8350-8363. DOI: 10.1021/acssuschemeng. 8b00397.
[2] YANG Sheng, DENG Cheng-wei, LIU Zhi-qiang. Optimal design and analysis of a cascade LiBr/H2O absorption refrigeration/transcritical CO2 process for low-grade waste heat recovery [J]. Energy Conversion and Management, 2019, 192: 232-242. DOI: 10.1016/j.enconman.2019.04.045.
[3] LI Yu-qiang, TANG Wei, CHEN Yong, LIU Jiang-wei, LEE C F F. Potential of acetone-butanol-ethanol (ABE) as a biofuel [J]. Fuel, 2019, 242: 673-686. DOI: 10.1016/ j.fuel.2019.01.063.
[4] KABIR E, KUMAR P, KUMAR S, ADELODUN A A, KIM K H. Solar energy: Potential and future prospects[J]. Renewable and Sustainable Energy Reviews, 2018, 82: 894-900. DOI: 10.1016/j.rser. 2017.09.094.
[5] KONG Xiang-fei, LU Shi-lei, XIN Ya-juan, WU Wei. Energy consumption, indoor environmental quality, and benchmark for office buildings in Hainan Province of China [J]. Journal of Central South University, 2012, 19(3): 783-790. DOI: 10.1007/s11771-012-1072-8.
[6] YANG Yu-lan, TAI Hui-xin, SHI Tao. Weighting indicators of building energy efficiency assessment taking account of experts’ priority [J]. Journal of Central South University, 2012, 19(3): 803-808. DOI: 10.1007/s11771-012-1075-5.
[7] LEE W L, YIK F W H, JONES P. A strategy for prioritising interactive measures for enhancing energy efficiency of air-conditioned buildings [J]. Energy, 2003, 28(8):877-893. DOI: 10.1016/S0360-5442(03)00005-7.
[8] ZHOU Xuan, LIAN Si-zhen, YAN Jun-wei, KANG Ying-zi. Energy performance assessment on central air-conditioning system of commercial building: A case study in China [J]. Journal of Central South University, 2015, 22(8): 3168-3179. DOI: 10.1007/s11771-015-2854-6.
[9] FAN Yun-qing, HAYASHI T, ITO K. Coupled simulation of BES-CFD and performance assessment of energy recovery ventilation system for office model [J]. Journal of Central South University, 2012, 19(3): 633-638. DOI: 10.1007/ s11771-012-1049-7.
[10] HASAN M Z, FINK R, SUYAMBU M R. Assessment and improvement of elevator controllers for energy efficiency [C]// 2012 IEEE 16th International Symposium on Consumer Electronics. USA: IEEE, 2012: 1-6. DOI: 10.1109/ ISCE.2012.6241747.
[11] SAIDEL M A, RAMOS M C E S, ALVES S S. Assessment and optimization of induction electric motors aiming energy efficiency in industrial applications [C]// The XIX International Conference on Electrical Machines. Rome: IEEE, 2010: 1-6. DOI: 10.1109/ICELMACH.2010.5608033.
[12] SOUSA SANTOS V S, CABELLO ERAS J J, SAGASTUME GUTIERREZ A, CABELLO ULLOA M J. Assessment of the energy efficiency estimation methods on induction motors considering real-time monitoring [J]. Measurement, 2019, 136: 237-247. DOI: 10.1016/j.measurement. 2018.12.080.
[13] VANZWIETEN J H, LAING W E, SLEZYCKI C R. Efficiency assessment of an experimental ocean current turbine generator [C]// IEEE Oceans Conference. USA: IEEE, 2011:1-6. DOI: 10.23919/OCEANS.2011.6107177.
[14] BALDI S, QUANG T L, HOLUB O, ENDEL P. Real-time monitoring energy efficiency and performance degradation of condensing boilers [J]. Energy Conversion and Management, 2017, 136: 329-339. DOI: 10.1016/j.enconman.2017.01.016.
[15] NAFEYA A S, FATHB H E S, MABROUKA A A. Thermo- economic investigation of multi effect evaporation (MEE) and hybrid multi effect evaporation multi-stage flash (MEE-MSF) systems [J]. Desalination, 2006, 201(1-3): 241-254. DOI: 10.1016/j.desal.2005.09.044.
[16] LONGO S, D’ANTONI B M, BONGARDS M. Monitoring and diagnosis of energy consumption in wastewater treatment plants. A state of the art and proposals for improvement [J]. Applied Energy, 2016, 179: 1251-1268. DOI: 10.1016/j.apenergy.2016.07.043.
[17] ZHOU Li-rong, LI Jian-feng, LI Fang-yi, MENG Qiang, LI Jing, XU Xing-shuo. Energy consumption model and energy efficiency of machine tools: a comprehensive literature review [J]. Journal of Cleaner Production, 2016, 112: 3721-3734. DOI: 10.1016/j.jclepro. 2015.05.093.
[18] TAN Y S, NG Y T, LOW J S C. Internet-of-things enabled real-time monitoring of energy efficiency on manufacturing shop floors [J]. Procedia CIRP, 2017, 61: 376-381. DOI: 10.1016/j.procir.2016.11.242.
[19] WANG Zhi-qi, LIU Li-wen, XIA Xian-xia, ZHOU Nai-jun. Dynamic test on waste heat recovery system with organic Rankine cycle [J]. Journal of Central South University, 2014, 21(12): 4607-4612. DOI: 10.1007/s11771-014-2467-5.
[20] SUN Wen-qiang, YUE Xiao-yu, WANG Yan-hui, CAI Jiu-ju. Energy and exergy recovery from exhaust hot water using organic Rankine cycle and a retrofitted configuration [J]. Journal of Central South University, 2018, 25(6): 1464-1474. DOI: 10.1007/s11771-018-3840-6.
[21] ARAUJO A, BRITO R, VASCONCELOS L. Exergetic analysis of distillation processes: A case study [J]. Energy, 2007, 32(7): 1185-1193. DOI: 10.1016/j.energy.2006.07. 003.
[22] YARI M. Exergetic analysis of various types of geothermal power plants [J]. Renewable Energy, 2010, 35(1): 112-121. DOI: 10.1016/j.renene.2009.07.023.
[23] KELLY S, TSATSARONIS G, MOROSUK T. Advanced exergetic analysis: Approaches for splitting the exergy destruction into endogenous and exogenous parts [J]. Energy, 2009, 34(3): 384-391. DOI: 10.1016/j.energy.2008.12.007.
[24] SINGH N, KAUSHIK S C, MISRA R D. Exergetic analysis of a solar thermal power system [J]. Renewable Energy, 2000, 19(1, 2): 135-143. DOI: 10.1016/S0960-1481(99)00027-0.
[25] MA Wei-wu, XUE Xin-pei, LIU Gang. Techno-economic evaluation for hybrid renewable energy system: Application and merits [J]. Energy, 2018, 159: 385-409. DOI: 10.1016/j.energy.2018.06.101.
[26] LIU Gang, LI Meng-si, ZHOU Bing-jie, CHEN Ying-ying, LIAO Sheng-ming. General indicator for techno-economic assessment of renewable energy resources [J]. Energy Conversion and Management, 2018, 156: 416-426. DOI: 10.1016/j.enconman.2017.11.054.
[27] JIANG Ai-hua, MEI Zhi, SHI Zhang-ming, YU Huang, JIANG Xin-jie, ZHU Xiao-jun. Energy and exergy analysis of the blast furnace in SKS lead smelting system [J]. Journal of Hunan University Natural Sciences, 2011, 38(6): 38-42. http://www.cnki.com.cn/Article/CJFDTotal-HNDX201106008.htm/. (in Chinese)
[28] GE Shi-heng. Energy consumption analysis and energy saving research for alumina manufacturing process [D]. Changsha: School of Energy Science and Engineering, Central South University, 2010. DOI: 10.7666/d.y1721090. (in Chinese)
[29] ANDERSEN J P, HYMAN B. Energy and material flow models for the US steel industry [J]. Energy, 2001, 26(2): 137-159. DOI: 10.1016/S0360-5442(00)00053-0.
[30] NAJDENOV I, RAIC K T, KOKEZA G. Aspects of energy reduction by autogenous copper production in the copper smelting plant Bor [J]. Energy, 2012, 43(1): 376-384. DOI: 10.1016/j.energy.2012.04.007.
[31] HE Hui-min. A study of systematic energy saving based energy consumption analysis for copper smelting processes [D]. Changsha: School of Energy Science and Engineering, Central South University, 2014. http://cdmd.cnki.com.cn/ article/cdmd-10533-1014410087.htm/. (in Chinese)
[32] SIITONEN S, TUOMAALA M, AHTILA P. Variables affecting energy efficiency and CO2 emissions in the steel industry [J]. Energy Policy, 2010, 38(5): 2477-2485. DOI: 10.1016/j.enpol.2009.12.042.
[33] LIU Wen-chao. Analysis of energy flow and its modeling in integrated steelworks [C]// Proceedings of the 2009 International Conference on Energy and Environment Technology. China: IEEE Computer Society, 2009: 33-39. DOI: 10.1109/ICEET.2009.15.
[34] LIU Xiao-jun, LIAO Sheng-ming, RAO Zheng-hua, LIU Gang. A process-level hierarchical structural decomposition analysis (SDA) of energy consumption in an integrated steel plant [J]. Journal of Central South University, 2017, 24(2): 402-412. DOI: 10.1007/s11771-017-3442-8.
[35] GAO Jing-mei, WANG Lin-kun. Study on multi-stage energy efficiency evaluation method of typical petrochemical industry [J]. Instrument Standardization & Metrology, 2013(5): 18-19. DOI: 10.3969/j.issn.1672-5611.2013.05.004. (in Chinese)
[36] CHAI Man-lin, SONG Yan-po, CHEN Zhuo. Multi-layer and multi-sacle online energy efficiency analysis method for copper flash smelting enterprises [J]. Copper Engineering, 2015(4): 52-57. DOI: 10.3969/j.issn.1009-3842.2015. 04.015. (in Chinese)
(Edited by ZHENG Yu-tong)
中文导读
闪速炼铜工艺的能效在线监测与分析
摘要:铜闪速熔冶炼工艺的特点是能源介质种类多、系统能耗高。因此,节能是闪速炼铜企业高度关注的主题之一。然而,由于系统的复杂性,要实现对生产系统的能耗进行综合分析具有一定难度。为此,关于“闪速炼铜企业系统能耗在线监测与分析”的研究工作率先在铜陵有色金属集团有限公司金冠铜业展开。解决了能耗在线分析工作中存在的诸如不同采样频率数据采集和处理问题、过程用电量在线测算、周期性过程产品产量估测等技术难题,并在此基础上完成了系统软件开发,实现了从系统到设备的三个级别分别对全厂能源消耗与用能效率的在线监测与分析。系统投入实际运行后的结果表明:电力是双闪企业生产系统中消耗最多的能源介质,其用量占总能源消耗量的77.3%;生产系统中,冶炼单元能耗最高,占整个企业总能耗的52.8%。
关键词:能耗;能效;在线分析;闪速炼铜
Foundation item: Project(1301021018) supported by Science and Technology Research Project of Anhui Province, China
Received date: 2019-06-19; Accepted date: 2019-07-22
Corresponding author: SONG Yan-po, PhD, Associate Professor; Tel: +86-13873117679; E-mail: songyanpo@csu.edu.cn; ORCID: 0000-0003-0246-8566

