J. Cent. South Univ. Technol. (2010) 17: 1351-1356
DOI: 10.1007/s11771-010-0641-y
Engineering behaviors of reinforced gabion retaining wall based on laboratory test
LIN Yu-liang(林宇亮), YANG Guo-lin(杨果林), LI Yun(李昀), ZHAO Lian-heng(赵炼恒)
School of Civil and Architectural Engineering, Central South University, Changsha 410075, China
? Central South University Press and Springer-Verlag Berlin Heidelberg 2010
Abstract: In order to study the engineering behaviors of reinforced gabion retaining wall, laboratory model test was carried out. Cyclic load and unload of five levels (0-50, 0-100, 0-50, 0-200 and 0-250 kPa) were imposed. Vertical earth pressure, lateral earth pressure, deformation behaviors of reinforcements, potential failure surface and deformation behaviors of wall face were studied. Results show that vertical earth pressure is less than theoretical value, the ratio of vertical earth pressure to theoretical value increases nearly linearly with increasing load, and the correlation coefficient of regression equation is 0.92 for the second layer and 0.79 for the fifth layer. The distribution of lateral earth pressure along the wall back is nonlinear and it is less than theoretical value especially when the load imposed at the top of retaining wall is large. Therefore, reinforced gabion retaining wall will be in great safety when current method is adopted. The deformation behaviors of reinforcements both in the third layer and the fifth layer are single- peak distributions, and the position of the maximum strain is behind that determined by 0.3H (Here H refers to the height of retaining wall) method or Rankine theory. Lateral deformation of wall face increases with increasing load, and the largest lateral deformation occurs in the fourth layer, which lead to a bulging in the middle of wall face.
Key words: reinforced gabion; earth pressure; deformation; laboratory test
1 Introduction
Soil is of a certain compressive strength and low tensile strength, when incorporated with appropriate reinforcements, and its strength and deformation behavior can be greatly improved. Therefore, reinforced soil technology was widely used by engineers, and new theories for reinforced soil structure analysis were put forward continuously [1-4]. QUANG et al [5] proposed a multiphase model for the simulation and the design of reinforced soil retaining structures. This model was able to account for a specific failure condition at the interface between the soil and the reinforcing strips. Upper bound estimation method [6], neural networks [7], and numerical solution [8-9] were adopted by many researchers. Meanwhile, test researches on reinforcements and reinforced soil structures [10-11], especially for the dynamic or seismic response of reinforced soil structures were widely carried out in recent years [12-13]. However, for the limitation of the above methods or the theory itself, the design of reinforced soil structure was still based on semi-theoretical and semi-empirical method.
At present, reinforced gabion retaining wall, as a new reinforced soil structure in China, was constructed in west line of Xiangtan to Hengyang highway in Hunan Province, China. And mechanical behaviors would be more complicated because the wall face was constructed by filling gabion cages with hard stones. Till now, few scholars have researched reinforced gabion retaining wall, and most of them just focused on interaction mechanism between reinforcements and backfill [14-15]. Consequently, correlative researches were urgent to make clear whether this new structure could work safely under traffic load, or the traditional calculation method could be used for structures calculation or not.
Therefore, laboratory test on engineering behaviors of reinforced gabion retaining wall was carried out. At the top of retaining wall, five load levels were imposed to simulate traffic load, and cyclic load and unload were imposed to simulate the function of vehicle’s running back and forth. The distributions of vertical and lateral earth pressure, the strain of reinforcements, and deformation behavior of wall face were studied and analyzed. By comparing vertical and lateral earth pressure with theoretical values, the maximum strain of reinforcement with rupture strain by air tensile test, potential failure surface with that determined by 0.3H (Here H refers to the height of retaining wall) method or Rankine method, it could be concluded that reinforced gabion retaining wall had enough safety reserve under test load.
2 Experimental
Reinforced gabion component, which was galvanized and covered by PVC for anti-corrosion, was of double-twisted hexagonal wire mesh shape. The mesh type was 8 cm×10 cm, as shown in Fig.1. The diameter of mesh wire was 2.7 mm, and 3.4 mm at the edge of component. According to air tensile test of gabion mesh, the main mechanical indexes are shown in Table 1[16]. Reinforced gabion retaining wall and instruments layout in the test are shown in Fig.2.

Fig.1 Reinforced gabion component (Unit: cm)
Table 1 Air tensile test results of gabion mesh (2.7 mm)

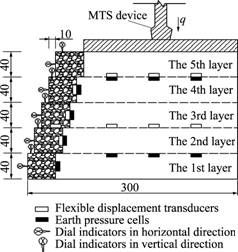
Fig.2 Reinforced gabion retaining wall and instruments layout (Unit: cm)
Model test box was made. The dimension of the box was 3.0 m×0.86 m×2.0 m (length×width×height). One face (3.0 m×2.0 m) was made by organic glass for observation, and two free faces: a free face (3.0 m× 0.85 m) at the top of box for imposing load, the other free face (0.85 m×2.0 m) at the fore-end for the construction of wall face. The other three faces were welded by steel plate. Reinforced gabion retaining wall was filled by red sandstone with the compactness of 95%, which was carried from construction site. For the characteristics of low strength, water softening and dehydration crack, red sandstone is usually considered to be ill roadbed fill. The main physical and mechanical characteristics of red sandstone are shown in Table 2. Gabion cages were filled with hard stones of stable physical property, and the filling ratio reached 70% as required in construction site, and the diameters of stones were in the range from 100 to 200 mm. Along the inner side of the gabion cage, geotextiles were laid to prevent the leakage of backfills. There were five layers in total, and each layer was 0.4 m in height. Reinforced gabion components of adjacent layers were connected firmly.
Table 2 Main mechanical indexes of red sandstone

MTS device was used for imposing load. During the test, cyclic load and unload of five levels were imposed (0-50, 0-100, 0-50, 0-200 and 0-250 kPa), and three cycles for each level, fifteen cycles in all.
3 Test results and analysis
3.1 Vertical earth pressure
The distributions of vertical earth pressure along the reinforcements are shown in Fig.3. Vertical earth pressure distributes nearly uniformly both in the fifth layer and the second layer. Vertical earth pressure is less than theoretical value calculated by the formula of σv=γh (here γ refers to the bulk density of soil, and h refers to the height of soil). The main reasons can be concluded as follows: firstly, the backfill is reinforced completely and there is no lateral pressure caused by non-reinforced backfill, and then vertical earth pressure tends to uniform distribution. Secondly, flexible gabion meshes are buried in soil, which would result in membrane or tuck net effect [17], and then vertical earth pressure decreases. Lastly, theoretical calculation of vertical earth pressure is based on the theory of semi-infinite foundation, and it cannot be completely applicable for reinforced gabion retaining wall of a certain width, which allows a certain deformation in lateral direction. At present, uniform distribution is widely adopted for calculation.
Define n as the ratio of average vertical earth pressure to theoretical value. The relationships between n and load q of the second layer and the fifth layer are shown in Fig.4. It can be seen that n increases nearly linearly with increasing load q. The correlation coefficient of regression equation is 0.92 for the second layer, and 0.79 for the fifth layer.
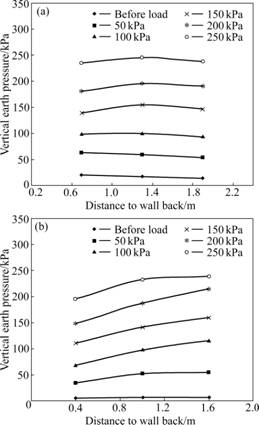
Fig.3 Distributions of vertical earth pressure under different loads in the second layer (a) and the fifth layer (b)
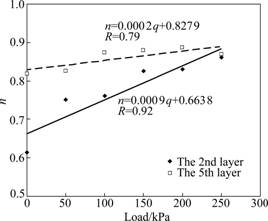
Fig.4 Comparison of average vertical earth pressure with theoretical value under different loads
3.2 Lateral earth pressure
Varying coefficients method is taken in highway and 0.3H method is adopted in railway for lateral earth pressure calculation in China. Comparison of theoretical lateral earth pressure (without considering cohesion of backfill) with test data is shown in Fig.5. The imposed load can be converted as a certain thickness of the backfill when calculating.
Lateral earth pressure is close to theoretical value before loading. When loading, it does not increase theoretically. Because of the interface friction between reinforcement and soil, lateral earth pressure is partly balanced by tension of reinforcement. And therefore, it is not correct to calculate lateral earth pressure by traditional method. In terms of the design of reinforced retaining wall, the main purpose of determining earth pressure is for reinforcement tension calculation, which is different from gravity retaining wall. In addition, for the flexible structure of reinforced gabion retaining wall, the displacement of wall face is another reason why lateral earth pressure is smaller.
The distribution of lateral earth pressure along wall back is in non-linear form, different from the linear form under the assumption of Rankin or Coulomb theory. The wall face of reinforced gabion retaining wall is flexible without enough stiffness, and lateral displacement is mainly restricted by reinforcements, which makes lateral earth pressure quite complex. The position of the maximum lateral earth pressure in the test is in the second layer of retaining wall.
Test results show that lateral earth pressure is not significantly affected by vertical load. It is a great difference between reinforced soil retaining wall and gravity retaining wall. On the one hand, vertical earth pressure on reinforcement increases with increasing load, which leads to stronger interaction between reinforcement and backfill, and therefore, lateral earth pressure does not increase greatly. On the other hand, lateral displacement of wall face slows down the growth rate of lateral earth pressure.
When the load is big, lateral earth pressures calculated by different methods show great difference, and all of them are much bigger than test values. Therefore, it can be referred that current methods are not suitable for lateral earth pressure calculation if reinforced gabion retaining wall is very high. But current methods make lateral earth pressure much bigger and reinforced gabion structure will be in great safety.
3.3 Deformation of reinforcements
Reinforcement can limit the movement of soil because of its friction assistance. Consequently, soil strength and stability of reinforced soil structures are greatly enhanced. Reinforcement tension is mainly caused by lateral displacement of wall face. If the tension reaches a certain value, reinforcement may rapture, or cannot provide sufficient pull-out resistance and sliding failure may occur. Therefore, reinforcement tension is an important part for the discussion of mechanical properties of reinforced soil structure.

Fig.5 Comparison between test data of lateral earth pressure and theoretical values: (a) Before load; (b) 0-50 kPa (q=50 kPa); (c) 0- 100 kPa (q=100 kPa); (d) 0-150 kPa (q=150 kPa); (e) 0-200 kPa (q=200 kPa); (f) 0-250 kPa (q=250 kPa)
Fig.6 shows the deformation behaviors of reinforcements in the third layer and the fifth layer. The strains of reinforcements show single-peak distributions both in the third layer and the fifth layer. And distribution curves keep in similar shapes under different vertical loads. With the increase of load, the strain increases, but the increasing amplitude decreases. The maximum strain appears in the middle of reinforcement, which is about 1.0 m (0.5H) from wall back, greater than 0.3H in design. This is mainly due to the long reinforcement which results in larger active area and stable area. In many cases, double-peak distribution of strain along reinforcement may exist: one peak value in sliding area (or active area), and the other in stable area, and they can keep tension balance of reinforcements. Meanwhile, the peak value in stable area can partly resist lateral earth pressure. Single-peak distribution can be regarded as a special case of the double-peak distribution.

Fig.6 Strain distributions of reinforcement under different loads in the third layer (a) and the fifth layer (b)
Test results show that the strain of reinforcement in the gabion cage (in the third layer, as shown in Fig.2 and Fig.6(a)) is negative (compression). This is mainly due to the outward displacement of interior wall which is caused by lateral earth pressure.
The maximum strains of reinforcements in the third layer and the fifth layer under the maximum load q= 250 kPa are about 0.78% and 0.90%, respectively. Air tensile test of gabion mesh shows that the strain under maximum load can reach 22.1%. Converting the strain of reinforcement into tension, the maximum reinforcement tension is about 4% of its ultimate tensile strength. Therefore, reinforced gabion retaining wall has enough safety reserve.
Fig.7 shows the vertical deformation behaviors of reinforcement in the interior wall with increasing load. Tensile strains (positive value) appear and increase with increasing load, first quickly and then gently, until compressive strain (negative value) occurs in the second layer. Outward overturning deformation occurs with the bottom of wall face as basic point when loading, which leads to tensile strain in interior wall and compressive strain in exterior wall. With increasing load, the settlement of wall face increases, and then tensile strain turns to small and disappears, until compressive strain appears.
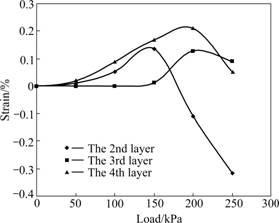
Fig.7 Vertical deformation of reinforcements in interior wall with increasing load
The potential failure surface of reinforced soil retaining wall can be determined approximately by the position of maximum tension of reinforcements. Fig.8 shows the position of the maximum tension of reinforcements and potential failure surface determined by Rankine theory and 0.3H method. It can be seen that, whether Rankine theory or 0.3H method is used, the calculated failure surface cannot coincide with test data well, and the experimental potential surface is behind the theoretical position obviously. On the one hand, it is due to the long enough reinforcement; on the other hand, it is due to the special structure of reinforced gabion retaining wall. Further study needs to be carried out on potential failure surface of reinforced gabion retaining wall.
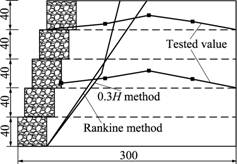
Fig.8 Comparison between test results and theoretical failure surface (Unit: cm)
3.4 Deformation of wall face
Wall face is mainly used to fix reinforcements, prevent the loosening of soil among reinforcements, bear lateral earth pressure and maintain the shape and appearance of retaining wall. Fig.9 shows lateral deformation of wall face under different loads. Lateral deformation increases with increasing load. The maximum lateral deformation occurs in the fourth layer, and wall face shows a bulging in the middle. It can be seen that negative value of lateral deformation (backward displacement) appears under load of 0-50 kPa. This is mainly because the backfill is not compacted adequately, and compaction settlement occurs when loading, which leads to vertical displacement of reinforcements which are connected with wall face. Consequently, the wall face is pulled backward by reinforcements.
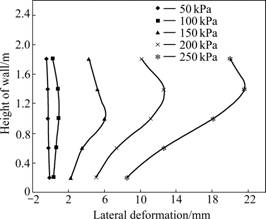
Fig.9 Lateral deformation of wall face under each load level
Define accumulative deformation ratio as the accumulative lateral deformation of wall face to the height of retaining wall (H=2 m). The maximum lateral deformation ratio of reinforced gabion retaining wall is just about 1.1% under test load, which could meet engineering requirements.
4 Conclusions
(1) Vertical earth pressure distributes along reinforcement nearly uniformly and is less than theoretical value. The ratio of vertical earth pressure to theoretical value increases linearly with increasing load. Lateral earth pressure shows a non-linear distribution along wall back. Lateral earth pressure is less than theoretical value especially when the imposed load is big.
(2) The strain of reinforcement is single-peak distribution, and the position of the maximum strain is behind that determined by Rankine theory and 0.3H method. The largest lateral deformation of wall face occurs in the fourth layer.
(3) Reinforced gabion retaining wall can work safely under test load. As for a new structure, mechanical and deformation behaviors need to be further studied to widely apply this structure in practical engineering.
References
[1] LESHCHINSKY D, HU Y, HAN J. Limited reinforced space in segmental retaining walls [J]. Geotextiles and Geomembranes, 2004, 22(6): 543-553.
[2] ZHANG Ling, ZHAO Ming-hua, HE Wei. Working mechanism of two-direction reinforced composite foundation [J]. Journal of Central South University of Technology, 2007, 14(4): 589-594.
[3] BILGIN O. Failure mechanisms governing reinforcement length of geogrid reinforced soil retaining walls [J]. Engineering Structures, 2009, 31(9): 1967-1975.
[4] ZHANG Ling, ZHAO Ming-hua, ZOU Xiao-Wei, ZHAO Heng. Deformation analysis of geocell reinforcement using Winkler model [J]. Computers and Geotechnics, 2009, 36(6): 977-983.
[5] QUANG T S, GHAZI H, PATRICK B. A multiphase approach to the stability analysis of reinforced earth structures accounting for a soil-strip failure condition [J]. Computers and Geotechnics, 2009, 36(3): 454-462.
[6] PORBAHA A, ZHAO A, KOBAYASHI M, KISHIDA T. Upper bound estimate of scaled reinforced soil retaining walls [J]. Geotextiles and Geomembranes, 2000, 18(6): 403-413.
[7] HE S, LI J. Modeling nonlinear elastic behavior of reinforced soil using artificial neural networks [J]. Applied Soft Computing, 2009, 9(3): 954-961.
[8] CAI Z, BATHURST R J. Seismic response analysis of geosynthetic reinforced soil segmental retaining walls by finite element method [J]. Computers and Geotechnics, 1995, 17(4): 523-546.
[9] HATTAMLEH O A, MUHUNTHAN B. Numerical procedures for deformation calculations in the reinforced soil walls [J]. Geotextiles and Geomembranes, 2006, 24(1): 52-57.
[10] ZHANG M X, ZHOU H, JAVADI A A, WANG Z W. Experimental and theoretical investigation of strength of soil reinforced with multi-layer horizontal-vertical orthogonal elements [J]. Geotextiles and Geomembranes, 2008, 26(1): 1-13.
[11] VISWANADHAM B V S, KONIG D. Centrifuge modeling of geotextile-reinforced slopes subjected to differential settlements [J]. Geotextiles and Geomembranes, 2009, 27(2): 77-88.
[12] SABERMAHANI M, GHALANDARZADEH A, FAKHER A. Experimental study on seismic deformation modes of reinforced-soil walls [J]. Geotextiles and Geomembranes, 2009, 27(2): 121-136.
[13] LATHA G M, KRISHNA A M. Seismic response of reinforced soil retaining wall models: Influence of backfill relative density [J]. Geotextiles and Geomembranes, 2008, 26(4): 335-349.
[14] BERGADO D T, YOUWAI S, TEERAWATTANASUK C, VISUDMEDANUKUL P. The interaction mechanism and behavior of hexagonal wire mesh reinforced embankment with silty sand backfill on soft clay [J]. Computers and Geotechnics, 2003, 30(6): 517-534.
[15] BERGADO D T, VOOTTIPRUEX P, SRIKONGSRI A, VOOTTIPRUEX P. Interaction between hexagonal wire mesh reinforcement and silty sand backfill [J]. Geotechnical Testing Journal, 2001, 24(1): 26-41.
[16] LIN Yu-liang, YANG Guo-lin, LI Yun, HUANG Xiang-jing. Test study on dynamic deformation behavior of reinforced gabion retaining wall under cyclic load [J]. Chinese Journal of Rock Mechanics and Engineering, 2009, 28(s2): 4027-4033. (in Chinese)
[17] YANG Guang-qing, L? Peng, PANG Wei, ZHAO Yu. Research on geogrid reinforced soil retaining wall with wrapped face by in-situ tests [J]. Rock and Soil Mechanics, 2008, 29(2): 517-522. (in Chinese)
(Edited by YANG You-ping)
Foundation item: Project(50778180) supported by the National Natural Science Foundation of China; Project(CX2010B049) supported by Hunan Provincial Innovation Foundation for Postgraduate, China
Received date: 2009-12-17; Accepted date: 2010-03-05
Corresponding author: LIN Yu-liang, PhD; Tel: +86-731-82659897; E-mail: linyuliang11@yahoo.com.cn

