采用M-K模型和Lou-Huh准则对AA7075-T6板材成形极限预测的对比研究
来源期刊:中国有色金属学报(英文版)2020年第6期
论文作者:董国疆 陈志伟 杨卓云 樊博成
文章页码:1463 - 1477
关键词:韧性断裂准则;M-K模型;成形极限图;AA7075-T6板材
Key words:ductile fracture criterion; M-K model; forming limit diagram; AA7075-T6 sheet
摘 要:为了能够有效预测AA7075-T6高强铝板的破裂,依据Morciniak-Kuczyski模型(M-K模型)与Lou-Huh准则分别绘制AA7075-T6高强铝板成形极限曲线,通过缺口试样误差评估比较两种理论预测模型预测值与试验值之间的相对误差,并通过半球形刚模胀形试验对两种理论预测模型绘制的成形极限曲线进行验证,以此评价M-K模型与Lou-Huh准则的预测精度。由误差分析可知,采用最优断裂参数的Lou-Huh准则对各拉伸试样的误差均值为25.04%,而M-K模型对各拉伸试样的误差均值达到74.24%,Lou-Huh准则对AA7075-T6板材的破裂预测精度较高。半球形刚模胀形试验验证结果表明,用Lou-Huh准则绘制的成形极限曲线能够有效预测AA7075-T6板材的破裂,而M-K模型构建的成形极限曲线预测结果较差。
Abstract: In order to effectively predict the fracture of AA7075-T6 sheet, the forming limit curves of AA7075-T6 high-strength sheet were drawn according to Morciniak-Kuczyski (M-K) model and Lou-Huh criterion, respectively. The errors between the predicted values of the two theoretical prediction models and experimental values were calculated by error analysis. The forming limit curves were verified by the punch-stretch test to evaluate the prediction accuracy of M-K model and Lou-Huh criterion. The error analysis results show that the mean error of Lou-Huh criterion with the optimal parameters for all tensile specimens is 25.04%, while the mean error of M-K model for all tensile specimens is 74.24%. The prediction accuracy of Lou-Huh criterion in predicting the fracture of AA7075-T6 sheet is higher. The punch-stretch test results show that the forming limit curve drawn by Lou-Huh criterion can effectively predict the fracture of AA7075-T6 sheet, but the prediction accuracy of M-K model is relatively poor.
Trans. Nonferrous Met. Soc. China 30(2020) 1463-1477
Guo-jiang DONG1, Zhi-wei CHEN2, Zhuo-yun YANG2, Bo-cheng FAN1
1. Hebei Key Laboratory of Special Delivery Equipment, Yanshan University, Qinhuangdao 066004, China;
2. Key Laboratory of Advanced Forging & Stamping Technology and Science of Ministry of Education of China, Yanshan University, Qinhuangdao 066004, China
Received 14 November 2019; accepted 15 April 2020
Abstract: In order to effectively predict the fracture of AA7075-T6 sheet, the forming limit curves of AA7075-T6 high-strength sheet were drawn according to Morciniak-Kuczyski (M-K) model and Lou-Huh criterion, respectively. The errors between the predicted values of the two theoretical prediction models and experimental values were calculated by error analysis. The forming limit curves were verified by the punch-stretch test to evaluate the prediction accuracy of M-K model and Lou-Huh criterion. The error analysis results show that the mean error of Lou-Huh criterion with the optimal parameters for all tensile specimens is 25.04%, while the mean error of M-K model for all tensile specimens is 74.24%. The prediction accuracy of Lou-Huh criterion in predicting the fracture of AA7075-T6 sheet is higher. The punch-stretch test results show that the forming limit curve drawn by Lou-Huh criterion can effectively predict the fracture of AA7075-T6 sheet, but the prediction accuracy of M-K model is relatively poor.
Key words: ductile fracture criterion; M-K model; forming limit diagram; AA7075-T6 sheet
1 Introduction
In the modern automobile manufacture field, in order to decrease automotive body weight and keep sufficient strength, high strength aluminum alloy sheets are applied to making auto structural parts [1,2]. However, high-strength aluminum alloy sheets are easy to be broken during the forming process at room temperature. Therefore, it is significant to effectively predict the occurrence of fracture during the forming process of high-strength aluminum alloy sheets.
Forming limit diagram (FLD) can visually show the maximum deformation degree of metal sheet before fracture [3,4]. The theory of tensile instability is the earliest and still widely-used tool to analyze the forming limit of sheet metal. In 1952, SWIFT [5] and HILL [6] respectively proposed the diffuse necking model and the localized necking model. However, the diffuse necking model is only applicable to biaxial tension stress state under proportional loading condition [7]. The localized necking model has the imperfection that localized necking will not appear when sheet metal is under biaxial tensile strain condition, which is inconsistent with the actual conditions. In 1967, MORCINIAK and KUCZYSKI [8] presented a groove hypothesis, known as Morciniak-Kuczyski model (M-K model), which once became the most widely used theoretical forming limit prediction model. Many scholars have researched the forming limit of different materials according to M-K model, and the theoretical prediction results showed that most ductile materials can be effectively predicted by M-K model. Based on M-K model, MA et al [9] drew the FLD of 5A90 aluminum- lithium alloy sheet at different temperatures. The prediction accuracy of M-K model was well verified by comparing the theoretical forming limit curve with the experimental one. LI et al [10] plotted the theoretical forming limit curve (FLC) of 2B06 aluminum alloy sheet according to M-K model. The comparative result between theoretical FLC and experimental results of punch-sketch test showed that M-K model can effectively predict the forming limit of 2B06 aluminum alloy.
In recent years, the ductile fracture criterion has received extensive attention in the forming limit prediction of high-strength aluminum alloy sheet [11,12]. The fracture of metal material is related to the nucleation, growth and coalescence of microscopic voids inside the material. Based on this microscopic fracture mechanism, scholars such as COCKCROFT and LATHAM [13], RICE and TRACEY [14], OH et al [15], OYANE et al [16], CLIFT et al [17] and KO et al [18] have successively proposed ductile fracture criteria to predict the occurrence of fracture for metal material. However, these ductile fracture criteria established in early years can only predict the fracture problems in the high stress triaxiality range. Ductile fracture problems in low and negative stress triaxiality (-1/3<η<1/3) have not been comprehensively studied until a series of ductile fracture tests of sheet and round bar specimens for 2024-T351 aluminum alloy were conducted by BAO and WIERZBICKI [19]. Since then, the problem of ductile fracture in a wide range of the stress triaxiality has attracted increasing attention. LOU and HUH [20] newly developed a fracture criterion (hereinafter referred as Lou-Huh criterion), which can be applied to predicting ductile fracture within a large stress triaxiality range (-1/3≤η≤2/3). The analysis expression of Lou-Huh criterion is
 (1)
(1)
where C1, C2 and C3 are fracture parameters;  is fracture strain (namely the equivalent plastic strain at the onset of fracture); η is stress triaxiality, η=σm/σeq (σm is mean stress, and σeq is equivalent stress); L is Lode parameter (L=(2σ2-σ1-σ3)/(σ1-σ3)).
M-K model is widely used in forming limit prediction for sheet metal. However, the necking phenomenon for the high-strength sheet is not obvious when deformation instability occurs. Few studies have been conducted on whether M-K model can be well applied to the forming limit prediction of high-strength sheets. Lou-Huh criterion is a macroscopic fracture criterion, which has more extensive and reliable theoretical basis. However, there was no extensive experimental verification and application for Lou-Huh criterion. It is unclear what prediction effect can be achieved by Lou-Huh criterion for different materials and different forming processes.
In this work, AA7075-T6 sheet is selected as studied material, and the prediction results of theoretical model for AA7075-T6 sheet is discussed. The prediction accuracy of the two theoretical models is evaluated by error analysis, and the theoretical FLCs based on the two theoretical models are verified by the punch-stretch test simultaneously. Eventually, the assessment results can be used as reference in the selection of theoretical forming limit prediction model for high-strength aluminum alloy sheet.
2 Calibration of fracture parameters in Lou-Huh criterion
2.1 Acquisition of fracture-related state variables
In this study, AA7075-T6 sheet with a thickness of 2 mm is selected as the test material. The chemical compositions of the AA7075-T6 sheet are summarized in Table 1. Ten tensile specimens with different notches and sizes are designed, as shown in Fig. 1. These specimens include a uniaxial tensile specimen (UTS), three shear notch specimens (SNS1, SNS2 and SNS3), three arc notch specimens (ANS1, ANS2 and ANS3) and three triangle notch specimens (TNS1, TNS2 and TNS3). The uniaxial tensile specimens were cut down respectively at the angles of 0°, 45° and 90° from rolling direction by wire electrical discharge machining, and the nine notch specimens were cut down along rolling direction. All specimens were stretched by the electronic universal testing machine until they were fractured. In order to make sure that the average strain rate of the fracture initiation region for different specimens is about 0.01 s-1, different tensile speeds must be chosen for various types of tensile specimens. In this work, the tensile speeds of each specimen are eventually determined (shown in Fig. 1) by the finite element inverse method [21] so that the average strain rate at the region where fracture initiates is close to 0.01 s-1. The tensile force-stroke curves of each specimen are obtained from the tensile tests, as shown in Fig. 2.
Table 1 Chemical compositions of 7075-T6 aluminum alloy sheet (wt.%)

It is can be seen from Fig. 3(a) that there is no obvious necking phenomenon for uniaxial tensile specimen of AA7075-T6 sheet. Figures 3(b, c) show the fracture morphology of the uniaxial tensile specimen, where it can be clearly observed that fracture occurred mainly by a ductile-brittle mechanism. A few dimples on the fracture morphology can be seen and the depth of these dimples is shallow. The depth of dimple is mainly related to the plastic deformability of the metal material. The shallow dimple indicates that the plastic deformability of AA7075-T6 sheet is poor at room temperature. The fracture morphology of uniaxial tensile specimen shows ductile fracture characteristics, but the toughness is poor.
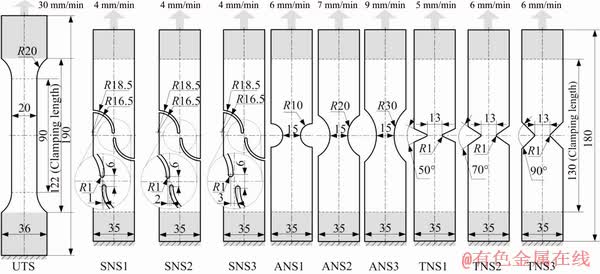
Fig. 1 Shapes and sizes of tensile specimens (unit: mm)
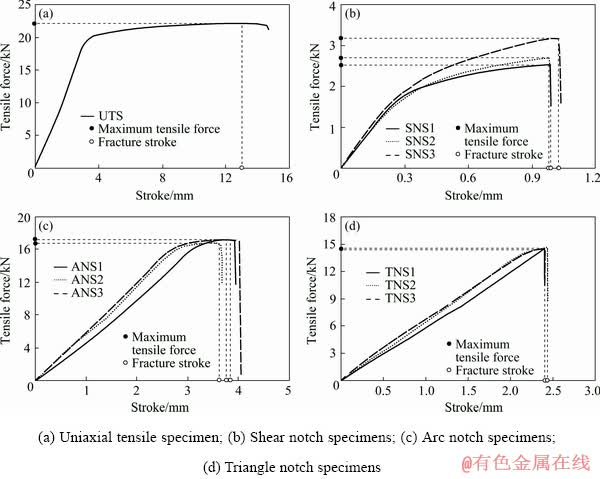
Fig. 2 Tensile force-stroke curves:
The engineering stress-strain curves along different directions are shown in Fig. 4(a). The true stress-strain curve is transformed from the engineering stress-strain curve of UTS along sheet rolling direction, as shown in Fig. 4(b). It can be seen from Fig. 4(a) that there is almost no difference among three engineering stress-strain curves. The elastic and plastic model [22] (seen as Eq. (2) and Eq. (3)) are respectively used to fit the elastic stage and plastic hardening stage of the true stress-strain curve. Eventually, elasticity modulus E and material parameters m1, m2 and h can be obtained as shown in Fig. 4(b).
σ=Eεe (2)
σ=σy+m1εp+m2[1-exp(-hεp)] (3)
where σy is yield strength (MPa); εe is elastic strain; εp is plastic strain.
The tensile processes of ten tensile specimens are simulated by ABAQUS. Ten specimens are defined as deformable homogeneous shell, and the material property parameters are defined by fitting curve data in Fig. 4(b). The von Mises yield criterion and isotropic hardening model are respectively selected as the yield behavior and hardening rule. The element type is selected as four-node elements S4R with reduced integration. After simulation, the fracture-related state variables (stress triaxiality, Lode parameter and fracture strain) can be extracted from the result of simulation, and the extraction steps are as follows: (1) As shown in Fig. 3, the stroke at the maximum tensile force is viewed as the fracture stroke; (2) The fracture initiation point is determined as the element corresponding to the maximum equivalent plastic strain in the centre of fracture region [21,23]; (3) Eventually the fracture-related state variables of fracture initiation point at fracture stroke are extracted from simulation results (summarized in Fig. 5).
2.2 Calculation process of fracture parameters

Fig. 3 Uniaxial tensile specimen of AA7075-T6 sheet after fracture (a) and its fracture morphology (b, c)
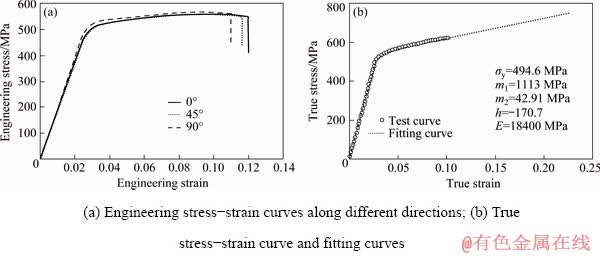
Fig. 4 Stress-strain curves of AA7075-T6 sheet
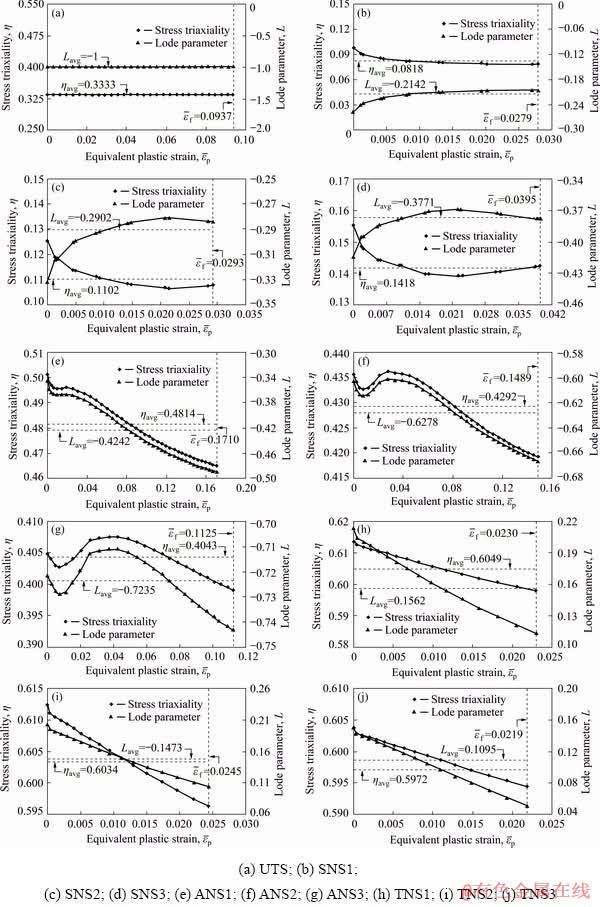
Fig. 5 History curves of stress triaxiality and Lode parameter changing with equivalent plastic strain
The history curves of stress triaxiality and Lode parameter changing with equivalent plastic strain for all notch specimens are not constant (as shown in Fig. 5). Therefore, the history data of stress triaxiality and Lode parameter for all specimens are averaged by Eq. (4) and Eq. (5), and the average stress triaxiality and average Lode parameter are summarized in Table 2.
 (4)
(4)
 (5)
(5)
In Lou-Huh criterion, the fracture strain is essentially plastic strain. However, the limit principle strain of punch-sketch test in the following study is the total strain which is the sum of elastic strain and plastic strain. In order to be closer to the data of punch-sketch test, the fracture strain values of all specimens are modified by the fracture strain value plus the elastic strain value. The modified fracture strain values (seen in Table 2) are used in subsequent studies.
There are three fracture parameters C1, C2 and C3 in Lou-Huh criterion. In general, it only needs the fracture-related state variables of three different specimens to calculate the fracture parameters according to the equations [24,25]. In this work, ten kinds of tensile specimens with different shapes and sizes are designed. However, how to select three specimens from ten specimens to calculate fracture parameter is not clear. Therefore, three specimens are selected from ten specimens to form a specimen option, and 120 kinds of specimen options can be obtained according to principle of permutations and combinations. The 120 specimen options are utilized to calculate the values of fracture parameters simultaneously. The above calculation process is conducted by the “fsolve” function in MATLAB software, and 120 groups of fracture parameters are obtained (shown in Fig. 6). The abscissa of Fig. 6 is specimen option number Xu,v,w, where u, v and w are respectively the specimen numbers (shown in Table 2), and u≠v≠w, (u, v, w)∈ [1, 10]. For example, X1,2,3 represent UTS+SNS1+ SNS2 specimen option, X1,3,10 represent TNS1+ SNS2+TNS3 specimen option, and X8,9,10 represent TNS1+TNS2+TNS3 specimen option. It can be seen from Fig. 6 that the fracture parameters calculated by different specimen options are not same.
3 M-K theory mathematic modeling
Table 2 Fracture strain, average stress triaxiality and average Lode parameter of specimens

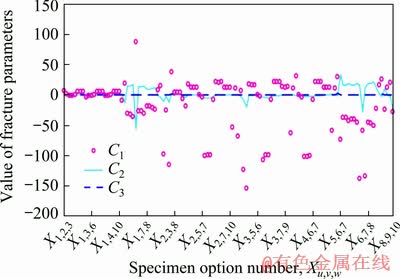
Fig. 6 Calculation results of 120 kinds of specimen options
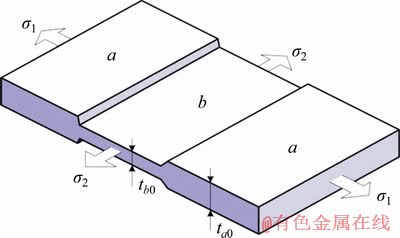
Fig. 7 Schematic of M-K model
M-K model assumes that an initial thickness defect exists on the surface of sheet in the form of a groove (Fig. 7). In Fig. 7, a region and b region respectively represent the uniform deformation and groove region. The uniform deformation region has proportional loading during the whole deformation process, but in the groove region the stress state changes to meet the condition of force equilibrium and condition of geometry compatibility. With the deformation developing, the groove phenomenon becomes more and more obvious until the stress state of groove region turns into the plane strain state (dε2=0). Eventually, localized necking in the groove region causes the sheet metal to fracture. During the whole calculation process, the following conditions are assumed.
(1) Geometry compatibility condition. It is assumed that the increment of minor strain in a region is equal to that in b region:
dε2=dε2a=dε2b (6)
where dε2a and dε2b respectively are the increment of minor strain in a region and that in b region.
(2) Condition of force equilibrium:
σ1ata=σ1btb (7)
where ta and tb respectively are the instantaneous thickness in a region and that in b region; σ1a and σ1b respectively are the major principal stress in a region and that in b region.
(3) The volume of sheet metal remains unchanged before and after plastic deformation:
dε1+dε2+dε3=0 (8)
Because the groove region exists, the sheet metal has the initial thickness imperfection f0:
f0=tb0/ta0 (9)
where ta0 and tb0 respectively are the initial thicknesses of a and b regions.
According to the von Mises yield criterion:
 (10)
(10)
The stress ratio is α=σ2/σ1, so the above formula can be simplified as
 (11)
(11)
It is assumed that  , so the above formula can be simplified as
 (12)
(12)
According to the Drucker criterion and plastic work principle:
 (13)
(13)
It is assumed that β is equal to the ratio of the increment of minor strain to the increment of major strain, and ρ is equal to the ratio of the increment of equivalent strain to the increment of major strain:
 (14)
(14)
 (15)
(15)
The strain along the thickness direction of sheet metal is ε3=ln(t/t0), so the thickness imperfection f of sheet metal during the deformation process is
 (16)
(16)
By substituting Eq. (7) and  into Eq. (16), the relationship between the a and b regions can be obtained:
 (17)
(17)
The third principle strain and equivalent strain in a region and that in b region can be expressed in the increment form as
 (18)
(18)
 (19)
(19)
 (20)
(20)
 (21)
(21)
By substituting the constitutive equation (σ=Kεn) and Eqs. (18)-(21) into Eq. (17), there is
 (22)
(22)
The computation process of M-K model is shown in Fig. 8. As is shown in Fig. 8, Eq. (22) can be simplified to the function of  ,
,  , Δε1a, Δε1b, ε3a, ε3b and αa. The values of , , ε3a and ε3b in Eq. (22) are the superpositions of all previous increments. It is assumed that the major strain in region b increases by step length of Δε1b=0.005. The material property parameters and a certain stress ratio are substituted into the computation program of M-K model, and then the increment of major strain for a region (Δε1a) can be obtained according to NewtonεRaphson iteration method. When Δε1b/Δε1a≥10, it is considered that localized necking already happened, therefore the limit strain of a region can be acquired for a certain kind of loading condition. By changing αa in the range of 0-1, the theoretical FLD based on M-K model can be acquired.
4 Establishment of theoretical forming limit diagram
4.1 Establishment of FLD according to Lou-Huh criterion
It can be found from the computation results that there are significant differences among the values of fracture parameters. Therefore, the theoretical fracture strain of 120 specimen options for each specimen is calculated, and then the error between theoretical fracture strain and experimental fracture strain is calculated. Prediction accuracy of different specimen options is evaluated by error analysis. Eventually, the most reasonable specimen options can be selected and forming limit diagram of AA7075-T6 sheet can be established.
(1) The calculation process of theoretical fracture strain based on Lou-Huh criterion
By substituting the average stress triaxiality, average Lode parameter and fracture parameters C1, C2 and C3 into the analysis expression of Lou-Huh criterion (Eq. (1)), the theoretical fracture strain of 120 specimen options for each specimen can be obtained:
 (23)
(23)
(2) The calculation process of prediction error between theoretical fracture strain and experimental fracture strain
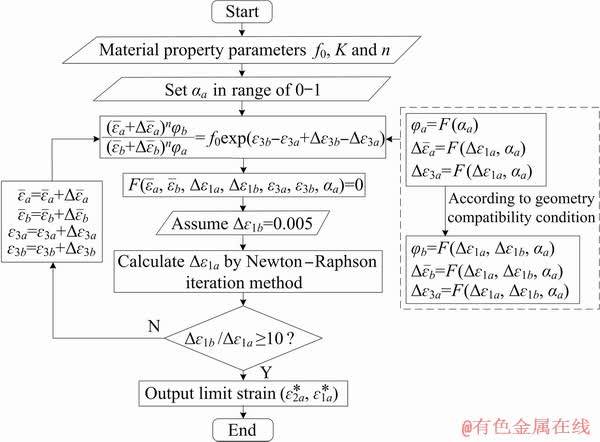
Fig. 8 Computation process of M-K model
Firstly, the fracture strain after modification (shown in Table 2) is regarded as experimental fracture strain. By substituting experimental fracture strain and theoretical fracture strain into Eq. (24), the prediction error δ can be calculated. Secondly, the mean error δavg and the variance s2 can be calculated according to Eq. (25) and Eq. (26). The theoretical prediction accuracy of fracture parameters is evaluated by the mean error δavg, and the dispersion degree of prediction error is assessed by the variance s2.
 (24)
(24)
 (25)
(25)
 (26)
(26)
where i is specimen number (1-10);  is experimental fracture strain;
  is theoretical fracture strain; δ is prediction error; δavg is mean error; s2 is variance.
The prediction error is calculated according to the above computation process, and the results are shown in Fig. 9. As seen in Fig. 9(a), the theoretical prediction results of different specimen options have a large difference. As shown in Fig. 9(a), the prediction accuracy of some specimen options is better with mean error less than 30%, while the prediction result of other specimen options is poor (the mean error is more than 30%). Therefore, it is important to choice specimen option with good prediction result. The specimen options with the mean error less than 30% is selected from Fig. 9(a) for the following analysis and the variance chart of these specimen options is drawn in Fig. 9(b). It can be seen from Fig. 9(b) that the values of variance corresponding to different specimen options are also significantly different. Therefore, the specimen options need to be further screened by the value of variance. The selection rule of specimen options is as follows: the specimen option with the minimum variance is picked out from the options with mean prediction error less than 30%. Eventually, the UTS+SNS3+TNS2 specimen option (the specimen option number is X1,4,9) is screened by the above rule for the following forming limit research.
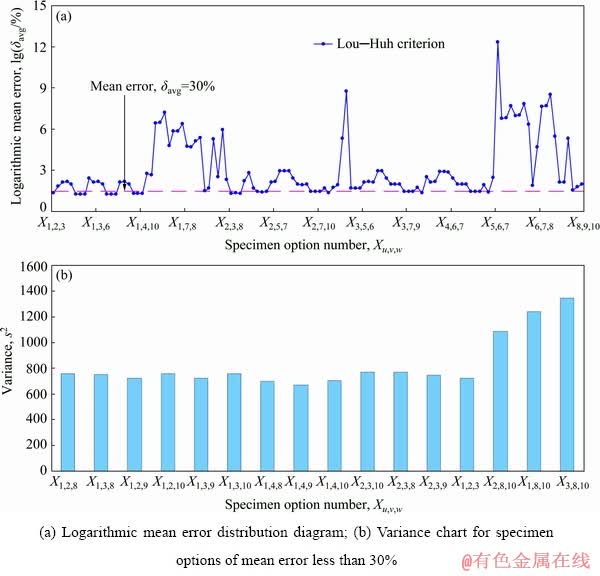
Fig. 9 Error distribution diagrams
After picking out the specimen option with the minimum variance from the options with mean prediction error less than 30%, the theoretical forming limit curve can be drawn based on the Lou-Huh criterion. The following is the establishment process of theoretical forming limit curve based on Lou-Huh criterion.
Set the stress ratio as α=σ2/σ1 and the strain ratio as β=ε2/ε1. Under proportional loading condition, the equation between stress ratio and strain ratio can be acquired by incremental theory of plasticity:
α=(2β+1)/(2+β) (27)
Under the condition of plane stress state, stress triaxiality, Lode parameter and fracture strain can be respectively expressed as
 (28)
(28)
L=2α-1 (29)
 (30)
(30)
Substituting Eqs. (28)-(30) into the analysis expression of Lou-Huh criterion (Eq. (1)) gives

 (31)
(31)
Therefore, under the stress state of plane biaxial tension (σ1≥σ2≥σ3=0), the theoretical forming limit diagram based on Lou-Huh criterion can be established by the following equations:
 (32)
(32)
By substituting fracture parameter of the UTS+SNS3+TNS2 specimen option into Eq. (32), the theoretical FLD of AA7075-T6 sheet based on Lou-Huh criterion can be established, as shown in Fig. 10.
4.2 Establishment of FLD according to M-K model
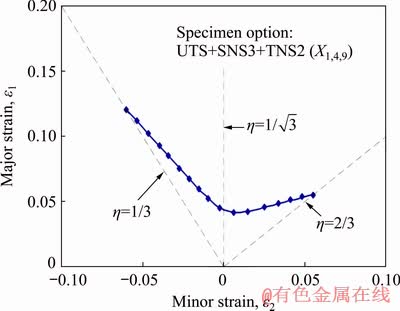
Fig. 10 FLD of AA7075-T6 sheet based on Lou-Huh criterion
Before applying M-K model to draw the theoretical forming limit diagram, it is necessary to determine the material property parameters especially the initial thickness imperfection f0. It is difficult to determine the initial thickness imperfection f0 because it is hard to measure the hypothetic groove on the surface of flat sheet. There is no uniform method to determine f0 and its determination has some subjective factor no matter what kind of method is used [26,27]. As shown in Fig. 11(a), the theoretical forming limit curves of AA7075-T6 sheet under different initial thickness imperfections are significantly different. The larger the value of f0 is, the higher the forming limit curve is. This indicates that the fewer the defects in the sheet metal are, the better the formability is. Satisfactory results have been achieved in calibrating the value of f0 by inverse method [28,29]. In this research, the inverse method is used to determine the initial thickness imperfection of AA7075-T6 sheet. Firstly, the strain of UTS at fracture stroke is viewed as measured major strain ε1,exp. Secondly, The theoretical major strain ε1,cal of the UTS is calculated according to M-K model. The initial thickness imperfection f0 in M-K computation program is adjusted to make the error between theoretical major strain and measured value less than 0.005. Eventually, the initial thickness imperfection f0 of AA7075-T6 sheet is determined with the value of 0.881. The strength coefficient K and strain hardening index n in the constitutive equation (σ=Kεn) are determined by fitting the true stress-strain curve of the AA7075-T6 sheet. The values of the strength coefficient K and the strain hardening index n respectively are 849.97 MPa and 0.14 with correlation coefficient R2 of 0.992. By substituting material property parameters of AA70675-T6 sheet into the computation program of M-K model, the theoretical forming limit diagram can be obtained, as shown in Fig. 11(b).
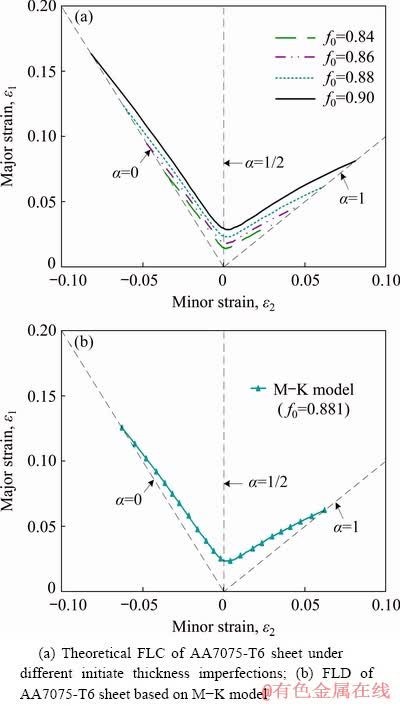
Fig. 11 FLD of AA7075-T6 sheet according to M-K model
5 Experimental evaluation of theoretical forming limit diagram
5.1 Evaluation with tensile test of notch specimens
The theoretical fracture strains of the two models for each tensile specimen are calculated firstly. Then, the error between the theoretical fracture strain and the experiment fracture strain can be calculated by referring to the computation process of prediction error in Section 4.1. Eventually, the prediction accuracy of the two theoretical prediction criteria is evaluated by error analysis.
(1) Calculation process of theoretical fracture strain based on M-K model
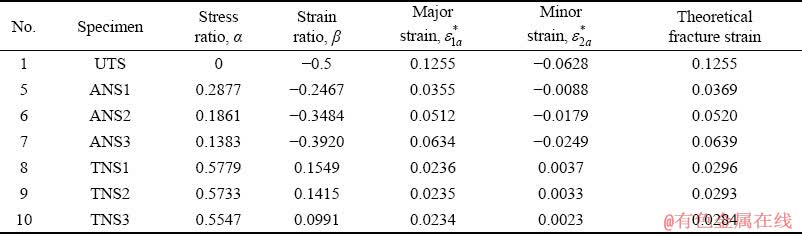
Since M-K model can only predict the fracture condition within the ranges from uniaxial tension stress state to the equi-biaxial tension stress state, it only needs to calculate the theoretical fracture strain of seven kinds of specimens except three shear notch specimens. Since the average stress triaxiality of each specimen is already known, the stress ratio of all specimens in fracture initiation region can be calculated by Eq. (28), and the calculation results are summarized in Table 3. By substituting the stress ratio and material property parameters into computation program of M-K model, theoretical limit principal strain  and
and  of all specimens can be calculated, and the computation results are also given in Table 3. Eventually, the theoretical fracture strain of each specimen based on M-K model can be obtained by substituting the major strain and strain ratio into Eq. (30).
(2) Calculation process of theoretical fracture strain based on Lou-Huh criterion with UTS+ SNS3+TNS2 specimen option
Table 3 Stress ratio, strain ratio and theoretical fracture strain based on M-K model
In Section 4.1, theoretical fracture strains of UTS+SNS3+TNS2 specimen option are already obtained.
(3) Calculation process of prediction error
According to the error analysis method in Section 4.1, the prediction errors between theoretical fracture strain and experimental fracture strain are calculated by Eq. (24). The mean error δavg and the variance s2 are respectively calculated by Eq. (25) and Eq. (26). The predicted error results of M-K model and Lou-Huh criterion with UTS+SNS3+TNS2 specimen option are shown in Fig. 12.

Fig. 12 Comparison of prediction error between Lou-Huh criterion and M-K model
As shown in Fig. 12, the prediction error of M-K model for uniaxial tensile specimen is only 5.33%, but for other specimens it is very large (prediction error ranging from 66.99% to 94.05%). This indicates that the prediction accuracy of M-K model for all the notch specimens is very poor. The prediction results of Lou-Huh criterion with UTS+SNS3+TNS2 specimen option for 4 kinds of notch specimens are better than M-K model except three arc notch specimens. On the other hand, the mean error of Lou-Huh criterion is only 25.04% which is much lower than that of M-K model (74.24%).
5.2 Evaluation with punch-stretch test
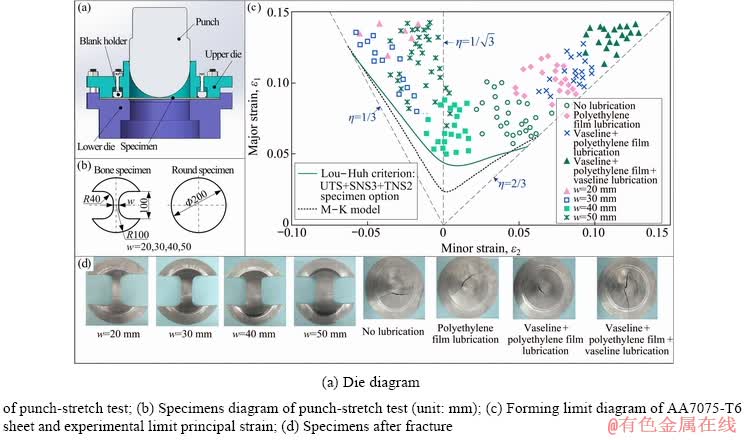
Fig. 13 Theoretical FLD of AA7075-T6 sheet and limit principal strain obtained by punch-stretch test
Punch-stretch test is designed to verify the theoretical FLCs of AA7075-T6 sheet separately obtained by M-K model and Lou-Huh criterion. The die diagram of punch-stretch test is shown in Fig. 13(a) and the shapes and sizes of the specimens are shown in Fig. 13(b). The round specimen with diameter of 200 mm and the bone specimens with intermediate width of 20, 30, 40 and 50 mm, respectively, were prepared for testing. Square grid was electrolytically etched on the surface of all specimens before testing. During the testing process, different lubrication conditions were adopted for different specimens: no lubrication for the bone specimens and four kinds of lubrication conditions for the round specimen. Four lubrication conditions include: (1) no lubrication, (2) polyethylene film lubrication, (3) vaseline + polyethylene film lubrication and (4) vaseline + polyethylene film + vaseline lubrication. After the specimens fractured, the limit principal strain of fracture region for the round specimens and bone specimens was measured by the grid strain measuring system. The experimental limit principal strain is extracted from the grid strain measuring system and is drawn in the theoretical forming limit diagram of AA7075-T6 sheet (as shown in Fig. 13(c)).
As shown in Fig. 13(c), the theoretical FLD of Lou-Huh criterion is more close to the limit principal strain of punch-stretch test than that of M-K model. In the area near the uniaxial tensile stress state and the equi-biaxial stress state, the FLC drawn by M-K model is close to the experimental limit principal strain. However, the theoretical FLC of M-K model differs greatly from the experimental results when it approaches plane strain state. At the same time, it is can be found that the experimental verification results are consistent with the prediction error distribution in Fig. 12.
5.3 Discussion
M-K model is a typical tensile instability theory and Lou-Huh criterion is a typical ductile fracture criterion. Both of the two models are macroscopic mechanical phenomenological criteria. However, the evaluation results of tensile tests for the notch specimen and the punch stretch test show that Lou-Huh criterion is better than M-K model in predicting the fracture of AA7075-T6 sheet. M-K model loses theoretical basis and has a large prediction error for the forming limit prediction of AA7075-T6 sheet, because there is no obvious necking phenomenon for uniaxial tensile specimen of AA7075-T6 sheet. The theoretical basis of Lou-Huh criterion is the microscopic fracture mechanism of void nucleation, growth and coalescence. Due to more extensive and reliable theoretical basis, Lou-Huh criterion shows better superiority for forming limit prediction of AA7075-T6 sheet. In addition, compared with the traditional ductile fracture criteria, Lou-Huh criterion comprehensively considers the influence of Lode parameter and stress triaxiality on ductile fracture. It uses fracture strain, stress triaxiality and Lode parameter to describe the nucleation, growth and coalescence of voids. The macroscopic factors considered by Lou-Huh criterion are so comprehensive that the scope of application is wider and the prediction accuracy is higher.
It can be seen from Fig. 12 that the mean prediction error of Lou-Huh criterion for seven specimens is 25.04%. This level of error indicates that Lou-Huh criterion is not very accuracy for predicting the fracture of AA7075-T6 sheet. The reason may be related to the fracture mode of AA7076-T6 sheet. As shown in Fig. 2, the AA7075-T6 sheet has the characteristic of high strength and poor toughness. Its fracture morphology exhibits not only ductile fracture characteristics (dimples), but also brittle fracture characteristics. Therefore, the microscopic mechanism of ductile fracture is not the whole reason of the fracture for AA7075-T6 sheet and the ductile fracture criterion inevitably has some errors in predicting the occurrence of fracture. Nevertheless, the results of the punch-sketch test show that the forming limit curve based on Lou-Huh criterion is basically the lower profile of the experimental data set. This phenomenon illustrates that Lou-Huh criterion can effectively predict the forming limit of AA7075-T6 sheet by reasonable parameters calibration and the prediction result of forming limit diagram is reasonable.
6 Conclusions
(1) The selection of tensile specimen has a great influence on the calculation result of the ductile fracture criterion. The UTS+SNS3+TNS2 specimen option with the minimum variance of prediction error is selected from the segmental specimen options with smaller mean prediction error to determine the fracture parameters of AA7075-T6 sheet and good prediction results are acquired.
(2) M-K model based on the tensile instability theory cannot effectively predict the forming limit of high-strength AA7075-T6 sheets with inconspicuous necking before fracture. The error analysis shows that M-K model has a mean prediction error up to 74.24% when predicting the fracture of AA7075-T6 tensile specimens.
(3) Lou-Huh ductile fracture criterion based on the microscopic mechanism of voids nucleation, growth and coalescence can acquire good prediction result when predicting the forming limit of high- strength AA7075-T6 sheet. The mean prediction error of tensile specimens is 25.04% and the theoretical forming limit curve is basically in accordance with the lower profile of the experimental data set obtained by punch-sketch test.
References
[1] YU Hai-yan, WANG You. Bulging simulation of ductile fracture of 5052 aluminum alloy [J]. The Chinese Journal of Nonferrous Metals, 2015, 25(11): 2975-2981. (in Chinese)
[2] LIU Jun-tao, ZHANG Yong-an, LI Xi-wu, LI zhi-hui, XIONG Bai-qing, ZHANG Ji-shan. Microstructure and properties of two-step aged novel 7056 aluminum alloy [J]. The Chinese Journal of Nonferrous Metals, 2016, 26(9): 1850-1857. (in Chinese)
[3] ERFANIAN M, HASHEMI R. A comparative study of the extended forming limit diagrams considering strain path, through-thickness normal and shear stress [J]. International Journal of Mechanical Sciences, 2018, 148: 316-326.
[4] NASIRI S M M, BASTI A, HASHEMI R, DARVIZEH A. Effects of normal and through-thickness shear stresses on the forming limit curves of AA3104-H19 using advanced yield criteria [J]. International Journal of Mechanical Sciences, 2018, 137: 15-23.
[5] SWIFT H W. Plastic instability under plane stress [J]. Journal of the Mechanics and Physics of Solids, 1952, 1(1): 1-18.
[6] HILL R. On discontinuous plastic states, with special reference to localized necking in thin sheets [J]. Journal of the Mechanics and Physics of Solids, 1952, 1(1): 19-30.
[7] ROCHA A B D, BARLAT F, JALINIER J M. Prediction of the forming limit diagrams of anisotropic sheets in linear and non-linear loading [J]. Materials Science and Engineering A, 1985, 68(2): 151-164.
[8] MORCINIAK Z, KUCZYNSKI K. Limit strains in the processes of stretch-forming sheet metal [J]. International Journal of Mechanical Sciences, 1967, 9: 609-620.
[9] MA Gao-shan, WAN Min, WU Xiang-dong. Theoretical prediction of FLDs for Al-Li alloy at elevated temperature based on M-K model [J]. The Chinese Journal of Nonferrous Metals, 2008, 18(6): 980-984. (in Chinese)
[10] LI Xiao-qiang, SONG Nan, GUO Gui-qiang. Experimental measurement and theoretical prediction of forming limit curve for aluminum alloy 2B06 [J]. Transactions of Nonferrous Metals Society of China, 2012, 22(S): s335-s342.
[11] CAO Jun, LI Fu-guo, MA Xin-kai, SUN Zhan-kun. Study of fracture behavior for anisotropic 7050-T7451 high-strength aluminum alloy plate [J]. International Journal of Mechanical Sciences, 2017, 128: 445-458.
[12] QUAN Guo-zheng, WANG Feng-biao, LIU Ying-ying, ZHOU Shi-jie. Evaluation of varying ductile fracture criterion for 7075 aluminum alloy [J]. Transactions of Nonferrous Metals Society of China, 2013, 23(3): 749-755.
[13] COCKCROFT M G, LATHAM D J. Ductility and the workability of metals [J]. Journal of the Institute of Metals, 1968, 96(1): 33-39.
[14] RICE J R, TRACEY D M. On the ductile enlargement of voids in triaxial stress fields [J]. Journal of the Mechanics and Physics of Solids, 1969, 17(3): 201-217.
[15] OH S I, CHEN C C, KOBAYASHI S. Ductile fracture in axisymmetric extrusion and drawing―Part 2: Workability in extrusion and drawing [J]. Journal of Engineering for Industry, 1977, 101(1): 36-44.
[16] OYANE M, SATO T, OKIMOTO K, SHIMA S. Criteria for ductile fracture and their applications [J]. Journal of Mechanical Working Technology, 1980, 4(1): 65-81.
[17] CLIFT S E, HARTLEY P, STURGESS C E N, ROWE G W. Fracture prediction in plastic deformation processes [J]. International Journal of Mechanical Sciences, 1990, 32(1): 1-17.
[18] KO Y K, LEE J S, HUH H, KIM H K, PARK S H. Prediction of fracture in hub-hole expanding process using a new ductile fracture criterion [J]. Journal of Materials Processing Technology, 2007, 187: 358-362.
[19] BAO Y, WIERZBICKI T. On fracture locus in the equivalent strain and stress triaxiality space [J]. International Journal of Mechanical Sciences, 2004, 46: 81-98.
[20] LOU Y, HUH H. Extension of a shear-controlled ductile fracture model considering the stress triaxiality and the Lode parameter [J]. International Journal of Solids and Structures, 2013, 50(2): 447-455.
[21] LOU Y, HUH H. Prediction of ductile fracture for advanced high strength steel with a new criterion: Experiments and simulation [J]. Journal of Materials Processing Technology, 2013, 213: 1284-1302.
[22] MICHAEL B, OLIVER C, DANIEL A, LARISSA A, MARCILIO A. A ductile damage criterion at various stress triaxialities [J]. International Journal of Plasticity, 2008, 24(10): 1731-1755.
[23] ZHUANG X, MENG Y, ZHAO Z. Evaluation of prediction error resulting from using average state variables in the calibration of ductile fracture criterion [J]. International Journal of Damage Mechanics, 2018, 27(8): 1231-1251.
[24] ZHUANG X, WANG T, ZHU X, ZHAO Z. Calibration and application of ductile fracture criterion under non- proportional loading condition [J]. Engineering Fracture Mechanics, 2016, 165: 39-56.
[25] WIERZBICKI T, BAO Y, LEE Y W, BAI Y. Calibration and evaluation of seven fracture models [J]. International Journal of Mechanical Sciences, 2005, 47: 719-743.
[26] CHAN L C, LU X Z. Material sensitivity and formability prediction of warm-forming magnesium alloy sheets with experimental verification [J]. The International Journal of Advanced Manufacturing Technology, 2014, 71(1-4): 253-262.
[27] CAO Xiao-qing, XU Ping-ping, QI Fan, WANG Wen-xian. Theoretical prediction of forming limit diagram of AZ31 magnesium alloy sheet at warm temperatures [J]. Transactions of Nonferrous Metals Society of China, 2016, 26(9): 2426-2432.
[28] DONG Guo-jiang, BI Jiang., DU Bing., CHEN Xiao-hua, ZHAO Chang-cai. Research on AA6061 tubular components prepared by combined technology of heat treatment and internal high pressure forming [J]. Journal of Materials Processing Technology, 2017, 242: 126-138.
[29] YANG Xi-ying, LANG Li-Hui, LIU Kang-ning., CAI Gao-can, GUO Can. Prediction of forming limit diagram of AA7075-O aluminum alloy sheet based on modified M-K model [J]. Journal of Beijing University of Aeronautics and Astronautics, 2015, 41(4): 675-679. (in Chinese).
董国疆1,陈志伟2,杨卓云2,樊博成1
1. 燕山大学 河北省特种运载装备重点实验室,秦皇岛 066004;
2. 燕山大学 先进锻压成形技术与科学教育部重点实验室,秦皇岛 066004
摘 要:为了能够有效预测AA7075-T6高强铝板的破裂,依据Morciniak-Kuczyski模型(M-K模型)与Lou-Huh准则分别绘制AA7075-T6高强铝板成形极限曲线,通过缺口试样误差评估比较两种理论预测模型预测值与试验值之间的相对误差,并通过半球形刚模胀形试验对两种理论预测模型绘制的成形极限曲线进行验证,以此评价M-K模型与Lou-Huh准则的预测精度。由误差分析可知,采用最优断裂参数的Lou-Huh准则对各拉伸试样的误差均值为25.04%,而M-K模型对各拉伸试样的误差均值达到74.24%,Lou-Huh准则对AA7075-T6板材的破裂预测精度较高。半球形刚模胀形试验验证结果表明,用Lou-Huh准则绘制的成形极限曲线能够有效预测AA7075-T6板材的破裂,而M-K模型构建的成形极限曲线预测结果较差。
关键词:韧性断裂准则;M-K模型;成形极限图;AA7075-T6板材
(Edited by Bing YANG)
Foundation item: Project (51775481) supported by the National Natural Science Foundation of China; Project (E2019203418) supported by the Natural Science Foundation of Hebei Province, China; Project (ZD2017078) supported by the Science and Technology Plan of Hebei Higher School of Education Department, China
Corresponding author: Guo-jiang DONG; Tel: +86-13780479660; E-mail: dgj@ysu.edu.cn
DOI: 10.1016/S1003-6326(20)65311-0

