J. Cent. South Univ. (2017) 24: 284-295
DOI: 10.1007/s11171-017-3429-0

Hot deformation behavior and constitutive modeling of Q345E alloy steel under hot compression
QIAN Dong-sheng(Ǯ����)1, 2, 3, PENG Ya-ya(������)1, 2, DENG Jia-dong(�˼Ӷ�)2, 4
1. School of Materials Science and Engineering, Wuhan University of Technology, Wuhan 430070, China;
2. School of Automotive Engineering, Wuhan University of Technology, Wuhan 430070, China;
3. Hubei Key Laboratory of Advanced Technology for Automotive Components, Wuhan 430070, China;
4. State Key Laboratory of Materials Processing and Die & Mould Technology, Wuhan 430070, China
 Central South University Press and Springer-Verlag Berlin Heidelberg 2017
Abstract: Q345E as one of typical low alloy steels is widely used in manufacturing basic components in many fields because of its eminent formability under elevated temperature. In this work, the deformation behavior of Q345E steel was investigated by hot compression experiments on Gleeble-3500 thermo-mechanical simulator with the temperature ranging from 850 ��C to 1150 ��C and strain rate ranging from 0.01 s-1 to 10 s-1. The experimental results indicate that dynamic softening of Q345E benefits from increasing deformation temperature and decreasing strain rate. The mathematical relationship between dynamic softening degree and deformation conditions is established to predict the dynamic softening degree quantitatively, which is further proved by some optical microstructures of Q345E. In addition, the experimental results also reveal that the stress level decreases with increasing deformation temperature and decreasing strain rate. The constitutive equation for flow stress of Q345E is formulated by Arrihenius equation and the modified Zener-Hollomon parameter considering the compensation of both strain and strain rate. The flow stress values predicted by the constitutive equation agree well with the experimental values, realizing the accurate prediction of the flow stress of Q345E steel under hot deformation.
Key words: hot deformation behavior; dynamic softening; flow stress; constitutive model
1 Introduction
Q345E alloy steel is widely used in manufacturing basic structural components because of its eminent formability under elevated temperature. Studying the behavior at hot deformation conditions and establishing the reliable mathematical equations for predicting the deformation behavior of Q345E steel quantitatively under hot processing conditions can importantly support the technological design and improve mechanical property of components.
Some attempts on hot deformation behavior of Q345 steel have been carried out, which are completed based on SHPB (split Hopkinson pressure bar) technique and focused on the mechanical property of Q345 steel under temperatures lower than the hot- working temperature of Q345 steel with impact load [1, 2]. However, the study on dynamic softening behavior and the constitutive relationship for flow stress of Q345 steel under hot-working conditions has not been reported.
Dynamic softening behavior is one of the most important hot deformation behaviors. LIN et al [3] revealed four deformation stages during the hot compression process: work hardening stage, stable stage, softening stage and steady stage. LI et al [4] separated the true strain-stress curves into the stages before and after reaching the peak stress. In the first stage, the flow stress increased due to work hardening; in the second stage, the curves exhibited steady stage as a result of equilibrium of work hardening and dynamic softening. LIANG et al [5] designed a dynamic softening map to predict the corresponding softening behaviors under certain deformation conditions. The researches above investigated the dynamic softening behavior just by the true stress-strain curves but didn��t combine the theories to the microstructure, which shows the essence of dynamic softening.
Some empirical mathematical models based on the experiment and mathematical statistics are widely applied to constitutive modeling for flow stress [6-9]. At present, three empirical mathematic models: Johnson- cook model, Zerilli-Armstrong model and Arrhenius equation, get the main application. From the research results [10, 11], Zerilli-Armstrong model and Arrhenius equation are more accurate and reliable and Arrhenius equation has the widest range of application.
This work focuses on quantitative prediction of the dynamic softening degree and flow stress of Q345E during hot deformation. By conducting the hot compression experiment on Gleeble-3500 thermo- mechanical simulator, the true stress-strain curves of Q345E under different deformation temperatures and strain rates are obtained. The kinetic model of DRX (dynamic recrystallization) is built by Avrami equation to express the quantitative relationship between the dynamic softening and deformation conditions, which can accurately predict the dynamic softening degree under different deformation conditions. Some optical microstructures of Q345E are displayed to prove the validity of this relationship. Furthermore, Arrihenius type equation is utilized to establish the constitutive equation for flow stress of Q345E under elevated temperature and the compensation of both strain and strain rate is considered to make the predicted values of flow stress agree well with the experimental values of flow stress. Thus, the accurate prediction for flow stress of Q345E under elevated temperature can be realized.
2 Hot compression experiment
The specimens were sampled from the bar of Q345E, which were machined with a diameter of 8 mm and a height of 12 mm. The chemical composition is shown in Table 1. The initial microstructure is shown in Fig. 1(a) and some second phases are distributed at the grain boundaries. Figure 1(b) is the dark field image of Fig. 1(a) and the pearlite lamella indicates that the second phase is pearlite. The hot compression experiment was conducted on the Gleeble-3500 thermo- mechanical simulator in the sate key laboratory of materials processing and die & mould technology of Huazhong University of Science and Technology, China. The test was executed under different deformation temperatures of 850, 950, 1050, 1150 ��C with strain rates of 0.01, 0.1, 1 and 10 s-1, respectively, as shown in Fig. 2. The first step of the experiment was to place the specimen welded to thermocouple wire between the two compressive anvils as shown in Fig. 2(b). The high- temperature specimen lubricant was added into the contact surface between specimen and anvils. The specimens were compressed by anvils and were quenched when the compression completed. The whole experiment procedure is shown in Fig. 3, which expresses that the specimens were heated to 1150 ��C at a heating rate of 10 ��C/s and held for 4 min to uniform the microstructure, and then were cooled to specific deformation temperature and compressed with a specific strain rate. The specimen after hot compression is shown in Fig. 4 and the reduction in height of specimen after hot compression is 60% of its original height.
3 Results and discussion
3.1 True stress-strain curve
The true stress-strain curves for Q345E under different deformation temperatures with strain rates of 0.01, 0.1, 1, 10 s-1 are illustrated in Fig. 5. From all the curves, it can be concluded that the flow stress level decreases with the increase of deformation temperature and decrease of strain rate. Just a part of curves display the peak stress, which suggests that the dynamic softening just occurs at certain deformation conditions. And the dynamic softening degree increases with the increasing of deformation temperature and decreasing of strain rate.
Table 1 Chemical composition of Q345 steel used in this work


Fig. 1 Initial optical microstructure of Q345E steel bar:
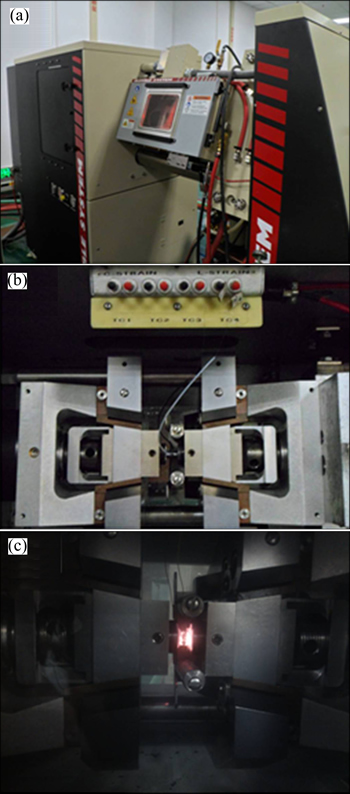
Fig. 2 Gleeble-3500 thermo-mechanical simulator (a), compression area and anvils (b) and process of hot compression(c)
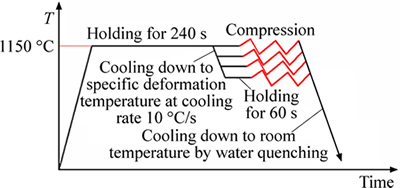
Fig. 3 Experiment procedure
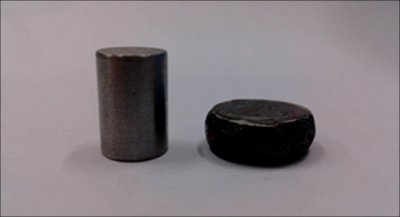
Fig. 4 Specimen before (left) and after (right) hot compression experiment
3.2 Dynamic softening behavior
By comparing the true stress-strain curves under different deformation temperatures and strain rates, as shown in Figs. 5(a)-(d), it can be discovered that the dynamic softening occurs under higher deformation temperature and smaller strain rate.
WANG et al [12] pointed out that the behavior of dynamic softening presented on the true stress-strain curves was due to the accumulation of dislocations in the process of DRX (dynamic recrystallization). The degree of dynamic softening increases with the increase of the volume fraction of DRX. Therefore, dynamic softening degree can be described by volume fraction of DRX. Kinetic model of DRX can be expressed by the modified Avrami equation [13]:
 (1)
(1)
 (2)
(2)
 (3)
(3)
where Xd is the volume fraction of DRX; ��* is the strain for the maximum of softening rate; ��c is the critical strain; k, n, a1, a2, b1 and b2 are material constants; Q1 and Q2 are the activation energy; R is the gas constant (8.314 J/(mol��K)); T is the deformation temperature.
The critical strain can be determined as the inflection point of the work hardening rate ��-�� curve (where ��=d��/d��) [14], which corresponds to the minimum value of (-d��/d��). The analysis of inflection points in the plot of ��-�� curves up to the peak point of the true stress�Cstrain curves has indicated the critical stress (��c, corresponding to ��c) as shown in Fig. 6. The strain for the maximum of softening rate, ��*, is determined when the value of strain hardening rate reaches the valley point in ��-�� curves after the peak point of true stress�Cstrain curves as shown in Fig. 7. The linear relationships of ln��c with 1/T and  are exhibited in Fig. 8(a), which can calculate the values of a1, a2 and Q1 as 0.002381, 0.14722 and 45234 J/mol, respectively. The linear relationships of ln��* with 1/T and displayed in Fig. 8(b) can determine the values of b1, b2 and Q2 as 0.000834, 0.22765 and 72193.326 J/mol, respectively.
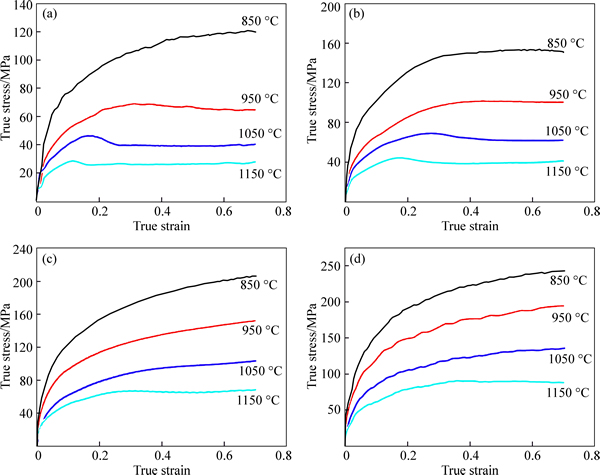
Fig. 5 True stress-strain curves for Q345E steel under different deformation temperatures with strain rates of 0.01 s-1 (a), 0.1 s-1 (b),and 1 s-1 (c) and 10 s-1 (d)

Fig. 6 ��-�� curves up to peak point of true stress�Cstrain curves
The relationship between the flow stress of materials and the volume fractions of DRX can be expressed as follows [15]:
 (4)
(4)
where ��p is the peak stress; ��s is the steady-state stress; ��p and ��s occur at the points when the hardening rate is zero as shown in the ��-�� curves after the peak point of true stress�Cstrain curves in Fig. 7.
Taking the logarithm of both sides of Eq. (5) gives
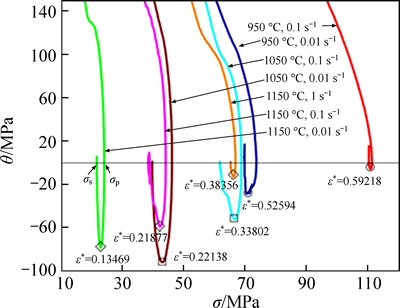
Fig. 7 ��-�� curves after peak point of true stress�Cstrain curves
 (5)
(5)
The mean values of k and n can be determined by regression analysis in Fig. 9 as 1.26777 and 4.46184, respectively.
From what has been discussed above, the kinetic model of DRX can be formulated as follows:
 (6)
(6)

Fig. 8 Relationship between strain rate as well as deformation temperature:

Fig. 9 Relationship between ln[(��-��c)/��*] and ln[-ln(1-Xd)]
 (7)
(7)
 (8)
(8)
The curves of DRX kinetic model for Q345E under strain rate 0.1 s-1 at deformation temperature 950, 1050 and 1150 ��C is shown in Fig. 10(a), and Fig. 10(b) shows curves under deformation temperature 1150 ��C with strain rate 0.01, 0.1 and 1 s-1. It is obvious that the volume fraction of DRX increases with the increasing of deformation temperature and decreasing of strain rate. From the kinetic model of DRX, it can be identified whether DRX occurs under certain deformation condition, and the dynamic softening degree can be predicted quantitatively.

Fig. 10 Predicted volume fraction (a) of DRX obtained at deformation temperature 950, 1050 and 1150 ��C with same strain rate of 0.01 s-1 and at the same deformation temperature 950 ��C with strain rates of 0.1, 1 and 10 s-1 (b)
Figure 11 shows the optical microstructure of Q345E holding for 4 min under 1150 ��C, that is, the microstructure is at the moment just before hot compression. Some optical microstructures of specimens after compression are displayed in Figs. 12 and 13. It can be seen from Fig. 12(a) that the shape and the size of grains are not uniform, some bigger austenite grains are elongated and have oriented characteristics, and the other small austenite grains locate along the bent grain boundaries of elongated austenite grains indicating that DRX occurs partially at the deformation temperature 950 ��C with strain rate of 0.01 s-1. As can be seen from Figs. 12(b) and (c), only the equiaxed grains are observed, which suggests that DRX has completed at the deformation temperature 1050 and 1150 ��C with strain rate of 0.01 s-1. It can be seen from Fig. 12(c) that the austenite grains are bigger than those in Fig. 12(b),which means that the newly formed grains of DRX grow rapidly at a deformation temperature above 1050 ��C. It is obvious that the volume fraction of DRX and austenite grain size increase with the increasing of deformation temperature. The grains formed from DRX distribute along the elongated austenite grains. The optical microstructures in Fig. 13 show that DRX hasn��t completed under the deformation temperature 950 ��C with strain rates of 0.1, 1, 10 s-1, From Fig. 13(a) to Fig. 13(c), it can be seen that the grains forming from DRX locating around the elongated austenite grains are decreasing with the increasing strain rate, that is, the decreasing strain rate leads to larger volume fraction of DRX. All the conclusions above revealed from the optical microstructures have proved the validity of the relationship between the volume fraction of DRX and the deformation conditions.

Fig. 11 Microstructure of Q345E steel just before compression

Fig. 12 Optical microstructures of specimens deformed with strain rate of 0.01 s-1 at deformation temperatures:

Fig. 13 Optical microstructures of specimens deformed at deformation temperature 950 ��C with strain rates:
3.3 Constitutive modeling for flow behavior of Q345E alloy steel
3.3.1 Modeling of constitutive equation
Arrhenius equation was utilized in this work to represent the relationship between flow stress and temperature as well as strain rate during hot compression [16, 17]. The effect of the temperature and strain rate on the deformation behaviors can be formulated by Zener-Hollomon parameter Z, in an exponent-type equation as shown in following Eq.(9) and the relationship between the flow stress and strain rate is shown in Eq. (10) [18-20].
 (9)
(9)
 (10)
(10)
where  is strain rate (s-1); �� is flow stress (MPa); Q is activation energy of hot deformation (kJ/mol); R is the gas constant (8.314 J/(mol��K)); T is the deformation temperature (K); A is the materials constant.
For all stress levels, the hyperbolic law in Arrhenius type equation, shown in Eq. (11), give better approximations between Zener-Hollomon parameter and flow stress [21-23]. Substituting Eq. (10) into Eq. (11) gives Eq. (12) and then substituting Eq. (12) into Eq. (9) gives Eq. (13).
 (11)
(11)
 (12)
(12)
 (13)
(13)
where �� and n are materials constants.
By solving Eqs. (9) and (13), the flow stress can be written as a function of Z parameter as
 (14)
(14)
It can be concluded from the proposed constitutive equation shown in Eq. (14) that the flow stress is determined by the temperature compensation strain rate factor Z, materials constant A and �� as well as the materials stress index n. It is acknowledged that the materials constants Z, A, �� and n will be changed because of the microstructure evolution of the materials during hot deformation process. There exists a functional relationship between the deformation strains and the material constants of the constitutive equation. Hence, by formulating the relationship between materials constants and deformation strain during hot deformation process, the relationship between true stress and true strain can be predicted by the proposed constitutive equation. The solution procedure for material constants under the deformation strain of 0.1 will be demonstrated as follows [24-27].
For the low stress level (����<0.8), F(��)=��n; For the high stress level (����>1.2), F(��)=exp(�¦�). Substituting the two equations of F(��) into Eq. (10) gives Eqs. (15) and (16), respectively.
 ����<0.8 (15)
 , ����>1.2 (16)
where m1, m2 and �� are material constants; m1 and m2 have nothing to do with the deformation temperature; ��=��/n.
Taking the logarithm of both sides of Eqs. (15) and (16), respectively, gives:
 (17)
(17)
 (18)
(18)
By substituting the values of the flow stress and corresponding strain rate under the strain of 0.1 into Eqs. (17) and (18), they give the relationship between flow stress and strain rate. Figures 14(a) and (b) show  and
and  plots under different deformation temperatures respectively. n and �� can be calculated from the slope of the lines in and plots, respectively. The slopes of the lines under different temperatures are approximately the same; n and �� can be obtained by linear fitting method and the mean values of n and �� were computed as 8.62329151 and 0.116575048, respectively. ��=��/n=0.013518625.
Taking the logarithm of both sides of Eq. (12) gives:

 (19)
(19)
Figure 14(c) shows a group of parallel and straight lines representing the relationship between 1/T and ln[sinh(����)] at different strain rates. Q can be evaluated as 489.207 kJ/mol by averaging the values of slope in the plot of 1/T- ln[sinh(����)].
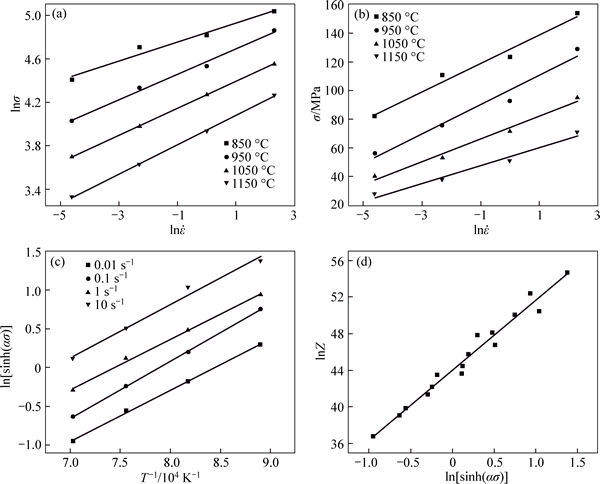
Fig. 14 Relationship between and ln�� (a), and �� (b), 1/T and ln[sinh(����)] (c) and ln[sinh(����)] and lnZ (d)
Taking the logarithm of both sides of Eq. (13) yields:
lnZ=nln[sinh(����)]+lnA (20)
It can be concluded from Eq. (20) that the value of lnA is the intercept of the plot ln[sinh(����)]-lnZ. By substituting the values of the experimental results under the strain of 0.1, relationship between ln[sinh(����)] and lnZ was obtained as shown in Fig. 14(d). Then, material constant A under the strain of 0.1 was calculated as 1.31217��19 s-1.
Using the same procedure, the values of material constants (��, Q, lnA, n) of the constitutive equations were computed under different deformation strains within the range of 0.05 to 0.7 and the interval of 0.05. The relationships between ��, Q, lnA, n and true strain for Q345E steel (shown in Fig. 15) can be polynomial fitted by the compensation of strain, as shown in Eq.(21). The polynomial fit results of ��, Q, lnA, n of Q345E steel are provided in Table 2.
 (21)
(21)
3.3.2 Modification and verification of constitutive equation
To verify the constitutive equation of Q345E steel, comparison between the predicted and experimental results was carried out. By applying the calculated material constants of the constitutive equation, the flow- stress values were predicted under different deformation temperatures 850, 950, 1050 and 1150 ��C with strain rates of 0.01, 0.1, 1 and 10 s-1. Figure 16 shows the detailed comparison between predicted and experimental flow stress curves of Q345E under strain rates of 0.01, 0.1, 1 and 10 s-1. It can be found in Fig. 16(c) that the predicted flow stress of Q345E steel shows a very good agreement with the experimental value at strain rate of 1 s-1. And it can be seen in Figs. 16(a) and (b) that the predicted flow stress values are larger than the experimental values at strain rates of 0.01 and 0.1 s-1 except for few data. Figure 16(d) suggests that the predicted flow stress value is smaller than the experimental value at strain rate of 10 s-1. Therefore, to increase the accuracy of the constitutive equation, the constitutive equation needs to be modified by compensation of strain rate.
By multiplying both sides of Eq. (9) by  then the modified Zener-Hollomon parameter Z�� can be expressed as Eq. (22) and the modified constitutive equation of Q345E steel can be formulated as shown in Eq. (23).
 (22)
(22)
 (23)
(23)
Figure 17 shows the comparison between the experimental and predicted flow stress values by the modified constitutive equation of Q345E steel (considering the compensation of both strain and strain rate) under different deformation temperatures 850, 950, 1050 and 1150 ��C with strain rates of 0.01, 0.1, 1 and 10 s-1. It can be seen in Fig. 17 that the predicted flow stress values agree well with the experimental flow stress values.
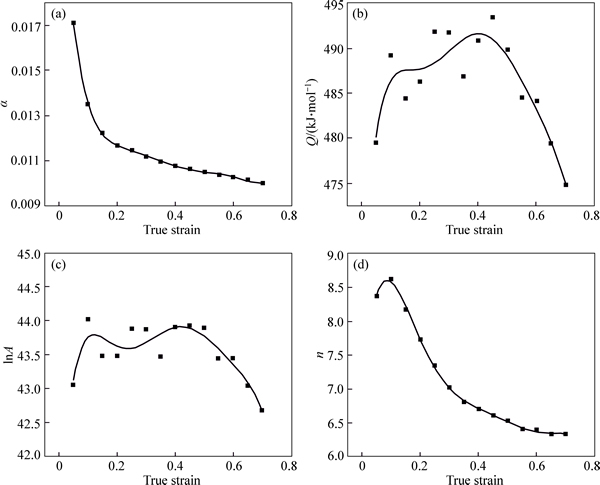
Fig. 15 Relationship between ��(a), Q (b), lnA (c) and n (d) and true strain by polynomial fit of Q345E steel
Table 2 Polynomial fitting results of ��, Q, lnA and n of Q345E steel
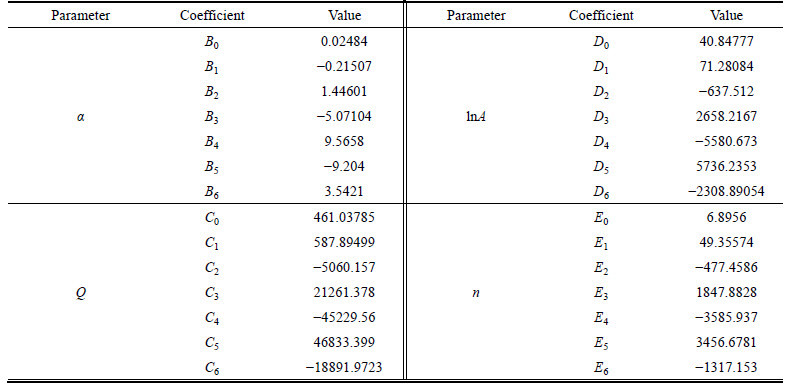
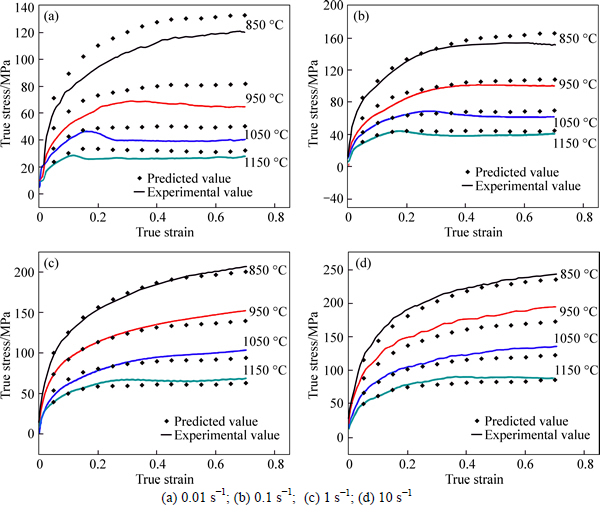
Fig. 16 Comparison between predicted and experimental flow stress curves of Q345E steel under strain rates:
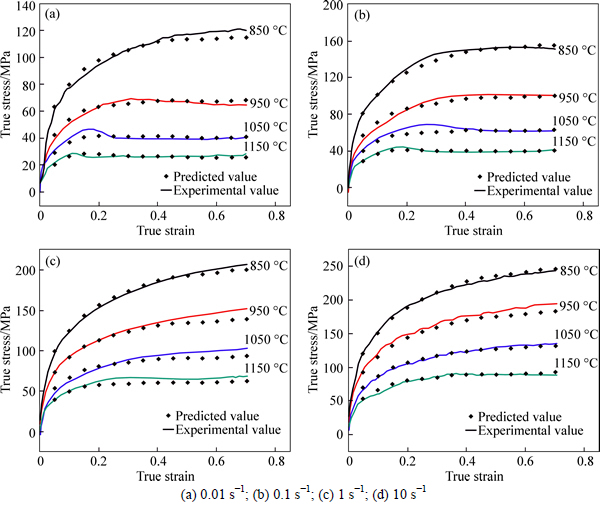
Fig. 17 Comparison between predicted flow stress values by modified constitutive equation and experimental flow stress curves of Q345E steel under strain rates:
In order to evaluate the accuracy of the deformation constitutive equation, the error between the predicted flow stress value (��p) and experimental flow stress value (��e) was calculated as the following equation:
 (24)
(24)
By calculation, the mean predictive error of the modified constitutive equation is 0.066%, -1.812%, -3.429% and -0.845% for the strain rate of 0.01 s-1, 0.1 s-1, 1 s-1 , 10 s-1, respectively. The results indicate that the flow stress values predicted by the modified constitutive equation agree well with the experimental values, which confirms the accuracy and reliability of the modified deformation constitutive equation of Q345E steel.
4 Conclusions
1) The true stress-strain curves of Q345E under different deformation temperatures 850, 950, 1050 and 1150 ��C with strain rates of 0.01, 0.1, 1 and 10 s-1 are obtained, which indicate that the increase in deformation temperature and decrease in strain rate promote the dynamic softening and lead to a increase in the stress level of Q345E during hot compressive process.
2) The developed kinetic model of DRX provides a method of quantitatively predicting the dynamic softening degree and the optical microstructures under different deformation temperatures and strain rates verify the relationship between dynamic softening degree and deformation conditions.
3) The constitutive model for flow stress of Q345E under elevated temperature is established by utilizing Arrhenius equation and the modified Zener-Hollomon parameter considering the compensation of both strain and strain rate, which can accurately predict the flow stress under different deformation conditions during the hot compression process.
References
[1] ZHANG Wen-juan, HAO Peng-fei, LIU Yong, SHU Xue-feng. Determination of the dynamic response of Q345 steel materials by using SHPB [J]. Procedia Engineering, 2011, 24: 773-777.
[2] YU Wen-jian, ZHAO Jin-cheng, SHI Jian-yong. Dynamic mechanical behaviour of Q345 steel at elevated temperatures: Experimental study [J]. Materials at High Temperatures, 2011, 27: 285-293.
[3] LIN Yong-cheng, CHEN Ming-song, ZHONG Jue. Study of static recrystallization kinetics in a low alloy steel [J]. Computational Materials Science, 2008, 44: 316-321.
[4] LI Wei, LI Hai, WANG Zhi-xiu, ZHENG Zi-qiao. Constitutive equations for high temperature flow stress prediction of Al�C14Cu�C7Ce alloy [J]. Materials Science and Engineering A, 2011, 528: 4098-4103.
[5] LIANG Hou-quan, GUO Hong-zhen, NAN Yang, QIN Chun, PENG Xiao-na, ZHANG Jing-li. The construction of constitutive model and identification of dynamic softening mechanism of high-temperature deformation of Ti�C5Al�C5Mo�C5V�C1Cr�C1Fe alloy [J]. Materials Science and Engineering A, 2014, 615: 42-50.
[6] YIN Fei, HUA Lin, MAO Hua-jie, HAN Xing-hui. Constitutive modeling for flow behavior of GCr15 steel under hot compression experiments [J]. Materials & Design, 2013, 43: 393-401.
[7] FENG D, ZHANG X M, LIU S D, DENG Y L. Constitutive equation and hot deformation behavior of homogenized Al�C7.68Zn�C2.12Mg�C 1.98Cu�C0.12Zr alloy during compression at elevated temperature [J]. Materials Science and Engineering A, 2014, 608: 63-72.
[8] BHATTACHARYA R, LAN Y J, WYNNEA B P, DAVISD B, RAINFORTH W M. Constitutive equations of flow stress of magnesium AZ31 under dynamically recrystallizing conditions [J]. Journal of Materials Processing Technology, 2014, 214: 1408-1417.
[9] CHENG Liang, XUE Xiang-yi, TANG Bin, KOU Hong-chao, LI Jin-shan. Flow characteristics and constitutive modeling for elevated temperature deformation of a high Nb containing TiAl alloy [J]. Intermetallics, 2014; 49: 23-28.
[10] GUPTA A K, ANIRUDH V K, SINGH S K. Constitutive models to predict flow stress in austenitic stainless steel 316 at elevated temperatures [J]. Materials & Design, 2013, 43: 410-418.
[11] LI Hong-ying, LI Yang-hua, WANG Xiao-feng, LIU Jiao-jiao, WU Yue. A comparative study on modified johnson cook, modified zerilli�Carmstrong and arrhenius-type constitutive models to predict the hot deformation behavior in 28CrMnMoV steel [J]. Materials & Design, 2013, 49: 493-501.
[12] WANG Meng-han, LI Yu-feng, WANG Wen-hao, ZHOU Jie, CHIBA A. Quantitative analysis of work hardening and dynamic softening behavior of low carbon alloy steel based on the flow stress [J]. Materials & Design, 2013, 45: 384-392.
[13] QUAN Guo-zhen, MAO An,LUO Gui-chang,LIANG Jian- ting,WU Dong-sen,ZHOU Jie. Constitutive modeling for the dynamic recrystallization kinetics of as-extruded 3Cr20Ni10W2 heat-resistant alloy based on stress�Cstrain data [J]. Materials & Design, 2013, 52: 98-107.
[14] LIU Y G, LI M Q, LUO J. The modelling of dynamic recrystallization in the isothermal compression of 300M steel [J]. Materials Science and Engineering A, 2013, 574: 1-8
[15] XU Yan, HU Lian-xi, SUN Yu. Deformation behaviour and dynamic recrystallization of AZ61 magnesium alloy [J]. Journal of Alloys and Compounds, 2013, 580: 262-269.
[16] XIAO Yan-hong, GUO Cheng, GUO Xiao-yan. Constitutive modeling of hot deformation bahavior of H62 brass [J]. Materials Science and Engineering A, 2011, 528: 6510-6518.
[17] HAGHDADI N, ZAREI-HANZAKI A, ABEDI H R. The flow behavior modeling of cast A356 aluminum alloy at elevated temperatures considering the effect of strain [J]. Materials Science and Engineering A, 2012, 535: 252-257.
[18] WU Horng-yu, YANG Jie-chen, ZHU Feng-jun, WU Chen-tao. Hot compressive flow stress modeling of homogenized AZ61 Mg alloy using strain-dependent constitutive equations [J]. Materials Science and Engineering A, 2013, 574: 17-24.
[19] WU B, LI M Q, MA D W. The flow behavior and constitutive equations in isothermal compression of 7050 aluminum alloy [J]. Materials Science and Engineering A, 2012, 542: 79-87.
[20] NING Yong-quan, YAO Ze-kun, LIANG Xin-min, LIU Yan-hui. Flow behavior and constitutive model for Ni�C20.0Cr�C2.5Ti�C1.5Nb�C 1.0Al superalloy compressed below �á�-transus temperature [J]. Materials Science and Engineering A, 2012, 551: 7-12.
[21] LIAO Ching-hao, WU Horng-yu, LEE S, ZHU Feng-jue, LIU Hsu-cheng, WU Cheng-tao. Strain-dependent constitutive analysis of extruded AZ61 Mg alloy under hot compression [J]. Materials Science and Engineering A, 2013, 565: 1-8.
[22] REZAEI ASHTIANI H R, PARSA M H, BISADI H. Constitutive equations for elevated temperature flow behavior of commercial purity aluminum [J]. Materials Science and Engineering A, 2012, 545: 61-67.
[23] XIAO Yan-hong, GUO Cheng. Constitutive modelling for high temperature behavior of 1Cr12Ni3Mo2VNbN martensitic steel [J]. Materials Science and Engineering A, 2011, 528: 5081-5087.
[24] WANG Zhen-jun, QI Le-hua, ZHOU Ji-ming, GUAN Jun-tao, LIU Jian. A constitutive model for predicting flow stress of Al18B4O33w/AZ91D composite during hot compression and its validation [J]. Computational Materials Science, 2011, 50: 2422-2426.
[25] HE An, CHEN Lin, HU Sheng, WANG Can, HUANGFU Le-xiao. Constitutive analysis to predict high temperature flow stress in 20CrMo continuous casting billet [J]. Materials & Design, 2013, 46: 54-60.
[26] LI Hong-ying, LI Yang-hua, WEI Dong-dong, LIU Jiao-jiao, WANG Xiao-feng. Constitutive equation to predict elevated temperature flow stress of V150 grade oil casing steel [J]. Materials Science and Engineering A, 2011, 530: 367-372.
[27] HAN Ying, QIAO Guan-jun, SUN Yu, ZOU De-ning. Modeling the constitutive relationship of Cr20Ni25Mo4Cu superaustenitic stainless steel during elevated temperature [J]. Materials Science and Engineering A, 2012, 539: 61-67.
(Edited by YANG Hua)
Cite this article as: QIAN Dong-sheng, PENG Ya-ya, DENG Jia-dong. Hot deformation behavior and constitutive modeling of Q345E alloy steel under hot compression [J]. Journal of Central South University, 2017, 24(2): 284-295. DOI: 10.1007/s11171-017-3429-0.
Foundation item: Project(51135007) supported by the National Natural Science Foundation of China; Project(IRT13087) supported by the Innovative Research Team Development Program of Ministry of Education of China; Project(2012-86) supported by the High-end Talent Leading Program of Hubei Province, China; Project(2012-P08) supported by State Key Laboratory of Materials Processing and Die & Mould Technology, China
Received date: 2015-09-21; Accepted date: 2016-05-11
Corresponding author: QIAN Dong-sheng, PhD; Tel: +86-27-87168391; E-mail: qiands@whut.edu.cn

