
Optimization of image capturing method of wear particles for condition diagnosis of machine parts
Yon-Sang CHO, Heung-Sik PARK
Department of Materials Engineering, Dong-A University, Hadandong 840, Busan, Korea
Received 2 March 2009; accepted 30 May 2009
Abstract: Wear particles are inevitably occurred from moving parts, such as a piston-cylinder made from steel or hybrid materials. And a durability of these parts must be evaluated. The wear particle analysis has been known as a very effective method to foreknow and decide a moving situation and a damage of machine parts by using the digital computer image processing. But it is not laid down to calculate shape parameters of wear particle and wear volume. In order to apply image processing method in a durability evaluation of machine parts, it needs to verify the reliability of the calculated data by the image processing and to lay down the number of images and the amount of wear particles in one image. In this work, the lubricated friction experiment was carried out in order to establish the optimum image capture with the 1045 specimen under experiment condition. The wear particle data were calculated differently according to the number of image and the amount of wear particle in one image. The results show that capturing conditions need to be more than 140 wear particles in one image and over 40 images for the reliable data. Thus, the capturing method of wear particles images was optimized for condition diagnosis of machine moving parts.
Key words: wear particle; shape parameter; image processing; condition monitoring
1 Introduction
The image processing[1] can be effectively applied to foreknowledge and decision of operating conditions for a diagnosis of machine systems such as hydraulic systems, transmissions and reductions made from steel or hybrid materials through an analysis of characteristics of occurred wear particles which are calculated quantitatively[2-7]. But the wear particle analysis has been only suggested an ability of applying for a diagnosis of machine systems[8-11], and cannot be confident because the method of taking statistics on the group of shape parameters of wear particles and wear volumes[12-14] is not laid down clearly. Thus, in order to apply image processing method in the foreknowledge and decision of lubricated operating condition, it needs to verify the reliability of the calculated data by the image processing and to lay down clearly the method of taking a group of wear particles such as the number of captured images and the amount of wear particles in one image.
In this work, the lubricated friction experiment was carried out with the 1045 specimen in order to establish the optimum method of taking a group of wear particles, and according to the number of image and the amount of wear particle in one image, the shape parameters of wear particles and the wear volumes were calculated, and with research of the those variations, the reliability analysis method of wear particles would be laid down for a diagnosis of machine systems.
2 Experimental
2.1 Friction and wear test
In this work, lubrication tests were examined by ball on disk type friction-wear tester, as shown in Fig.1. Lubricant (Shell Tonna Oil T68) was dropped on the contact point of specimens by lubricating system as oil bath, variable flow rotary pump and silicon tube with 3.175 mm in inner diameter. The 1045 specimens for an examination were manufactured by cutting disk block with 50 mm in diameter and 10 mm in width, and were polished with Rmax of 0.2 μm in surface roughness by an emery paper #1 200. The opponent ball specimens were alumina ceramics (Al2O3) with 99.7% in purity and 5 mm in diameter. An applied contact load was 29.4 N and a sliding speed was 2.83 m/min at contact point in examination condition.
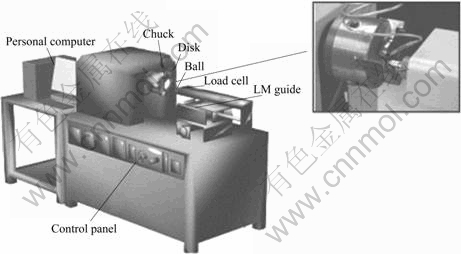
Fig.1 Schematic diagram of ball on disk type wear tester
Lubricant from the examination was melted with normal hexane. Wear particles in melted oil were filtered through a membrane filter with pore size of 0.45 μm, and those shape parameters were calculated by digital image processing system.
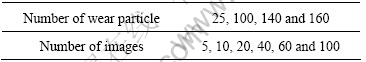
Table 1 shows the condition for wear particle image capture, in order to presume wear volumes and average values of shape parameters on number of captured images and wear particles. The number of wear particles in one image, on the average, set 25, 100, 140 and 160 particles taking out by adjusting the filtering amount of melted oil. And 5, 10, 20, 40, 60 and 100 images of wear particle were captured for image processing at random.
Table 1 Condition for image capture for wear particle
2.2 Computer image processing
Digital image processing system is made with an optical microscope and a computer system as shown in Fig.2. The optical microscope has a transmitted halogen lamp and a digital camera on the objective lens of 40 magnifications. And the captured images of wear particles are saved in computer.
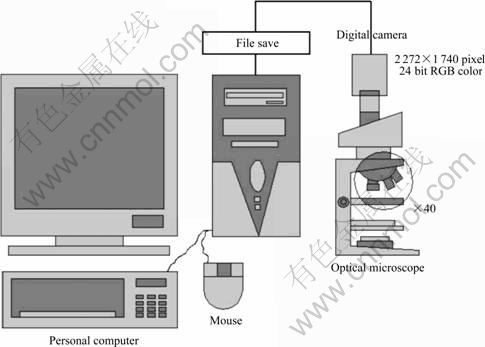
Fig.2 Schematic diagram of image processing system
The digital camera for this research has 2 272×1 704 pixels with 24bit RGB color level per one pixel. And the length of a side of square pixel is 0.020 5 μm. The shape parameters of wear particles, such as perimeter, area, diameter, roundness shown in Fig.3 and counting number, are calculated with the image processing program made by ourselves with Visual C++ language. Wear volume is defined with the sum of the cube of diameter.
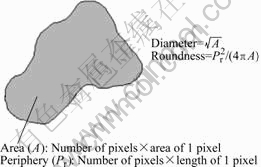
Fig.3 Shape parameters of a wear particle
3 Results and discussion
3.1 Diameter of wear particle
Variation of average value of diameter on the number of images can be got as good as average value when images of wear particles have several numbers. Fig.4 shows this variation, when the average number of wear particles is 140. In this work, average diameter becomes stabilized over the 40 images, and can be trusted. So, in order to analyze the size of wear particle, it needs to capture over 40 images.
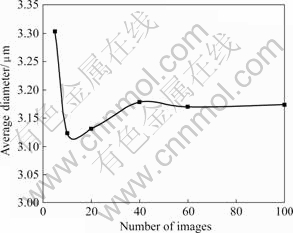
Fig.4 Variation of average diameter on number of images
Average diameters are also different on the number f wear particle distributed in an image as well as the number of images. The average diameter on the number of wear particles has a great change as the average value cannot be determined under the 20 images, as shown in Fig.5. But over the 40 images, those variations have a similar tendency, and over the 140 wear particles, diameters are alike.
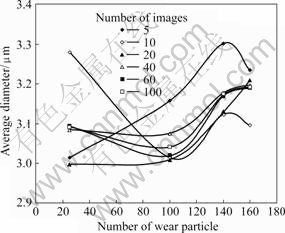
Fig.5 Variation of average diameter on number of wear particle
In these results, in order to calculate a reliable average diameter of wear particle, it needs to take out melted oil so as to be over about 140 wear particles in an image. And it needs to process at least over 40 images of wear particle.
3.2 Roundness of wear particles
Roundness means the complexity of shape characteristics of wear particle which is a more circle as roundness value is nearly 1.0, and which is a stranger shape as the value is larger.
Fig.6 shows the variation of average roundness to be calculated for all wear particles on the number of
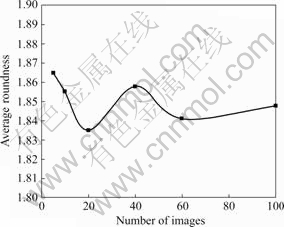
Fig.6 Variation of average roundness of wear particles on number of images
images. The number of particles is about 140 in one image. In this work, even if the many images are used, the average values are not converged, and are changed widely. This result is known that an image capturing equipment has a limit of resolution and roundness of small particle has errors which are occurred to calculate a perimeter and area of particle by using a digital computer. Thus, in order to get the stable average value of roundness, it needs to use mainly the big size wear particles.
In this work, the roundness was calculated with the wear particles over 3 μm in diameter. Fig.7 shows the variation of this average roundness on the number of images. In Fig.7, when images are more than 20, the values of roundness are converged unlike the variations of the calculated average roundness with all particles. Therefore, in order to analyze variations of wear particle roundness, it needs to capture at least 20 images and it is effective to analyze the roundness characteristics with the big size particles.
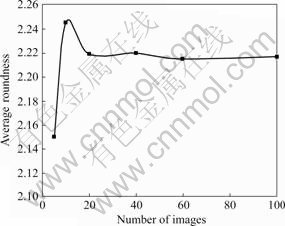
Fig.7 Variation of average roundness of wear particles over 3 μm on number of images
Figs.8 and 9 show the variations of average roundness on the average number of wear particles inone image. The variations of average roundness in Fig.8 which were calculated with all wear particles are not converged over all, and when the number of particles is about 160, the average values are lower than others. These results are considered that the errors are larger as the particles sizes are smaller and small particles are distributed a lot as the number of particles are over 160. This is due to the fact that, as mentioned above, a digital image capturing equipment has a limit of resolution.
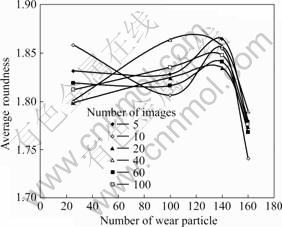
Fig.8 Variation of average roundness of wear particles on number of wear particle in one image
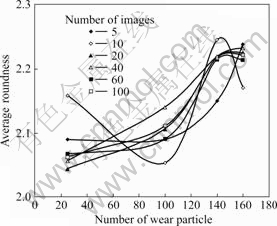
Fig.9 Variation of average roundness of wear particles over 3 μm on number of wear particle in one image
The variations of average roundness in Fig.9 are described with bigger than 3 μm particles in diameter. In this work, those variations appear similarly when the images are lager than 20 and the average roundness are about the same values over 140 wear particles.
Thus, in order to get a reliable average roundness of wear particles, it needs to calculate with relatively big particles over 3 μm in diameter, and to do a image processing for more than 20 images with particles which are about over 140 in one image.
3.3 Presumed wear volume
Generally, image processing on wear particles also intends to presume a wear volume. Fig.10 shows the variations of presumed wear volumes on the number of images and the average number of wear particles in one image. In this work, the presumed values converge stably over 40 images, but when particles in one image are about 25, the presumed values are low over all. If wear particles cannot be took out sufficiently, it seems that presumed wear volume cannot be trusted because the number of particles is very few.
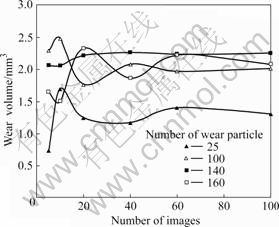
Fig.10 Relationship between wear volumes and number of images
When the number of wear particles is about 100, presumed wear volumes are similar in over 40 images of particles. And when the number of particles is more than 140, to presume volumes, the images of wear particles have need of at least 20 images.
4 Conclusions
In this work, the lubricated friction experiment was carried out with 1045 specimen in order to establish the standard method of image processing of wear particles. The average shape parameters, such as diameter and roundness, were calculated differently according to the number of image and the amount of wear particle in one image, and these variations were analyzed. As a result, the following conclusions were come out.
1) An average diameter of wear particles can be trusted when the number of particles is over 140 wear particles in one image and the number of particle images is at least over 40 images.
2) A reliable roundness of wear particle needs to capture at least 20 images and it is effective to analyze the roundness characteristics with the big size particles.
3) In order to presume volumes, the images of wear particles have need of over 40 images of particles in the case of about 100 particles in one image and at least 20 images in the case of more than 140 particles.
4) When the number of wear particles is more than 140 in one image and the number of particle images is over 40 images, it can be trusted that all the average data of shape parameters and wear volumes are calculated by digital image processing.
References
[1] GONZALEZ R C. Digital image processing [M]. New York: Addison-Wesley Pub, 1993.
[2] SATO T, IKEDA O, HATSUZAWA T, LINZER M. Real time evaluation of wear particle using electro forced rotation and laser scattering [J]. Wear, 1987, 15: 273-285.
[3] UEDELHOVEN W, FRANZL M. The use of automated image analysis for the study of wear particles in oil-lubricated tribological system [J]. Wear, 1991, 142: 107-113.
[4] ROYLANCE B J, ALBIDEWI I A, LAGHARI M S. Computer- aided vision engineering (cave)-quantification of wear particle morphology [J]. Lubr Eng, 1993, 50: 111-116.
[5] ROYLANCE B J, RAADNUI S. The morphological attributes of wear particles―Their role in identifying wear mechanisms [J]. Wear, 1994, 175: 115-121.
[6] HUNT T. Condition monitoring of mechanical and plant [M]. New York: Chapman & Hall, 1995: 48-53.
[7] THOMAS D H, DAVIES T, LUXMOORE A R. Computer image analysis for identification of wear particles [J]. Wear, 1991, 142: 213-226
[8] KIRR T B, PANZERA D, XU Z L. Computer image analysis of wear debris for machine condition monitoring and fault diagnosis [J]. Wear, 1995, 181: 717-722.
[9] SHIBATA M. Tribological characteristics and diagnosis of deteriorated lubricating oil [J]. JAST, 1994, 39(7): 559-565.
[10] AHN H S. Diagnosis of machine conditions using analysis of friction, wear and wear debris [J]. Journal of the KSME, 1992, 32(11): 917-926.
[11] KWON O K, KONG H S, KWON C H, OH P K. Condition monitoring techniques of an internal combustion engine [J]. Tribology International, 1987, 20(3): 153-159.
[12] SEO Y B, PARK H S, JUN T O. Analysis of wear debris for machine condition diagnosis of the lubricated moving surface [J]. Journal of the KSME, 1997, 21(5): 835-841.
[13] PARK H S, CHO Y S, BAE H J, LEE S J. Estimation of damage condition for the automobile transmission gear by morphological analysis of wear debris [J]. Journal of the KSTLE, 2001, 17(1): 16-21.
[14] CHO Y S, LYU M R, KIM D H, PARK H S. Application of fractal parameter for morphological analysis of wear particle [J]. Journal of the KSTLE, 2002, 18(2): 147-152.
Foundation item: Project supported by Research Funds from Dong-A University, Korea
Corresponding author: Heung-Sik PARK; Tel: +82-51-200-7653; E-mail: parkhs@dau.ac.kr
(Edited by YANG You-ping)

