Trans. Nonferrous Met. Soc. China 24(2014) 729-735
Crystallization kinetics and temperature dependence of energy storage properties of niobate glass-ceramics
Tao-yong LIU1, Guo-hua CHEN1,2, Jun SONG1, Chang-lai YUAN1,2
1. School of Materials Science and Engineering, Guilin University of Electronic Technology, Guilin 541004, China;
2. Guangxi Key Laboratory of Information Materials, Guilin University of Electronic Technology, Guilin 541004, China
Received 14 March 2013; accepted 12 September 2013
Abstract: Glass-ceramic materials of strontium barium niobate system were prepared through a melt-quenching method. The effects of crystallization temperature on the microstructure, dielectric property, breakdown strength and energy storage density of barium strontium niobate glass-ceramics were studied. The crystallization mechanism of the glass-ceramics was discussed and should be one-dimensional interfacial growth. The results indicate that the breakdown strength remarkably increases with the increase of crystallization temperature. The glass-ceramic heat treated at 900 ��C was found to possess optimal properties with breakdown strength of 1300 kV/cm and energy storage density of 2.8 J/cm3, which is promising dielectric materials for high energy storage density dielectrics.
Key words: glass-ceramics; dielectrics; crystallization; electrical properties
1 Introduction
With the development of the pulse power technology, the capacitors are required to have high energy storage density [1,2]. Among the dielectric materials available, the ferroelectric glass-ceramics are considered the most promising candidates, owing to the synergistic effect of high dielectric constant (from the precipitated crystalline phases) and high breakdown strength (due to the pore-free nature of the residual glass) [3-6]. Because the energy storage density is determined by the product of dielectric constant and breakdown strength squared, improvements in dielectric constant and breakdown strength have a more pronounced effect on the energy storage density [7].
Recently, many types of glass-ceramics containing ferroelectric phase such as strontium barium titanate (BST) and strontium barium niobate (SBN) [8,9] have been reported. Most current glass-ceramics systems for high energy storage are based on silicate glass system, which often need to be melted above 1500 ��C. It is found that the addition of Na2O, PbO, BaF2 and CeO2 in silicate glass systems could reduce the melting temperature and improve the dielectric properties [7,10-12]. Additionally, the earlier works have found that the dielectric constant of the glass-ceramics was highly affected by the heat treatment temperature. SHYU and CHEN [13] reported the influence of sintering temperature on crystallization, dielectric and ferroelectric properties of the BaO-SrO- TiO2-Al2O3-SiO2 glass-ceramics. CHEN and ZHANG [14] found that heat treatment temperature was the main contribution to the optimized energy density of the Na2O-SrO-BaO-Nb2O5-B2O3-SiO2 glass-ceramics. As far as we know, there are few studies of the crystallization mechanism and the effects of crystallization temperature on dielectric properties in SrO-BaO-Nb2O5-B2O3-SiO2 glass-ceramics.
In this work, the glass-ceramics of SrO-BaO- Nb2O5-B2O3-SiO2 system are prepared by conventional melt casting followed by controlled crystallization. The crystallization mechanism is discussed, and the phase evolution, microstructure, dielectric properties, P-E hysteresis loops and energy storage density as a function of crystallization temperature are investigated.
2 Experimental
Powders of analytical reagent grade, comprising BaCO3 (>99.5%), Sr2CO3 (>99.5%), Nb2O5 (>99.5%), H3BO3 (>99.5%) and SiO2 (>99.0%), were used as the starting materials. The nominal composition of the starting glass was 21BaO-21SrO-18Nb2O5-30SiO2- 10B2O3 (mole fraction, %). The glass-ceramics were prepared by mixing the respective oxide powders and melting them in a corundum crucible in air at 1450 ��C for 1 h. The melt was quickly removed from the furnace, poured onto pre-heated copper plate and pressed to form glass sheets with a thickness of about 2 mm. Then, the as-quenched glasses were annealed at 600 ��C for 10 h to remove residual stresses and furnace-cooled to room temperature. Glass-ceramics were formed by heat treating these glasses in air at 800, 830, 850 and 900 ��C, respectively, for 2 h with a heating rate of 3.5 ��C/min based on differential thermal analysis (DTA).
The glass crystallization temperatures were determined by differential thermal analyses (Model STA-449-F3-Jupiter, Netzsch). Approximately 10 mg of ground glass was used for DTA measurement from 200 to 900 ��C at a rate of 10 ��C/min in air. Each sample was examined by various heating rates (5, 10, 15, and 20 ��C/min). The activation energy (E) and Avrami exponent (n) were calculated according to the data of DTA. Glass-ceramics were examined by X-ray diffraction diffractometer (XRD) (Model D8-Advance, Bruker) at room temperature to investigate the phase evolution. The microstructure of these crystallized samples was analyzed by scanning electron microscopy (SEM, Model JSM 5610LV, JEOL). For electrical measurements, these samples were polished to achieve parallel and smooth faces, and silver electrodes were sputtered on both faces. The frequency dependencies of relative dielectric constant and dielectric loss tangent were measured using a precision multifunction LCR meter (Model HP4292A, Agilent) at room temperature. For dielectric breakdown strength (BDS) measurements, a DC field load was applied to the sample with 0.08-0.10 mm thickness in silicon oil using a high voltage power source (Model MARX, Tianjin Dongwen Company, China). A DC voltage ramp of about 1 kV/s was applied to the specimens until dielectric breakdown. The point where a spike in current was observed was used to identify the dielectric breakdown. At least 10 specimens were used for each composition during BDS testing.
3 Results
3.1 Phase evolution and microstructure
The XRD patterns of the samples prepared at different treatment temperatures are shown in Fig. 1. From Fig. 1, a broad dispersion peak is seen for the as-quenched glass. There are two distinct crystalline phases for samples crystallized at temperatures between 800 and 900 ��C. Figure 2 shows the SEM images of the glass-ceramic heat treated at different temperatures. The microstructures of the glass-ceramics vary with the crystallization temperature. It can be seen that the pores and un-uniform microstructure are observed clearly in Fig. 2(a). With the increase of temperature, the microstructure of the glass-ceramics becomes dense, as shown in Figs. 2(b) and (c). Typically, the glass-ceramic heated at 900 ��C shows a uniform and dense microstructure (Fig. 2(d)).
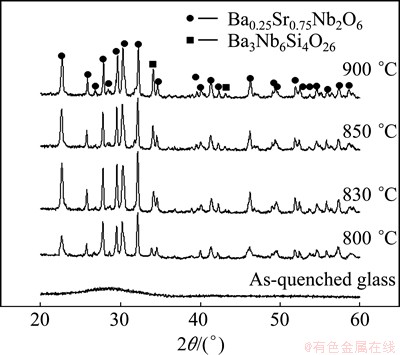
Fig. 1 XRD patterns of glass and glass-ceramics prepared at different temperatures
3.2 DTA analysis
DTA traces of the glasses heated at different heating rates ranging from 5 to 20 ��C/min are shown in Fig. 3(a). As shown in each curve, there are two distinct exothermic peaks indicating the presence of different crystalline phases, which is consistent with the XRD results in Fig. 1. With the increase of the heating rates, the peak crystallization temperatures (Tp1 and Tp2) move to a high temperature. The activation energies of crystallization, Ea1 and Ea2, determined from the Kissinger equation corresponding to the first and secondary crystallization exothermic peak are shown in Fig. 3(b).
3.3 Dielectric properties
The variation of the dielectric properties measured at room temperature as a function of frequency is plotted in Fig. 4. As the crystallization temperature increases from 800 to 900 ��C, the dielectric constant first increases and then decreases. The sample heated at 830 ��C shows a maximum dielectric permittivity (~42), as shown in Fig. 4(a). With the increase of crystallization temperature, the dielectric loss decreases. The dielectric loss of the samples obviously decreases with the increase of the frequency, as shown in Fig. 4(b).
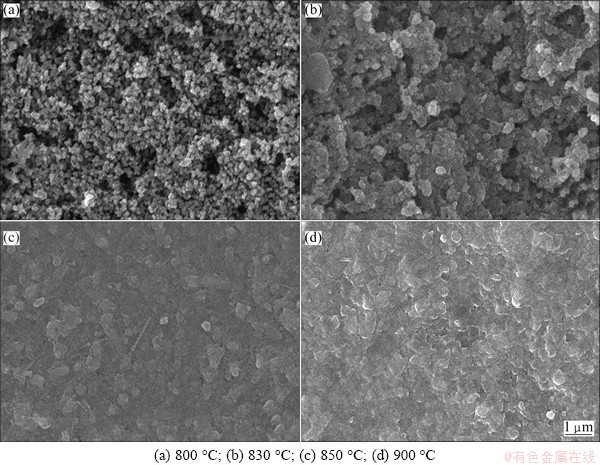
Fig. 2 SEM micrographs of glass-ceramics heat treated at different temperatures for 2 h
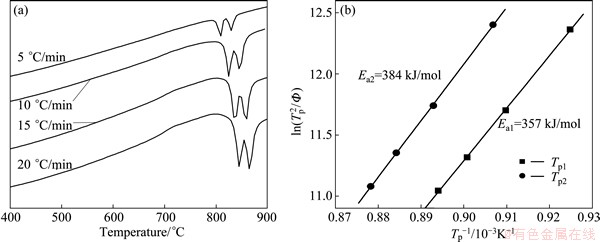
Fig. 3 DTA curves of glasses with different heating rates (a) and plot of  versus 1/Tp (b)
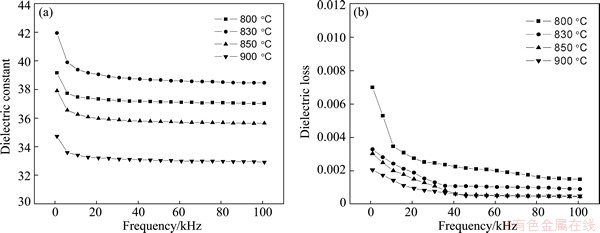
Fig. 4 Dielectric constant (a) and dielectric loss (b) as function of frequency for different crystallization temperature
The Weibull distribution of the dielectric breakdown strength (BDS) for the glass-ceramics heat treated at various temperatures is show in Fig. 5(a). This statistical distribution is usually used to interpret the dielectric breakdown strength data using a variety of factors: intrinsic material factors like composition and bulk structure as well as extrinsic material factors like sample thickness, temperature, surface condition, ambient atmosphere [15]. The distribution is plotted by the two-parameter Weibull function [16], which are given by
Xi=ln Ei (1)
Yi=ln{-ln[1-i/(n+1)]} (2)
where Ei is the specific breakdown field of each specimen; n is the sum of specimens of each composition; i is the serial number of each specimen, which are arranged as follows:
E1��E2��E3�ܡ���Ei����En (3)
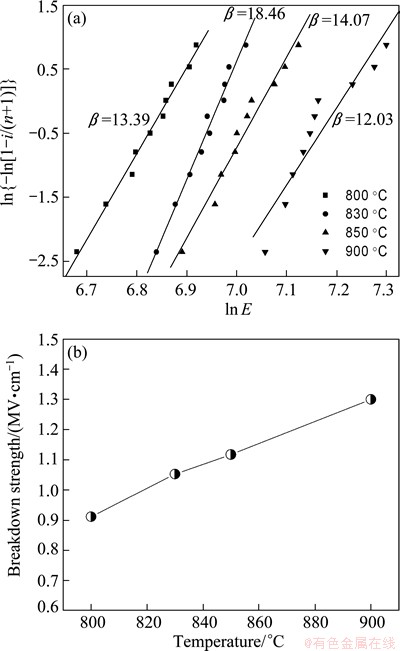
Fig. 5 Weibull plot indicating failure distribution of glass-ceramics heated at different temperatures (a) and average BDS as a function of crystallization temperature (b)
The two-parameter Weibull distribution function Yi (Xi) should be a line in the coordinate system. The slope of the line is the shape parameter ��, which is related to the range of the BDS. The intercept on the X-axis is ln ��, where �� is the scale parameter which can reflect the magnitude of the BDS. The value of the Weibull modulus �� was obtained by linear fitting of the experimental, as shown in Fig. 5(a). The greater the �� is, the more reliable the model would be [17]. As can be seen, all these �� values are bigger than 1 and all the plots show a relatively good linearity. The average BDS of the glass-ceramics as a function of crystallized temperature is shown in Fig. 5(b). From Fig. 5(b), it is observed that the average BDS is enhanced remarkably from 910 to 1300 kV/cm when the crystallized temperature is increased from 800 to 900 ��C.
The variation of the volume resistivity of the glass-ceramics as a function of crystallized temperature is shown in Fig. 6. The volume resistivity increases gradually with the increase of crystallization temperature. This variation in volume resistivity is consistent with that of the BDS.
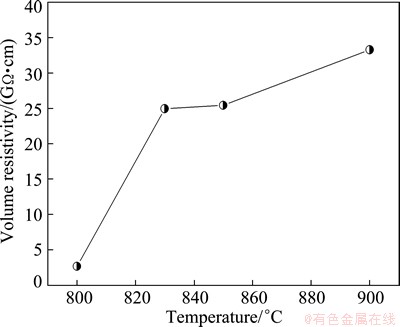
Fig. 6 Volume resistivity of glass-ceramics heated at various temperatures
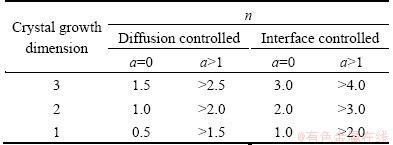
The P-E hysteresis loops of the glass-ceramics are shown in Fig. 7. It can be seen that all the samples exhibit almost a linear P-E relationship. It is noted that the polarization gradually increases firstly and then slightly decreases with the increase of crystallization temperature. Although the P-E characteristics do not nearly show any other clear ferroelectric behavior, the small remnant polarization is existent.
Because the remnant polarization is small and the hysteresis loops show a linear P-E relationship, the energy storage densities can be calculated using the formula as follows:
W=(��0��rEb2)/2 (4)
where W is the energy storage density (J/cm3); ��0 is the dielectric constant of free space (8.85��10-14 F/cm); ��r is the relative dielectric constant. The energy densities of the glass-ceramics heated at 800, 830, 850 and 900 ��C are 1.43, 2.21, 2.26 and 2.80 J/cm3, respectively.
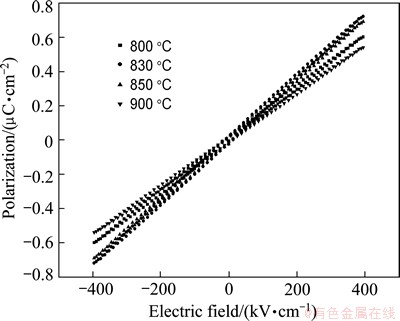
Fig. 7 Hysteresis plots (P-E) of glass-ceramics heated at various temperatures
4 Discussion
As shown in Fig. 1, the XRD patterns reveal the existence of two phases for all glass-ceramics. The primary phase could be identified as strontium barium niobate, Sr0.75Ba0.25 Nb2O6 (ICDD powder diffraction file card No. 72�C0284), with a tetragonal tungsten�Cbronze structure, denoted as SBN. The secondary phase is most likely correspond to the Ba3Nb6Si4O26. The variation of the strongest diffraction peaks of the SBN phase means that increasing crystallization temperature promotes the formation of SBN phase in the range of 800-830 ��C. However, further increase of crystallization suppresses the formation of SBN phase in the range of 850-900 ��C. Meanwhile, the diffraction peaks of the secondary phases become obvious and sharp as the crystallization temperature is increased. From the XRD and DTA results, it is inferred that the first crystallization peak (Tp1) corresponds to the formation of Sr0.75Ba0.25Nb2O6 and the second crystallization peak (Tp2) corresponds to the formation of Ba3Nb6Si4O26. SEM micrographs (Fig. 2) reveal that the increase of crystallization temperature improves the microstructures obviously. So, glass- ceramics with low porosity and dense microstructures could be obtained.
The activation energy of crystallization could be determined from the Kissinger equation [18]:
 (5)
(5)
where Tp is the temperature at which the maximum of the DTA crystallization exothermic peak is noted; �� is the heating rate; R is the gas constant; E is the activation energy for crystallization; and c is a constant. According to Eq. (5), a plot of versus 1/Tp yields a straight line in which the slopes are proportional to the activation energy of crystallization, as shown in Fig. 3(b). The activation energy Ea1 corresponding to the first crystallization exothermic peak is 357 kJ/mol and the activation energy Ea2 corresponding to the second crystallization exothermic peak is 384 kJ/mol, which is close to the dissociation energy of Si-O bonds in the glass system (386-430 kJ/mol) [19]. Other bonds in the glass system such as Ba-O, Sr-O and Nb-O [20] have much lower values for activation energy.
Additionally, the value of the Avrami exponent, n, can be determined from the DTA results by Ozawa��s equation [21]:
 (6)
(6)
where n is the Avrami parameter, and x is the volume fraction crystallized which is given as:
x=(A/A0) (7)
where A0 is the total area of the exotherm between the temperature Ti at which crystallization just begins and Tf at which the crystallization is completed; A is the area between Ti and T; �� is the heating rate. The slope of the plot of ln(-ln(1-x)) versus ln �� can be obtained from the above equation. Moreover, the Avrami exponent (n) is related to the mechanism (b) and crystal growth dimension (m) of transformation as listed in Table 1. Here, the Avrami exponent can be expressed as [20]
n=a+mb (8)
where a refers to the nucleation rate with a=0 for a zero nucleation rate, a=1 for a constant nucleation rate, a>1 for an increasing nucleation rate, and a<1 for a decreasing nucleation rate; b relates to the mechanism of growth with the value of 0.5 for a diffusion-controlled process and 1 for an interface controlled process. According to Eq. (6), the average values of n corresponding to the first and second crystallization exothermic peaks are 0.71 and 0.84, respectively. The activation energy corresponding to the first and second crystallization exothermic peaks is close to that of Si�CO bonds in the glass system (386-430 kJ/mol), which means the crystallization mechanism of the glass- ceramics should be one-dimensional interfacial growth.
Table 1 Values of Avrami exponent n for various crystallization mechanisms at zero and increasing nucleation rate
According to Fig. 4(a), the dielectric constant increases with the increase of crystallization temperature due to the formation of dielectric phase.
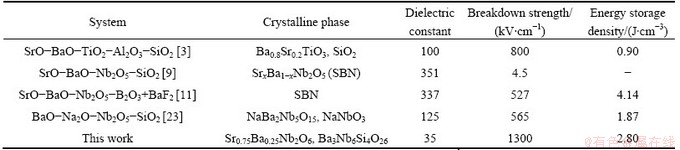
Table 2 Dielectric constant, breakdown strength, and energy storage density of some alternative glass-ceramics systems
However, further increase of the crystallization temperature leads to some decrease in the value of dielectric constant, which is mainly due to the increase of crystallinity degree for the secondary phase Ba3Nb6Si4O26. It is consistent with the variation of the XRD in Fig. 1. Meanwhile, the variation of dielectric constant for the glass-ceramics at low frequencies (<100 Hz) might be due to the relaxation polarization and space charge polarization contributing to the dielectric constant. As shown in Fig. 4(b), the dielectric loss gradually decreases with the increase of crystallization temperature, which might be caused by the formation of dense microstructure in Fig. 2.
As shown in Fig. 5(a), the BDS data of the glass-ceramic samples heated at different temperatures follow the two-parameter Weibull distribution and all the plots show a relatively good linearity. It is obviously found that the higher the crystallization temperature is, the bigger the value of BDS is. This variation of BDS is possibly due to the dense and uniform microstructure, as shown in Fig. 2. It can be seen that the observed pores might be the reason for low breakdown strength of the glass-ceramics at low crystallization temperature, as shown in Fig. 2(a), and pore-free nature might be the possible reason for moderately high breakdown voltages for higher crystallization temperature, as shown in Fig. 2(d).
There is an inverse relationship between the volume resistivity and the conductivity, one of them becomes larger as the other becomes smaller. The value of conductivity is determined by the concentration of electrons and electron mobility. When the crystallization temperature is increased, the degree of crystallization is improved and the grain size is increased, and the dense microstructure of the glass-ceramics can be obtained. This result hinders the channel of ionic migration leading to the conductivity decreased, namely the volume resistivity increased, as shown in Fig. 6. Finally, the values of BDS are enhanced due to the volume resistivity increased, as shown in Fig. 5.
The P-E hysteresis loops exhibit a low remanent polarization and coercive field. This result indicates that a small quantity of ferroelectric phases is formed from the glass matrix. The linear behavior of the P-E hysteresis loops is mainly due to weak ferroelectric phase particles in micrometer and strong paraelectric glass phase [22].
The sample heat treated at 900 ��C exhibits the highest energy density of ~2.80 J/cm3. Comparing with some alternative glass-ceramics with high energy storage density, as shown in Table 2, the as-prepared glass- ceramic has very high breakdown strength and reasonable energy storage density. However, the value of dielectric constant is lower than that of some alternative materials. Further investigations are required to improve the dielectric constant of the glass-ceramics for further application in energy density systems.
5 Conclusions
1) The crystallization mechanism and dielectric properties of SrO-BaO-Nb2O5-B2O3-SiO2 system were investigated. The crystallization mechanism related to the crystallization process was found to be the one-dimensional interfacial growth.
2) With the increase of crystallization temperature, the grain size increases and the pore gradually disappears, which improves the breakdown strength. The glass- ceramic heated at 900 ��C shows the maximum dielectric breakdown strength of 1300 kV/cm, which is believed to be the main contribution to the optimized energy density. Therefore, the as-prepared glass-ceramics may be promising candidate for high energy storage density capacitors.
References
[1] PAN M J, RANDALL C A. A brief introduction to ceramic capacitors [J]. Electrical Insulation Magazine, 2010, 26(3): 44-50.
[2] SHEN Zong-yang, LI Yue-ming, LUO Wen-qin, WANG Zhu-mei, GU Xing-yong, LIAO Run-hua. Structure and dielectric properties of NdxSr1-xTiO3 ceramics for energy storage application [J]. Journal of Materials Science: Materials in Electronics, 2013, 24(2): 704-710.
[3] GORZKOWSKI E P, PAN M J, BENDER B, WU C C M. Glass-ceramics of barium strontium titanate for high energy density capacitors [J]. Journal of Electroceramics, 2007, 18(3-4): 269-276.
[4] DU J, JONES B, LANAGAN M. Preparation and characterization of dielectric glass�Cceramics in Na2O-PbO-Nb2O5- SiO2 system [J]. Materials Letters, 2005, 59(22): 2821-2826.
[5] LUO Jun, DU Jun, TANG Qun, MAO Chang-hui. Lead sodium niobate glass-ceramic dielectrics and internal electrode structure for high energy storage density capacitors [J]. Electron Devices, 2008, 55(12): 3549-3554.
[6] WANG Lei, ZHANG Qing-meng, DU Jun. Structural characteristics and dielectric properties of glass-ceramic nanocomposites of (Pb,Sr)Nb2O6-NaNbO3-SiO2 [J]. Transactions of Nonferrous Metals Society of China, 2010, 20(8): 1434-1438.
[7] CHEN Guo-hua, ZHANG Wen-jun, LIU Xin-yu, ZHOU Chong-rong. Preparation and properties of strontium barium niobate based glass-ceramics for energy storage capacitors [J]. Journal of Electroceramics, 2011, 27 (2): 78-82.
[8] ZHANG Yong, HUANG Jia-jia, TAO Ma, WANG Xiang-rong, DENG Chang-sheng, DAI Xia-ming. Sintering temperature dependence of energy-storage properties in (Ba,Sr)TiO3 glass-ceramics [J]. Journal of the American Ceramic Society, 2011, 94(6): 1805-1810.
[9] SHYU J J, WANG J R. Crystallization and dielectric properties of SrO-BaO-Nb2O5-SiO2 tungsten bronze glass-ceramics [J]. Journal of the American Ceramic Society, 2000, 83(12): 3135-3140.
[10] CHENG C T, LANAGAN M, LIN J T, JONES B, PAN M J. Crystallization kinetics and dielectric properties of nanocrystalline lead strontium barium niobates [J]. Journal of Materials Research, 2005, 20(2): 438-446.
[11] ZENG Yi-ke, QIN Xiao-ye, JIANG Sheng-lin, ZHANG Guang-zu, ZHANG Ling. Effect of BaF2 addition on crystallization kinetics and dielectric properties of B2O3�CNb2O5�CSrO�CBaO glass�Cceramics [J]. Journal of the American Ceramic Society, 2011, 94(2): 469-473.
[12] LIU Tao-yong, CHEN Guo-hua, SONG Jun, YUANG Chang-lai. Crystallization kinetics and dielectric characterization of CeO2-added BaO-SrO-Nb2O5-B2O3-SiO2 [J]. Ceramics International, 2013, 39(5): 5553-5559.
[13] SHYU J J, CHEN C H. Sinterable ferroelectric glass-ceramics containing (Sr,Ba)Nb2O6 crystals [J]. Ceramics International, 2003, 29(4): 447-453.
[14] CHEN Guo-hua, ZHANG Wen-jun. Effects of heat treatment condition on properties of strontium barium niobate based glass-ceramic for energy storage capacitors [J]. Advanced Materials Research, 2011, 311-313: 2071-2074.
[15] PULI V S, KUMAR A, KATIYAR R S, SU X, BUSTA C M, CHRISEY D B, TOMOZAWA M. Dielectric breakdown of BaO-B2O3-ZnO-[(BaZr0.2Ti0.80)O3]0.85 [(Ba0.70Ca0.30)TiO3]0.15 glass- ceramic composites [J]. Journal of Non-Crystalline Solids, 2012, 358(24): 3510-3516.
[16] YOUNG A L, HILMAS G E, ZHANG S C, SCHWARTZ R W. Mechanical vs. electrical failure mechanisms in high voltage, high energy density multilayer ceramic capacitors [J]. Journal of Materials Science Letters, 2007, 42(14): 5613-5619.
[17] ZHANG Qian, ZHANG Yong, WANG Xiang-rong, MA Tao, YUAN Zong-bao. Influence of sintering temperature on energy storage properties of BaTiO3-(Sr1-1.5xBix)TiO3 ceramics [J]. Ceramics International, 2012, 38(6): 4765-4770.
[18] KISSINGER H E. Variation of peak temperatures with heating rate in differential thermal analysis [J]. Journal of Research of the National Bureau of standards, 1956, 57(4): 217-221.
[19] CHENG C T, LANAGAN M, JONES B, LIN J T, PAN M J. Crystallization kinetics and phase development of PbO-BaO-SrO-Nb2O5-B2O3�CSiO2-based glass-ceramics [J]. Journal of the American Ceramic Society, 2005, 88(11): 3037-3042.
[20] SUNG Y M. Nonisothermal phase formation kinetics in sol�Cgel- derived strontium bismuth tantalite [J]. Journal of Materials Research, 2001, 16(7): 2039-2044.
[21] OZAWA T. Kinetic Analysis of derivative curves in thermal analysis [J]. Journal of Thermal Analysis and Calorimetry, 1970, 2(3): 301-324.
[22] HAN D F, ZHANG Q M, LUO J, TANG Q, DU J. Optimization of energy storage density in ANb2O6-NaNbO3-SiO2(A=[(1-x)Pb, xSr]) nanostructured glass-ceramic dielectrics [J]. Ceramics International, 2012, 38(8): 6903-6906.
[23] MAO Chang-hui, SUN Xu-dong, DU Jun, TANG Qun. Preparation and dielectric properties of Nb2O5-BaO-Na2O-SiO2 glass-ceramic for energy storage capacitors [J]. Journal of Physics: Conference Series, 2009, 152(1): 012061-012065.
�������������ľ�������ѧ���䴢�����ܵ��¶�������
����ӿ1���¹���1,2���� ��1��Ԭ����1,2
1. ���ֵ��ӿƼ���ѧ ���Ͽ�ѧ�빤��ѧԺ������ 541004��
2. ���ֵ��ӿƼ���ѧ ������Ϣ�����ص�ʵ���ң����� 541004
ժ Ҫ����������-���䷨�Ʊ������ȱ������������ϣ��о������¶ȶ������ȱ�������������֯��������ܡ�����ǿ�Ⱥʹ����ܶȵ�Ӱ�졣�������ľ�������Ϊһά���澧��������������������ž����¶ȵ����ӣ����ϵĻ���ǿ���������ӡ���900 ��C�ȴ����õ����������������ŵ����ܣ�����ǿ��Ϊ1300 kV/cm�������ܶ�Ϊ2.8 J/cm3�����������ڸߴ����ܶȵ���ʲ��ϡ�
�ؼ��ʣ��������������ϣ�������������
(Edited by Chao WANG)
Foundation item: Project (51162002) supported by the National Natural Science Foundation of China; Project (2012-250) supported by the Science and Technology Project of Guangxi Returned Personnel, China
Corresponding author: Guo-hua CHEN; Tel: +86-773-2291957; E-mail: chengh@guet.edu.cn
DOI: 10.1016/S1003-6326(14)63118-6

