Trans. Nonferrous Met. Soc. China 25(2015) 1840-1846
Identification of damage mode in AZ31 magnesium alloy under tension using acoustic emission
Hong CHANG
Industrial Training Centre, Shenzhen Polytechnic, Shenzhen 518055, China
Received 29 August 2014; accepted 30 January 2015
Abstract: In order to characterize different damage modes, real-time detection of the tensile cracking process for AZ31 magnesium alloy was performed using acoustic emission (AE) technique. Results showed that elastic deformation, plastic deformation, microcracking, stable and unstable propagation occurred during crack damage. Four damage modes were determined using AE multiparameter analysis. Dislocation motion signals with amplitudes <70 dB and twinning signals with 70-100 dB were found. Microcrack signal energy was concentrated from 2400 aJ to 4100 aJ, mainly at a rise time of less than 800 μs. A stable crack propagation signal had high peak to counts in the 20 to 50 range, whereas its ring count was in the 20 to 2000 range. The average frequency of unstable propagation signals was approximately 100 kHz, with duration from 2000 μs to 105 μs. The damage mechanisms and AE resources from different crack propagation steps were discussed. Various damage modes could be characterized by different AE signal parameters when they appeared simultaneously during crack propagation.
Key words: acoustic emission; multi-parameter analysis; damage characterization; tension testing; magnesium alloy
1 Introduction
Magnesium (Mg) alloys exhibit a desirable combination of low density and specific strength (comparable or even superior to that of precipitation- strengthened Al alloys), along with good damping capacity, castability, weldability, and machinability. Among the various commercial Mg alloys, those developed from the Mg-Al-Zn ternary system (that is, the as-named AZ alloys) have the largest number of industrial applications. Major commercial AZ alloys are produced either as cast products (such as die, sand, and mold castings) or wrought products (such as extrusions, forgings, sheets, and plates). Wrought Mg alloys are mainly used in aerospace, automotive, military equipments, and electronic industrial products. Of the few wrought AZ commercial alloys, the AZ31 alloy presents a good compromise among strength, ductility, and cost and is probably the best choice for stamping operations. Current study focuses on improving the strength and ductility of the AZ31 Mg alloy [1-5], which is rarely involved in the deformation and fracture process of materials in service, especially in the occurrence and prediction of early damage and judgment of damage form, which may be encountered in material engineering applications.
Acoustic emission (AE) refers to transient elastic waves generated by the rapid release of energy from localized sources within a material [6]. Numerous studies have been undertaken over the last 30 years to develop AE technology for metal fracture damage monitoring [7-10]. The high sensitivity of AE in detecting the loss of material integrity in early stages has become a marked advantage over the well-established broadband all-digital AE system and powerful signal analysis techniques [11-15]. Most published reports on the application of AE to monitoring tensile deformation of Mg alloys had been conducted on hardening evolution [16], the effect of microstructure on the deformation behavior [17,18], stress relaxation [19], and so on. However, the identification and differentiation of a variety of AE sources in the Mg alloy cracking process have not been reported.
In this work, AE-monitored tensile tests were performed on AZ31 Mg alloy to distinguish different forms of damage using the tensile curve and multiparameter analysis of AE signals. The mechanisms of damage and AE sources were discussed from different stages of the cracking process.
2 Experimental
The alloy used in this work was a commercial Mg-Al-Zn alloy called AZ31. The chemical composition and microstructure were tested by energy disperse spectroscopy (EDS) and scanning electron microscopy (SEM). The mechanical properties were also tested by tensile testing. The chemical composition and mechanical properties of the rolled AZ31 Mg alloy are listed in Tables 1 and 2, respectively. The microstructure of AZ31 comprises α-phase (grey) and a small amount of β-phase Mg17Al12 (white particles) (Fig. 1). The single- edge notched plate specimens (220 mm in length, 36 mm in width, 5 mm in thickness) with a 5 mm notch were cut by a Mo line from the rolled plate along the rolling direction.
Table 1 Composition of AZ31 Mg alloy (mass fraction, %)
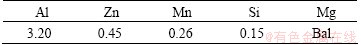
Table 2 Mechanical properties of AZ31 Mg alloy

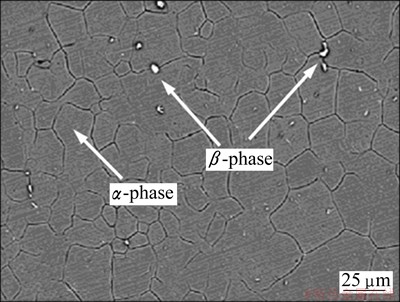
Fig. 1 SEM image of AZ31 Mg alloy
Tensile testing was conducted on an INSTRON 8562 servo-mechanical fatigue testing machine under ambient laboratory air (temperature: 20-25 °C). After a pre-crack of 1 mm, the specimen was stretched at a rate of 0.002 mm/s until it failed, and AE signals were collected simultaneously. AE measurements were performed using AE equipment (DiSP system) manufactured by the Physical Acoustic Corporation. Two wideband transducers (WBs) at a distance of 60 mm from the crack were symmetrically mounted on both sides of the pre-crack so that AE signals from the crack can be differentiated from the grip noise. AE signals from the two transducers were amplified by preamplifiers (40 dB) and then sent to the DiSP microprocessor. The broadband WBs had high fidelity and high sensitivity. These preamplifier outputs were band-pass-filtered from 20 kHz to 2 MHz. The threshold was 30 dB. AE signals were detected during stretching until failure, and the morphologies of the fracture surfaces were examined using scanning electron microscopy (SEM).
3 Results and discussion
3.1 Division of different stages of tensile test process
Various stages of the crack process can be effectively distinguished under tensile load and absolute energy mutations of AE signals during the test (Fig. 2). The whole stretching process is divided into six stages over time. The various stages and mechanisms of absolute energy changes are discussed below.

Fig. 2 Absolute energy plotted with load versus time during tensile test of AZ31 Mg alloy
The first stage is the initiation of the fatigue precrack. Before the tensile test, specimens were precracked with a crack length of 1 mm through fatigue. An early stretch from 0 to 22 s resulted in a slight increase of approximately 1.7 kN in the load, but no energy was released because damage did not occur. Thus, the absolute energy of the AE signal remained almost unchanged. The second stage is the elastic deformation of the crack tip. The load increased linearly from 1.7 kN to 4 kN from 22 s to 45 s, which caused a slight increase in absolute energy of approximately 0.1×10⁸ aJ. The material and sample processing caused a certain stress concentration or defects within the material. During the elastic deformation stage, the sample was under the joint action of the applied load, such that certain AE energy release occurred at a short duration.
The third stage is the plastic deformation of the crack tip. The load was no longer a linear variation, load yielding occurred, and the AE signal absolute energy increased considerably. Absolute energy changes exhibited two states in this stage. During the initial plastic deformation (45 s to 65 s), the AE absolute energy value was small at approximately 0.2×10⁸ aJ, which was followed by a substantial increase of up to 4×10⁸ aJ from 65 s to 107 s. The basic symmetry of hexagonal close-packed crystals limited the number of independent slip systems, thus making twinning an important deformation mechanism [20]. At room temperature, the main slip direction was in the (1120) basal plane, whereas deformation twinning occurred on the (1012) pyramidal plane [21,22]. During the early stages of plastic deformation, a small amount of slip occurred through a few dislocations. However, crystal orientation was no longer conducive to slip as the load increased with slip development. Twinning dominated the subsequent plastic deformation when the shear stress of the twinning direction reached a critical value. The shear stress value of twinning was greater than that of slip [23]. Thus, twinning resulted in the release of a large amount of energy corresponding to a significant increase in AE absolute energy.
The fourth stage is the micro-cracking of the crack tip. An obvious inflection point with a significantly lower slope was observed for AE absolute energy at 107 s. The increase was approximately 0.1×10⁸ aJ from 107 to 167 s and was accompanied by a slow rise in load. The release of AE energy was only concentrated in microcrack regions because microcracks eased a relatively large area of the plastic deformation. AZ31 Mg alloy exhibits ductile fracture cracking, such that microcracking is essentially plastic deformation. In addition, microcracking is hindered by the grain boundary and the second phase, which decelerates the increase in AE absolute energy.
The fifth stage is stable crack propagation. At 167 s, AE absolute energy suddenly increased 0.2×10⁸ aJ. Given that crack growth to a certain size results in a macroscopic crack, the release of energy induced mutations. From 167 s to 323 s, the energy curve rose slowly with a slight increase in load, which is the same trend as that in the previous stage. This condition is essentially due to the plastic deformation cracking.
The sixth stage is unstable crack propagation. At 323 s, a sudden increase of 0.2×10⁸ aJ in the AE absolute energy occurred. Subsequently, energy increased more quickly than that in the previous stage, reaching up to 5.7×10⁸ aJ at 385 s. However, the load began to decline. In this stage, unstable crack propagation occurred within a short period, which resulted in a large amount of released AE energy.
3.2 Analysis of AE characteristics during different damage stages
The tensile process may be chronologically separated at different stages of crack propagation (Fig. 2). The AE amplitude components differ at each stage (Fig. 3). Plastic deformation generates two different AE signals. The low-amplitude signal, with an amplitude <70 dB, occurs only in the early stage of plastic deformation and is generated by a dislocation slip. By contrast, the high-amplitude signal, with an amplitude >70 dB, appears throughout the plastic deformation stage. The amplitude of some signals, which are produced by twinning, can be larger than 90 dB. The AE signal amplitude is mainly distributed in the 50 dB to 80 dB range during the microcrack initiation period and in the 50 dB to 70 dB range during stable crack growth. The AE signal amplitude generally ranges from 50 dB to 80 dB, and some high-amplitude signals with amplitudes >90 dB appear during the crack instability process.
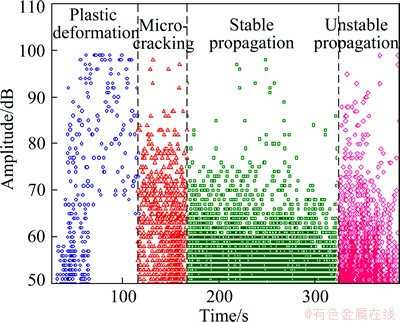
Fig. 3 Distribution of AE signal amplitude versus time in different stages of tensile test of AZ31 Mg alloy
During tensile crack propagation, different forms of damages, such as microcracks, occur simultaneously. Plastic deformation signals appear during the subsequent stable and unstable propagation stages. Microcrack signals are generated simultaneously during the stable and unstable crack growth stages. This finding shows that in various stages, damage is not only linked to one kind of AE source. The different AE sources in a certain stage of damage cannot be distinguished from the amplitude distribution results, so multiparameter analysis of AE signals should be performed.
According to the results shown in Fig. 3, the various stages of damage resulting in the characteristic parameters of AE signals are filtered, analyzed, and quantified (Fig. 4) to reflect the occurrence of different damage mechanisms and their distribution in AZ31 Mg alloy during tensile cracking. These parameters include ringing counts, peak to counts, rise time, duration, energy, average frequency, centroid frequency, initial frequency, and resonance frequency. The elimination of the twins during the late stages of plastic deformation causes slip plastic deformation to occur throughout the stretching process. Microcracks appear and propagate to become specimen fractures. Stable crack growth is the main source of a large number of signals. However, only a few unstable high-amplitude propagation signals are generated.

Fig. 4 Distribution of amplitude versus time for different damage mechanisms during tensile test of AZ31 Mg alloy
4 AE multiparameter characterization of damage
4.1 AE signal analysis of plastic deformation
The AE signal amplitude characteristics of dislocation motion and twinning during plastic deformation for AZ31 Mg alloy are shown in Fig. 5. At the early stage of plastic deformation, only dislocation motion signals with amplitudes <70 dB are found. However, the Mg alloy with hexagonal crystal structure only has few slip systems. With increasing tensile load, some high-amplitude twinning signals appear. At 65 s, low-amplitude signals are no longer present. Only high-amplitude signals in the 70 dB to 100 dB range exist. These signals are all generated by twinning. Accordingly, two types of plastic deformation damage can be distinguished based on AE signal amplitude.
4.2 AE signal analysis of microcracking in crack tip plastic zone
The distribution between AE signal energy and rise time during the stretching process of AZ31 Mg alloy is shown in Fig. 6. The results show that the distribution of crack tip plastic zone microcrack signals markedly differs from those of the other damage signals. Microcrack signal energy is concentrated from 2400 aJ to 4100 aJ, mainly at a rise time of less than 800 μs. Thus, the crack tip plastic zone microcrack signal can be effectively distinguished through the distribution of energy and rise time. AE microcrack signals are mainly generated by the cracking of the matrix material, which is a microvoid formation caused by slip and twinning as well as by precipitate shedding or cracking. Therefore, two amplitude components exist (Fig. 4), one has a moderate intensity of 60 dB to 80 dB from the micropore-forming signal, and the other has a high amplitude of 80 dB to 100 dB from the precipitation damage signal.
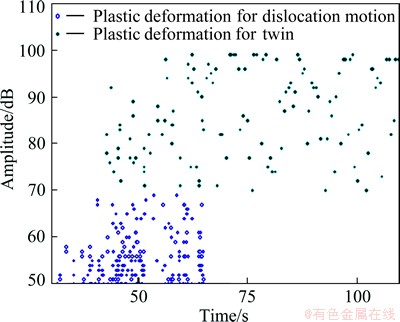
Fig. 5 Dislocation motion and twin damages during plastic deformation of AZ31 Mg alloy
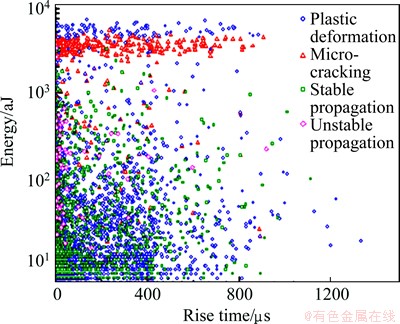
Fig. 6 Energy versus rise time during tensile test of AZ31 Mg alloy
4.3 AE signal analysis of stable crack propagation
Analyzing the distribution relationship of peak to counts and ringing counts of AE signals facilitates the identification of the stable crack growth damage from other damage modes (Fig. 7). A stable crack propagation signal has high peak to counts, mainly in the 20 to 50 range, whereas its ring count is lower, mainly in the 20 to 2000 range. The stable crack propagation of AZ31 Mg alloy during stretching is mainly induced by the gathering of microvoids (Fig. 8) [24], which are formed during the micro-cracking stage. Under multislip dislocations, the material between two adjacent voids is constantly eroded until the two voids are joined. A dimple surface forms, delineating the end of slip traces.
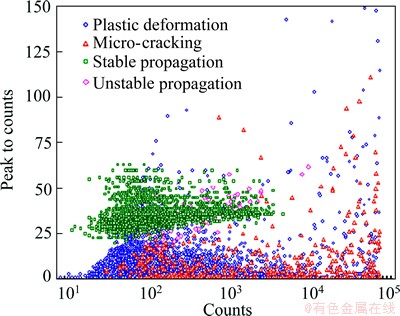
Fig. 7 Peak to counts versus counts during tensile test of AZ31 Mg alloy
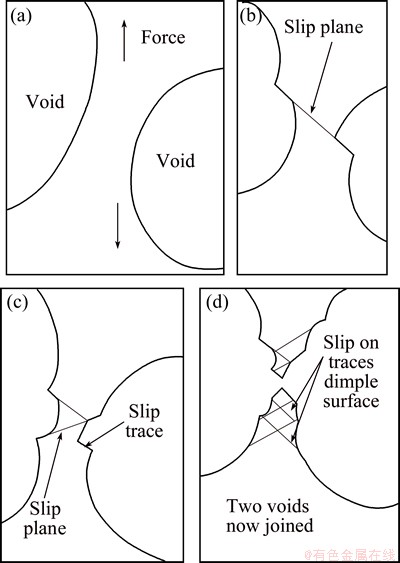
Fig. 8 Crack propagation process [24]
The tensile fracture morphology with a dimple plastic fracture is shown in Fig. 9. Therefore, AE sources of stable crack are mainly multislip plastic deformation and fracture. After the removal of the plastic deformation signal, stable crack growth signals should be generated by microcracks combined with fractures.
4.4 AE signal analysis of unstable crack propagation
The relationship between average frequency and duration of AE signals in the tensile process for AZ31 Mg alloy is demonstrated in Fig. 10. Few crack unstable propagation signals are observed, and their distribution differs from those of the other forms of damage. The average frequency distribution of such signals is approximately 100 kHz, with duration ranging from 2000 μs to 105μs. Crack unstable propagation signals can be effectively distinguished based on the associated distribution between averaging frequency and duration. During the crack instability stage, the reduction rate of tensile stress is remarkably less than that of the remaining cross-sectional area of the sample. Thus, cracks rapidly expand and form fractures within a short time. AE sources of crack unstable propagation are mainly fractures, which induce high-energy release, such that signal amplitude becomes higher.
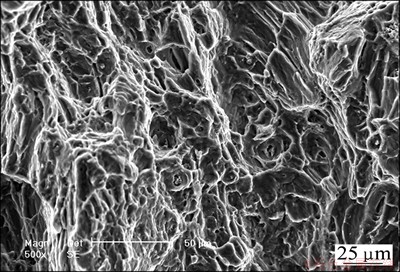
Fig. 9 Fracture surface of tensile sample for AZ31 Mg alloy
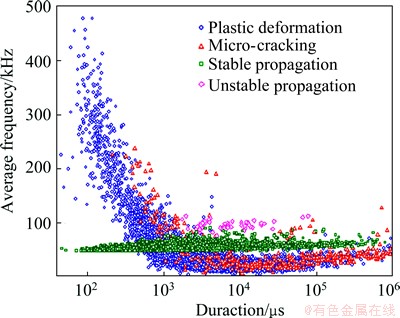
Fig. 10 Average frequency versus duration during tensile test of AZ31 Mg alloy
5 Conclusions
1) The tensile cracking of AZ31 Mg alloy undergoes five stages with corresponding damage types, namely, elastic deformation, plastic deformation, microcracks, stable cracks, and crack instability.
2) With the use of amplitude, energy, average frequency, rise time, duration, and peak to counts, multiparameter analysis of AE signals facilitates the identification of four different forms of damage. These damage forms include plastic deformation, microcracks, stable cracks, and unstable cracks.
3) Further research should be conducted for the quantitative characterization of AE parameters for damage to provide valid data that can serve as bases for early warning and damage development.
References
[1] TSENG S T, HU H T. Finite element verification on constitutive law of AZ31 magnesium alloy at 400 °C [J]. Transactions of Nonferrous Metals Society of China, 2013, 23(11): 3372-3382.
[2] PARAMSOTHY M, HASSAN S F, SRIKANTH N, GUPTA M. Adding carbon nanotubes and integrating with AA5052 aluminium alloy core to simultaneously enhance stiffness, strength and failure strain of AZ31 magnesium alloy [J]. Composites Part A-Applied Science and Manufacturing, 2009, 40(9): 1490-1500.
[3] PARAMSOTHY M, HASSAN S F, SRIKANTH N, GUPTA M. Simultaneous enhancement of tensile/compressive strength and ductility of magnesium alloy AZ31 using carbon nanotubes [J]. Journal of Nanoscience and Nanotechnology, 2010, 10(2): 956-964.
[4] MURALIDHARAN P, SYED F H, NGUYEN Q B, NARASIMALU S, MANOJ G. Selective enhancement of tensile/compressive strength and ductility of AZ31 magnesium alloy via nano-Al2O3 reinforcement integration method alteration [J]. Materials Science Forum, 2009, 618-619: 423-427.
[5] ZHANG H, HUANG G S, ROVEN H J, WANG L, PAN F. Influence of different rolling routes on the microstructure evolution and properties of AZ31 magnesium alloy sheets [J]. Materials & Design, 2013, 50(9): 667-673.
[6] SCRUBY C B. An introduction to acoustic emission [J]. Journal of Physics E-Scientific Instruments, 1987, 20(8): 946-953.
[7] CHANG H, HAN E H, WANG J Q, KE W. Acoustic emission study of corrosion fatigue crack propagation mechanism for LY12CZ and 7075-T6 aluminum alloys [J]. Journal of Materials Science, 2005, 40(21): 5669-5674.
[8] WANG Z F, ZHU Z, KE W. Behavior of acoustic emission for low-strength structural steel during fatigue and corrosion fatigue [J]. Metallurgical Transactions A, 1991, 22(11): 2677-2680.
[9] WADLEY R N G, SCRUBY C B, SHRIMPTON G. Quantitative acoustic emission source characterisation during low temperature cleavage and intergranular fracture [J]. Acta Metallurgica, 1981, 29(2): 399-414.
[10] YU J G, PAUL Z, BORIS Z, JUAN C. Prediction of fatigue crack growth in steel bridge components using acoustic emission [J]. Journal of Constructional Steel Research, 2011, 67(8): 1254-1260.
[11] AGGELIS D G, KORDATOS E Z, MATIKAS T E. Acoustic emission for fatigue damage characterization in metal plates [J]. Mechanics Research Communications, 2011, 38(2): 106-110.
[12] XU S, LIU J P, XU S D, WEI J, HUANG W B, DONG L B. Experimental studies on pillar failure characteristics based on acoustic emission location technique [J]. Transactions of Nonferrous Metals Society of China, 2012, 22(11): 2792-2798.
[13] ELFORJANI M, MBA D. Accelerated natural fault diagnosis in slow speed bearings with acoustic emission [J]. Engineering Fracture Mechanics, 2010, 77(1): 112-127.
[14] ZHANG W M, LIU S X, QIU Y, CHEN C F. Study of the metal crack propagation by acoustic emission testing [J]. Applied Mechanics and Materials, 2012, 105-107: 2179-2182.
[15] CHANG H, HAN E H, WANG J Q, KE W. Acoustic emission study of fatigue crack closure of physical short and long cracks for aluminum alloy LY12CZ [J]. International Journal of Fatigue, 2009, 31(3): 403-407.
[16] LOU X Y, LI M, BOGER R K, AGNEW S R, WAGONER R H. Hardening evolution of AZ31B Mg sheet [J]. International Journal of Plasticity, 2007, 23(1): 44-86.
[17] BOHLEN J, DOBRON P, GARCIA E M, CHMELIK F, LUKACU P, LETZIG D, KAINER K U. The effect of grain size on the deformation behaviour of magnesium alloys investigated by the acoustic emission technique [J]. Advanced Engineering Materials, 2006, 8(5): 422-427.
[18] BOHLEN J, CHMELIK F, DOBRON P, KAISER F, LETZIG D, LUKAC P, KAINER K U. Orientation effects on acoustic emission during tensile deformation of hot rolled magnesium alloy AZ31 [J]. Journal of Alloys and Compounds, 2004, 378(1-2): 207-213.
[19] DOBRON P, BOHLEN J, CHMELIK F, LUKAC P, LETZIG D, KAINER K U. Acoustic emission during stress relaxation of pure magnesium and AZ magnesium alloys [J]. Materials Science and Engineering A, 2007, 462(1-2): 307-310.
[20] CHRISTIAN J W, MAHAJAN S. Deformation twinning [J]. Progress in Materials Science, 1995, 39(1-2): 1-157.
[21] ANDO D, KOIKE J, SUTOU Y. Relationship between deformation twinning and surface step formation in AZ31 magnesium alloys [J]. Acta Materialia, 2010, 58(13): 4316-4324.
[22] KNEZEVIC M, LEVINSON A, HARRIS R, MISHRA R K, DOHERTY R D, KALIDINDI S R. Deformation twinning in AZ31: Influence on strain hardening and texture evolution [J]. Acta Materialia, 2010, 58(19): 6230-6242.
[23] CHEN Y J, WANG Q D, ROVEN H J, LIU M P, KARLSEN M, YU Y D, HJELEN J. Network-shaped fine-grained microstructure and high ductility of magnesium alloy fabricated by cyclic extrusion compression [J]. Scripta Materialia, 2008, 58(4): 311-314.
[24] ENNACEUR C, LAKSIMI A, HERVE C, CHERFAOUI M. Monitoring crack growth in pressure vessel steels by the acoustic emission technique and the method of potential difference [J]. International Journal of Pressure Vessels and Piping, 2006, 83(3): 197-204.
镁合金拉伸过程中损伤模式的声发射识别
常 红
深圳职业技术学院 工业中心,深圳 518055
摘 要:为了识别不同的损伤模式,采用声发射技术对AZ31镁合金拉伸开裂过程进行实时监测。结果显示,拉伸开裂经历了弹性变形、塑性变形、微开裂、稳定扩展和失稳扩展的损伤过程。通过声发射的多参数分析,确定了4种损伤模式,即塑性变形、微开裂、稳定扩展和失稳扩展。位错滑移导致的塑性变形信号幅度小于70 dB, 而孪晶信号的幅度位于70~100 dB之间。微开裂信号能量位于2400 到4100 aJ之间,而信号上升时间小于800 μs。 稳定裂纹扩展信号具有较高的峰值前计数,主要分布在20~50范围内,而其振铃总计数却较低,主要分布在20~2000范围内。裂纹失稳扩展信号的平均频率分布在100 kHz左右,持续时间在2000~105 μs范围内。还对不同开裂阶段的损伤机理和声发射源进行了讨论。通过实验测试和讨论,利用不同的声发射信号参数,可以有效识别镁合金开裂过程中同时出现的不同损伤形式。
关键词:声发射;多参数分析;损伤识别;拉伸测试;镁合金
(Edited by Yun-bin HE)
Foundation item: Project (2213K3170027) supported by the Shenzhen Polytechnic Project Fund, China
Corresponding author: Hong CHANG; Tel: +86-755-26731625; E-mail: hchang@szpt.edu.cn
DOI: 10.1016/S1003-6326(15)63790-6

