þ�������Ӹ��ϲ��ϵĸ��¶�̬������Ӧ��άģ��
��Դ�ڿ����й���ɫ����ѧ��(Ӣ�İ�)2021���3��
�������ߣ���ϼ ���ӷ� �շ� ���Ƿ�
����ҳ�룺636 - 647
Key words��magnesium matrix composites; hybrid nanosized reinforcements; dynamic mechanical properties; numerical analysis
ժ Ҫ��������ά������Ԫ�����������ǽ����ھ�������̼���ܺ�����SiC������ǿAZ91Dþ�Ͻ�����ϲ�����25~300 ��C��̬������Ӧ������ά��ֵģ�⣬����ģ������ʵ�����ݽ��бȽϡ�����������ڲ�ͬ�¶��£��������ϲ������嶯̬������������̼���ܺ�����SiC����������������ͻ�����������ȵ����Ӷ���ߡ������������Ϊ1.0%������£���̼���ܺ�����SiC�����Ļ��������Ϊ7:3~8:2ʱ������ǿ��ЧӦ���þ�����������ϲ����ڸ��¶��غ������±��ֳ�����Ӧ����Ӳ�����¶�����ЧӦ��ģ������ʵ�������ǺϽϺá�
Abstract: 3D numerical simulations of dynamical tensile response of hybrid carbon nanotube (CNT) and SiC nanoparticle reinforced AZ91D magnesium (Mg) based composites considering interface cohesion over a temperature range from 25 to 300 ��C were carried out using a 3D representative volume element (RVE) approach. The simulation predictions were compared with the experimental results. It is clearly shown that the overall dynamic tensile properties of the nanocomposites at different temperatures are improved when the total volume fraction and volume fraction ratio of hybrid CNTs to SiC nanoparticles increase. The overall maximum hybrid effect is achieved when the hybrid volume fraction ratio of CNTs to SiC nanoparticles is in the range from 7:3 to 8:2 under the condition of total volume fraction of 1.0%. The composites present positive strain rate hardening and temperature softening effects under dynamic loading at high temperatures. The simulation results are in good agreement with the experimental data.
Trans. Nonferrous Met. Soc. China 31(2021) 636-647
Xia ZHOU1, Zi-fan LIU1, Feng SU1, Ya-fu FAN2
1. State Key Laboratory of Structural Analysis for Industrial Equipment, Department of Engineering Mechanics, Dalian University of Technology, Dalian 116024, China;
2. G&F Impact Engineering and Materials Technology Co., Ltd., Yantai 264003, China
Received 4 September 2020; accepted 25 January 2021
Abstract: 3D numerical simulations of dynamical tensile response of hybrid carbon nanotube (CNT) and SiC nanoparticle reinforced AZ91D magnesium (Mg) based composites considering interface cohesion over a temperature range from 25 to 300 ��C were carried out using a 3D representative volume element (RVE) approach. The simulation predictions were compared with the experimental results. It is clearly shown that the overall dynamic tensile properties of the nanocomposites at different temperatures are improved when the total volume fraction and volume fraction ratio of hybrid CNTs to SiC nanoparticles increase. The overall maximum hybrid effect is achieved when the hybrid volume fraction ratio of CNTs to SiC nanoparticles is in the range from 7:3 to 8:2 under the condition of total volume fraction of 1.0%. The composites present positive strain rate hardening and temperature softening effects under dynamic loading at high temperatures. The simulation results are in good agreement with the experimental data.
Key words: magnesium matrix composites; hybrid nanosized reinforcements; dynamic mechanical properties; numerical analysis
1 Introduction
Magnesium (Mg) matrix nanocomposites are now considered having broader application prospects than conventional Mg alloy in the automobile, aerospace and communication industries due to their high specific strength and good combination of strength and ductility [1]. Currently, the research on mechanical properties and failure mechanisms of nanosized particulate and whisker reinforced Mg-based composites at low strain rates has achieved some results [2-5]. However, it is not clear enough to understand their dynamic mechanical response because their mechanical behavior and deformation mechanism under dynamic loading are quite different from those under quasi-static loading [6,7]. Although there are many qualitative studies on dynamic mechanical properties of a monolithic Mg alloy, dynamic tensile properties and constitutive behavior of the monolithic Mg alloy and its composites are rarely reported [8] and dynamic tensile stress-strain behavior of Mg matrix nanocomposites needs to be further studied. Therefore, it is of important theoretical and practical significance to carry out the research on the tensile mechanical properties and constitutive behavior of Mg alloy and its composites, especially Mg based nanocomposites under dynamic loading conditions.
Although there has been a lot of research in Mg-based composites at present, these studies have mainly focused on the preparation process, micro- structure characterization and static mechanical properties [3,9]. The research on the dynamic mechanical properties of Mg-based nanocomposites has rarely been reported [10] and a limited number of existing investigations on dynamic response are mostly based on the experimental procedure [6,10]. In our previous work [11], novel hybrid AZ91D based nanocomposites reinforced with CNTs and nanosized SiC particles were developed and the significant enhancement in quasi-static tensile response of the hybrid composites has been achieved due to the introduction of hybrid nano-reinforcements. So far, no effort has been made to study dynamic tensile behavior of Mg matrix hybrid nanocomposites fabricated by ultrasonic cavitation process. In addition, the reason for the improved dynamic response of the Mg hybrid composites still needs further studies [6]. In order to quantitatively analyze static and dynamic mechanical behavior of Mg alloy and other metal matrix composites, micromechanical finite-element approach based on a typical representative volume element (RVE) model is often adopted [4]. Some scholars [12-15] have simulated the elastic and plastic mechanical behavior of metal matrix composites under axial tension or compression by using an ideal 2D or 3D RVE model. MENG and WANG [12] investigated the effect of cohesive strength and cohesive failure on particle reinforced metal matrix composites under quasi-static axial tensile loading based on micromechanics based 3D RVE finite element model. DASTGERDI et al [15] established a 2D RVE-based micromechanical model for mechanical behavior of particle- reinforced Mg based nanocomposites considering debonding damage and analyzed the stress-strain behavior of the nanocomposites under quasi-static axial tensile loading. In these cases, the model is simplified, and the effects of the random distribution of reinforcements in 3D space and reinforcement-matrix interfaces are not fully considered. Therefore, it is very important to establish a RVE model close to the real structure of the composites for predicting the dynamic mechanical response of the composites. 3D numerical analysis of dynamic mechanical behavior of Mg matrix nanocomposites based on the RVE model with randomly distributed hybrid nanoreinforcements has not been reported.
In the present work, CNTs and SiC nano- particles are assumed to distribute in the Mg alloy randomly. The 3D RVE model is generated by developed Python algorithm. The interface behavior between nanosized reinforcements and the matrix is represented by a bilinear cohesive zone model, while cohesive behavior is surface based. Numerical modelling of dynamic tensile properties of AZ91D Mg-based nanocomposites reinforced with hybrid CNTs and SiC nanoparticles is carried out under different strain rate and temperature conditions. The aim of this work is to study the effects of interface characteristics and hybrid nanosized reinforcements on dynamic mechanical properties of the Mg composites and discuss the hybrid strengthening mechanism by comparison of simulation results and experimental data.
2 Finite element modeling
2.1 3D finite element model of Mg based hybrid nanocomposite
3D RVE model of randomly distributed CNTs and SiC nanoparticles reinforced Mg matrix hybrid composites was generated based on Python programming and random sequential adsorption (RSA) modeling method [16]. In order to ensure a continuity of reinforcements in any direction and a given reinforcement volume fraction, partial reinforcements beyond the boundaries of the model were chopped and moved in parallel to the interior of the model. In the RVE model, the hybrid reinforcements did not overlap and intersect with each other, and they were not in contact with the model boundary. The programming algorithm for generating random hybrid reinforcement distribution RVE is shown in Fig. 1.

Fig. 1 Flowchart of method to generate RVE model
The size of 3D RVE model is 1.0 ��m �� 1.0 ��m ��1.0 ��m. The diameter of SiC nanoparticle is 80 nm, while CNT is 40 nm in diameter and 800 nm in length. Cohesive elements with 2 nm in thickness are introduced along the interfaces to simulate interface behavior in the composites. Figure 2 shows two 3D microstructure models of the hybrid CNTs and SiC nanoparticles reinforced Mg alloy matrix composite with exactly same volume fraction and hybrid ratio. The two models both have a total volume fraction of 1% and a volume fraction ratio of 8:2 for CNTs and SiC nanoparticles. Figures 2(a-c) show random distributions of CNTs and SiC nanoparticles in the composite, while Figs. 2(d-f) show clustered distributions of CNTs and SiC particles in the composite. The degree of reinforcement clustering in the simulated microstructures was quantified by the coefficient of variance of the mean near- neighbor distance (COVd) technique [17]. The COVd is defined as: COVd=��d/d, where  is the variance in the mean near-neighbor distances of every particle, and d is the average of the mean near-neighbor distances for all particles. The higher the COVd is, the more ��clustered�� the distribution of the reinforcements is. YANG et al [18] claimed that it was a random particle distribution as the value of COVd approached to 0.36. Therefore, Figs. 2(c) and 2(f) show a random distribution and a clustered distribution, respectively.
3D dynamic simulation based on the RVE model was performed using ABAQUS/Explicit. The matrix was meshed with 4-node linear tetrahedron (C3D4) elements, and the cohesive and reinforcements were meshed with 8-node brick (C3D8R) elements. The meshes of the reinforcements were refined to ensure numerical accuracy. The minimum mesh size of 8 nm was chosen for SiC nanoparticles, while the minimum mesh size of 4 nm along the radial direction and 20 nm along the axis direction were chosen for CNTs. The model comprised of 655112 tetrahedral elements, 30339 hexahedral elements and 161627 nodes in Fig. 2(b).
2.2 Material properties and interface cohesion parameters
The material parameters used in the dynamic simulation are given in Tables 1-4. Table 1 and Table 2 present the Johnson-Cook (J-C) constitutive model parameters [19] for hot extruded AZ91D Mg alloy and material parameters for AZ91D at different temperatures, respectively; while Table 3 and Table 4 list material parameters for CNTs [20-22] and SiC nanoparticles [23], respectively.
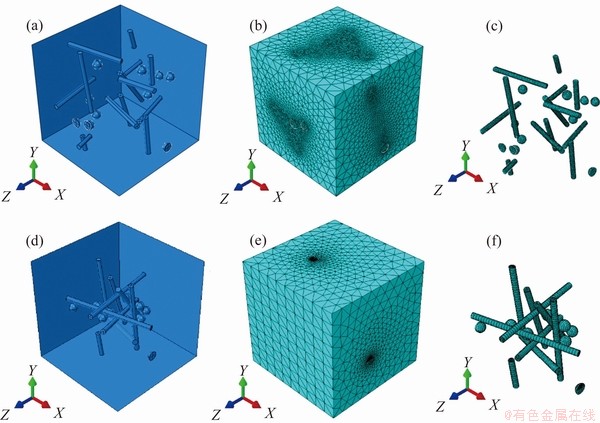
Fig. 2 RVE model (a) and FE mesh models (b) of composites and hybrid reinforcements with random distribution (COVd=0.38) (c); RVE model (d) and FE mesh models of composites (e) and hybrid reinforcements with clustered distribution (COVd=0.72) (f) (Two models have the fixed total volume fraction of 1% and fixed volume fraction ratio of CNTs to SiC nanoparticles of 8:2)
Table 1 Johnson-Cook parameters for extruded AZ91D magnesium alloy

Table 2 Material parameters for AZ91D magnesium alloy

Table 3 Material parameters for CNTs

Table 4 Material parameters for SiC

The cohesive behavior for the interfaces between Mg matrix and reinforcements was described by the cohesive model based on our earlier molecular dynamics simulations. The cohesive parameters [24,25] are listed in Table 5.
Table 5 Cohesive zone model parameters

2.3 Boundary conditions and loads
In the dynamic tensile simulation at elevated temperature, the solution of the finite element RVE model was carried out by applying a predefined temperature field on it since the temperature on the model was uniform. Because all planes in the RVE model must maintain a flat surface during the deformation caused by external loads, appropriate periodical boundary conditions were imposed to the RVE faces. The boundary conditions can be expressed as follows:
u(0, y, z)=u(0, 0, 0) on x=0 (1)
u(a, y, z)=u(a, 0, 0) on x=a (2)
v(x, 0, z)=v(0, 0, 0) on y=0 (3)
v(x, a, z)=v(0, a, 0) on y=a (4)
w(x, y, 0)=0 on z=0 (5)
 (6)
(6)
where u, v and w are the displacements of the node in the x, y and z directions, respectively.  ,
,  and
and  are the speeds of the node in the x, y and z directions, respectively.
  is the strain rate for the specimens deformed in dynamic tension simulation based on the model, and a is the original length of the cubic RVE model.
3 Calculation results and discussion
3.1 Effect of reinforcement volume fraction and hybrid ratio

Fig. 3 Stress-strain curves of Mg matrix hybrid nanocomposites with different total reinforcement volume contents and volume fraction ratio of CNTs to SiC nanoparticles of 8:2 at 100 ��C and strain rate of 1000 s-1
Figure 3 shows the stress-strain curves of the Mg matrix hybrid nanocomposites reinforced with different total volume contents and volume fraction ratio of CNTs to SiC nanoparticles of 8:2 at a temperature of 100 ��C and a strain rate of 1000 s-1 based on the random reinforcement distribution model. As can be seen in Fig. 3, flow stresses of the composites increase slightly with the increment of the volume fraction of hybrid reinforcements. Figure 4 shows the von Mises stress contours in the random distribution RVE model for the Mg matrix nanocomposites containing 1.0 vol% reinforcement under the same conditions at the final moment. It is shown that the stress range distributions within the nanocomposites (Figs. 4(a, b)) lie between the AZ91D matrix alloy (Fig. 4(c)) and hybrid reinforcements (Fig. 4(d)). A gradient of the stress distribution from the matrix to the interface and then to the hybrid nano-reinforcements is observed for the model. The maximum stress of 7556 MPa is found to occur at the surface of the CNTs oriented approximately 45�� from the directions of tensile loading. Although the stress concentration at the SiC nanoparticles is much lower than that in the CNTs, it should be noted that the SiC nanoparticle reinforcements can significantly increase the matrix mechanical strength by more effectively promoting the dislocation aggregation in the Mg alloy matrix and the matrix grain refinement [26]. This shows that stress transfer between matrix and hybrid reinforcements happens during the deformation of matrix. In addition, the stress in matrix is more uniform than that in the hybrid reinforcements except at the neighboring region of the reinforcement�Cmatrix interface.
The stress-strain curves of the Mg matrix nanocomposites with random reinforcement distributions and different volume fraction ratios of hybrid CNTs to SiC nanoparticles at different temperatures and strain rates are shown in Fig. 5, in which the table lists the critical mechanical properties of the hybrid nanocomposites. It can be found from Fig. 5 that although the total volume fraction of reinforcements is the same, the mechanical properties of the composites with different hybrid ratios are different. When the hybrid volume fraction ratio of CNTs to SiC nanoparticles is 8:2 and 7:3, the mechanical properties of the composites are closed to each other. However, when the hybrid volume fraction ratio of CNTs to SiC nanoparticles is 2:8 and 4:6, the mechanical properties of the composites are relatively poor. Because the total volume fraction of reinforcements is small, the stress-strain curves of the composites with different hybrid volume ratios are slightly different. But, it still can be found that the mechanical properties of the composites are better at the same strain rate and different temperatures (Figs. 5(a, b) and Figs. 5(c, d)) or at the same temperature and different strain rates (Figs. 5(a, c) and Figs. 5(b, d)) when the hybrid volume fraction ratio of CNTs to SiC nanoparticles is in the range from 7:3 to 8:2. This shows that the CNTs play a dominant enhancement role, while the synergistic effect [27] of the hybrid reinforcements and competition between temperature softening and strain rate hardening also have important influence on the mechanical properties of the composites.

Fig. 4 von Misses stress contours in model for Mg matrix nanocomposites containing 1% total reinforcement volume fraction and volume fraction ratio of CNTs to SiC nanoparticles of 8:2 at 100 ��C and strain rate of 1000 s-1

Fig. 5 Stress-strain curves of composites with different volume fraction ratios of CNTs to SiC nanoparticles at different temperatures and strain rates

Fig. 6 Stress-strain curves of composites with 1% total volume fraction of single and hybrid reinforcemts at 25 ��C and 1000 s-1
As shown in Fig. 6, AZ91D alloy based hybrid nanocomposites with random reinforcement distributions displays obvious hybrid reinforcement effect at room temperature and higher strain rate. The tensile flow stress and yield strength of the AZ91D Mg matrix hybrid composites are enhanced compared with single form of SiC or CNT reinforced Mg matrix composites under the same reinforcement volume fraction condition. This is because when hybrid CNTs and SiC nanoparticle reinforcements with suitable volume ratio are incorporated in the Mg matrix, the van der Waals attractive forces between the same kinds of nanosized reinforcements will be reduced and thus the homogeneous dispersion of hybrid reinforcements is improved. However, the hybrid reinforcement is entangled with each other due to the CNT with the increased CNT content in the hybrid reinforcement. In addition, higher hybrid ratio of CNTs to SiC nanoparticles in the present work is also beneficial for the enhanced synergistic strengthening of hybrid reinforcements by dominant load-transferring of CNT and load-bearing of SiC nanoparticles, and for their interfacial bonding with magnesium alloy matrix [11].
3.2 Temperature effect
Fig. 7 shows the stress-strain curves of Mg matrix hybrid nanocomposites with random reinforcement distributions and total volume fraction of 1% and volume fraction ratio of CNTs to SiC nanoparticles of 8:2 at different temperatures and a strain rate of 1000 s-1. It can be seen that the flow stresses of the Mg matrix nanocomposites decrease with the increase of temperature, showing the obvious temperature softening effect of the composites. Figure 8 shows the corresponding von Mises stress contours in the Mg matrix nanocomposites. It can also be seen that the maximum stress in the composites (Figs. 8(a, b)) is 7461 MPa, while the maximum stress in the matrix alloy (Fig. 8(c)) is 455.6 MPa. The average value of the maximum stress in hybrid CNTs and SiC nanoparticles is significantly higher than that in the matrix, indicating that the composites still have good load bearing capacity even at higher temperatures (200 ��C) due to the presence of a suitable proportion of hybrid reinforcement and their synergistic effect.

Fig. 7 Stress-strain curves of Mg matrix hybrid nanocomposites with total reinforcement volume fraction of 1% and volume fraction ratio of CNTs to SiC nanoparticles of 8:2 at different temperatures and strain rate of 1000 s-1

Fig. 8 von Misses stress contours in model for Mg matrix hybrid nanocomposites containing total reinforcement volume fraction of 1% and volume fraction ratio of CNTs to SiC nanoparticles of 8:2 at 200 ��C and strain rate of 1000 s-1
3.3 Effect of strain rate
Figure 9 shows the stress-strain curves of Mg matrix hybrid nanocomposites with random reinforcement distributions and total volume fraction of 1% and volume fraction ratio of CNTs to SiC nanoparticles of 8:2 at 100 ��C and different strain rates. As can be seen in Fig. 9, dynamic tensile properties of the composites are not sensitive to the changes in strain rates when strain rate is increased from 500 to 1000 s-1. However, the flow stresses of the composites increase with the increase of strain rates when the strain rate is larger than 1000 s-1. The positive dependence of the flow stress on the strain rate may be associated with slip along non-basal planes and the increasing strengthening effect of added hybrid nanoreinforcements with strain rate. In particular, the flow stress of the composites reaches the maximum value when the strain rate is 3000 s-1.
4 Validation of numerical simulation

Fig. 9 Stress-strain curves of Mg matrix hybrid nanocomposites with total reinforcement volume fraction of 1% and volume fraction ratio of CNTs to SiC nanoparticles of 8:2 at 100 ��C and different strain rates
To further verify the accuracy and applicability of simulation models, the simulation results were compared with the experimental results. During dynamic tensile test, the AZ91D alloy based hybrid composites with total reinforcement volume fraction of 1.0 % and volume ratios of CNTs to SiC nanoparticles of 8:2 were fabricated by using self-designed semisolid stirring assisted ultrasonic cavitation and subsequent hot extrusion processes [11]. The tensile test specimens for the AZ91D alloy based hybrid nanocomposites were wire-cut from the extruded rods with their axes parallel to the extrusion direction and were machined into dog-bone geometry with a gauge length of 10 mm and a diameter of 4 mm. The dynamic tensile properties of the hybrid composite specimens at different temperatures were tested by using a SHTB set-up (Fig. 10) with a heating device. The typical macroscopic fracture morphology of the composite specimen after high-temperature dynamic tensile test is shown in Fig. 11.
The theoretical analysis model of the split Hopkinson tensile bar techniques is based on one-dimensional stress wave theory [28]. According to the one-dimensional theory of the linear elasticity stress wave and its hypothesis in which the stress and strain are assumed to be uniform in the hybrid nanocomposites, i.e. the wave propagation in composite specimen can be ignored, continuous records of the mean stress ��s(t) vs time, strain ��s(t) vs time, and strain rate  vs time can be simultaneously recorded. Thus, the stress-strain relationships of the composite specimens at different strain rates can also be obtained:
 (7)
(7)
 (8)
(8)
 (9)
(9)
where E, A,  and �� denote the elastic modulus, cross section area, sound speed and density of the bars, respectively, which are supposed to be identical; while As and ls represent respectively the initial cross section area and the length of the composite sample. The incident strain wave generated upon impact is represented by ��i, ��r is the reflected one and ��t is the transmitted one. If the sample deforms uniformly and is in dynamic equilibrium, there exists a relationship among the three, i.e. ��i(t)+��r(t)=��t(t) [29].

Fig. 10 Schematic diagram of SHTB apparatus with heating system

Fig. 11 Fracture surface macrophotograph of tensile specimen at strain rate of 1000 s-1 and temperature of 100 ��C
Figure 12 shows comparisons between model predictions and macroscopically-measured tensile stress-strain curves of the composites at different temperatures and strain rates. Figure 12(a) shows the stress-strain curves obtained from the finite element simulations based on the random distribution model and the real experiments at elevated temperatures (100, 150 and 200 ��C) and a strain rate of 1000 s-1. It can be found from Fig. 12(a) that the experimental results are slightly higher or lower than those obtained by numerical simulation, but the deviation is relatively small. For example, agreement between the numerical and experimental data is fairly good at the temperature of 150 ��C and strain rate of 1000 s-1. Figure 12(b) illustrates the stress-strain curves obtained from the two finite element simulations based on the random and clustered distribution models and the experiment data at 150 ��C and 1000 s-1. From Fig. 12(b), it can be seen that the model with random reinforcement distributions has higher ultimate tensile stress and strain to failure, which is closer to the experimental result. However, there are considerable differences in the strain to failure and failure stress between the simulated result based on the clustered distribution model and the experimental result, due to the weakening effect of reinforcement clustering on matrix. Figure 12(c) shows comparison between numerical predictions based on the random distribution model and experimental results at room temperature and a strain rate of 1500 s-1. As can be seen in Fig. 12(c), the experimental values are slightly higher than those obtained by numerical simulation in the initial stage, but the experimental results are in good agreement with the numerical predictions after yielding. This demonstrates that numerical simulation results are reasonable and credible within a certain range of error although there is some deviation between numerical predictions and experimental results.
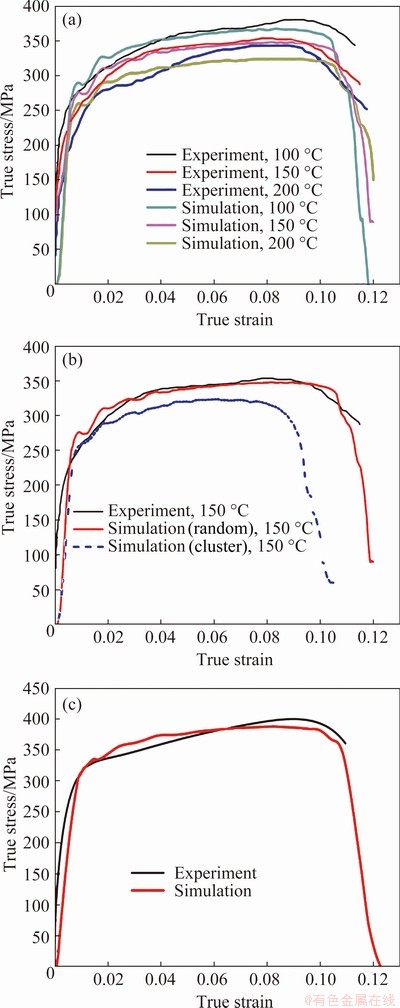
Fig. 12 Comparison between predictions of random distribution model and experiment results at different temperatures and 1000 s-1 (a), between predictions of random and clustered distribution models and experiment result at 150 ��C and 1000 s-1 (b), and between simulation result obtained from random distribution model and experiment result at room temperature (25 ��C) and 1500 s-1 (c)
Figure 13 shows the von Misses stress contour and equivalent plastic strain contour at ��=0.12 obtained from the random distribution model of Mg matrix hybrid nanocomposites containing total reinforcement volume fraction of 1% and volume fraction ratio of CNTs to SiC nanoparticles of 8:2 at 100 ��C and strain rate of 1000 s-1. It is shown that the microcracks initiate from the interface and propagate in the matrix near to the interface during plastic deformation. When the microcracks are connected due to continuous increase in external loading, the curved cleavage crack with secondary cracks is finally formed in the composite.
In addition, it can also be seen from the contour of the composite that the fracture morphology shows quasi-cleavage river pattern with secondary cracks, which is similar to those observed from SEM images in Fig. 14. However, a mixed fracture characteristic of brittle and ductile with a small quantity of dimples is noted from Fig. 14(b) on fractographs of local region in the composites. This may be related to the coupled effects of nano-reinforcement strengthening, temperature softening and strain rate hardening.

Fig. 13 von Misses stress contour (a) and equivalent plastic strain contour (b) at ��=0.12 in random distribution model for Mg matrix hybrid nanocomposites containing total reinforcement volume fraction of 1% and volume fraction ratio of CNTs to SiC nanoparticles of 8:2 at 100 ��C and strain rate of 1000 s-1
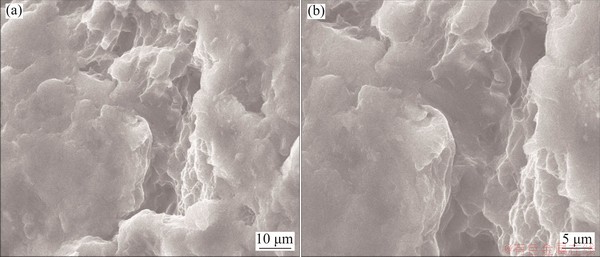
Fig. 14 SEM micrographs of fracture surfaces of AZ91D Mg-based composite containing total reinforcement volume fraction of 1.0% and volume fraction ratio of CNTs to SiC nanoparticles of 8:2 at 100 ��C and strain rate of 1077 s-1
5 Conclusions
(1) The dynamic response of the Mg based hybrid nanocomposite is influenced by its microstructure and dynamic loading conditions. The Mg matrix hybrid composites exhibit improved dynamic performance when the total volume fraction of reinforcements is 1.0% and the volume fraction ratio of CNTs to SiC nanoparticles is in the range from 7:3 to 8:2. This may be mainly attributed to the significant role in CNT load transfer and the synergistic effect of hybrid nano-reinforcements.
(2) When the strain rate is larger than 1000 s-1, the composites show positive strain rate sensitivity with the increase of strain rate, but the increase in strain rate sensitivity is relatively slowly.
(3) The dynamic mechanical properties of the composites decrease with the increase of temperature, which shows the temperature softening effect of the composites.
(4) The simulation results show good agreement with the experimental data, validating the effectiveness of the method proposed in the present work.
Acknowledgments
The authors are grateful for the financial supports from the National Natural Science Foundation of China (11672055, 11272072).
References
[1] AKINWEKOMI A D, LAW W C, TANG C Y, CHEN L, TSUI C P. Rapid microwave sintering of carbon nanotube- filled AZ61 magnesium alloy composites [J]. Composites Part B, 2016, 93: 302-309.
[2] SRIVATSANT S, GODBOLE C, QUICK T, PARAMSOTHY M, GUPTA M. Mechanical behavior of a magnesium alloy nanocomposite under conditions of static tension and dynamic fatigue [J]. Journal of Materials Engineering and Performance, 2013, 22: 439-453.
[3] HE Xu, LIU Jin-ling, AN Li-nan. The mechanical behavior of hierarchical Mg matrix nanocomposite with high volume fraction reinforcement [J]. Materials Science and Engineering A, 2017, 699: 114-117.
[4] HE Xu, SONG Shu-tao, LUO Xi, LIU Jin-ling, AN Li-nan, BAI Yuan-li. Predicting ductility of Mg/SiCp nanocomposite under multiaxial loading conditions based on unit cell modeling [J]. International Journal of Mechanical Sciences, 2020, 184: 105831.
[5] DAREINI M, JABBARI A H, SEDIGHI M. Effect of nano-sized Al2O3 reinforcing particles on uniaxial and high cycle fatigue behaviors of hot-forged AZ31B magnesium alloy [J]. Transactions of Nonferrous Metals Society of China, 2020, 30: 1249-1266.
[6] HABIBI M K, POURIAYEVALI H, HAMOUDA A M S, GUPTA M. Differentiating the mechanical response of hybridized Mg nano-composites as a function of strain rate [J]. Materials Science and Engineering A, 2012, 545: 51-60.
[7] SHEN J H, YIN W H, WEI Q M. Effect of ceramic nanoparticle reinforcements on the quasistatic and dynamic mechanical properties of magnesium-based metal matrix composites [J]. Journal of Materials Research, 2013, 28: 1835-1852.
[8] FENG F, HUANG S Y, MENG Z H, HU J H, LEI Y, ZHOU M C, YANG Z Z. A constitutive and fracture model for AZ31B magnesium alloy in the tensile state [J]. Materials Science and Engineering A, 2014, 594: 334-343.
[9] CHEN Lian-yi, XU Jia-quan, CHOI Hongseok, POZUELO M, MA Xiao-long, BHOWMICK S, YANG Jenn-ming, MATHAUDHU S, LI Xiao-chun. Processing and properties of magnesium containing a dense uniform dispersion of nanoparticles [J]. Nature, 2015, 528: 539-543.
[10] CHEN Y, GUO Y B, GUPTA M. Dynamic tensile response of magnesium nanocomposites and the effect of nanoparticles [J]. Materials Science and Engineering A, 2013, 582: 359-367.
[11] ZHOU X, SU D P, WU C W. Tensile mechanical properties and strengthening mechanism of hybrid carbon nanotube and silicon carbide nanoparticle-reinforced magnesium alloy composites [J]. Journal of Nanomaterials, 2012, 2012: 851862.
[12] MENG Q H, WANG Z Q. Prediction of interfacial strength and failure mechanisms in particle-reinforced metal-matrix composites based on a micromechanical model [J]. Engineering Fracture Mechanics, 2015, 142: 170-183.
[13] ZHANG J T, LIU L S, ZHAI P C. The prediction of the dynamic responses of ceramic particle reinforced MMCs by using multi-particle computational micro-mechanical method [J]. Composites Science and Technology, 2007, 67: 2775-2785.
[14] YIM S O, LEE W J, CHO D H. Finite element analysis of compressive behavior of hybrid short fiber/particle/Mg metal matrix composites using RVE model [J]. Metals and Materials International, 2015, 21: 408-414.
[15] DASTGERDI J N, ANBARLOOIE B, MARZBAN S. Mechanical and real microstructure behavior analysis of particulate reinforced nanocomposite considering debonding damage based on cohesive finite element method [J]. Composite Structures, 2015, 122: 518-525.
[16] ZHOU J M, QI L H, GOKHALE A M. Generation of three-dimensional microstructure model for discontinuously reinforced composite by modified random sequential absorption method [J]. Journal of Engineering Materials and Technology, 2016, 138: 021001.
[17] AYYAR A, CRAWFORD G A, WILLIAMS J J. Numerical simulation of the effect of particle spatial distribution and strength on tensile behavior of particle reinforced composites [J]. Computational Materials Science, 2008, 44: 496-506.
[18] YANG N, BOSELLI J, SINCLAIR I. Simulation and quantitative assessment of homogeneous and inhomogeneous particle distributions in particulate metal matrix composites [J].Journal of Microscopy, 2001, 201: 189-200.
[19] SONG Shang-yu. Interfacial mechanical properties and dynamic tensile behavior simulation of magnesium matrix nanocomposites [D]. Dalian, China: Dalian University of Technology, 2017. (in Chinese)
[20] KIM S H, MULHOLLAND G W, ZACHARIAH M R. Density measurement of size selected multiwalled carbon nanotubes by mobility-mass characterization [J]. Carbon, 2009, 47: 1297-1302.
[21] YU M F, LOURIE O, DYER M J. Strength and breaking mechanism of multiwalled carbon nanotubes under tensile load [J]. Science, 2000, 287: 637-640.
[22] LI Wei-xue, ZHANG Hu-jun, DAI Jian-feng. Finite element analysis of thermal residual stresses in magnesium matrix composite reinforced by carbon nanotubes [J]. Acta Materiae Compositae Sinica, 2011, 28: 166-171. (in Chinese)
[23] LIU J. Experimental study and modeling of mechanical micro-machining of particle reinforced heterogeneous materials [D]. America: University of Central Florida, 2012.
[24] ZHOU X, BU W M, SONG S Y, SANAOZ F, HUANG X R. Multiscale modeling of interfacial mechanical behaviours of SiC/Mg nanocomposites [J]. Materials & Design, 2019, 182: 108093.
[25] ZHOU X, LIU X, SANSOZ F, SHEN M. Molecular dynamics simulation on temperature and stain rate-dependent tensile response and failure behavior of Ni-coated CNT/Mg composites [J]. Applied Physics A, 2018, 124: 506.
[26] WANG Z H, WANG X D, ZHAO Y X. SiC nanoparticles reinforced magnesium matrix composites fabricated by ultrasonic method [J]. Transactions of Nonferrous Metals Society of China, 2010, 20: 1029-1032.
[27] SZELUGA U, KUMANEK B, TRZEBICKA B. Synergy in hybrid polymer/nanocarbon composites: A review [J]. Composites Part A, 2015, 73: 204-231.
[28] SONG W D, NING J G, MAO X N. A modified Johnson�CCook model for titanium matrix composites reinforced with titanium carbide particles at elevated temperatures [J]. Materials Science and Engineering A, 2013, 576: 280-289.
[29] HASENPOUTH D. Tensile high strain rate behavior of AZ31B magnesium alloy sheet [D]. Canada: University of Waterloo, 2010.
�� ϼ1�����ӷ�1���� ��1�����Ƿ�2
1. ����������ѧ ������ѧϵ ��ҵװ���ṹ���������ص�ʵ���ң����� 116024��
2. �氣��������̼�������˾����̨ 264003
ժ Ҫ��������ά������Ԫ�����������ǽ����ھ�������̼���ܺ�����SiC������ǿAZ91Dþ�Ͻ�����ϲ�����25~300 ��C��̬������Ӧ������ά��ֵģ�⣬����ģ������ʵ�����ݽ��бȽϡ�����������ڲ�ͬ�¶��£��������ϲ������嶯̬������������̼���ܺ�����SiC����������������ͻ�����������ȵ����Ӷ���ߡ������������Ϊ1.0%������£���̼���ܺ�����SiC�����Ļ��������Ϊ7:3~8:2ʱ������ǿ��ЧӦ���þ�����������ϲ����ڸ��¶��غ������±��ֳ�����Ӧ����Ӳ�����¶�����ЧӦ��ģ������ʵ�������ǺϽϺá�
�ؼ��ʣ�þ�����ϲ��ϣ���������ǿ�壻��̬��ѧ���ܣ���ֵ����
(Edited by Bing YANG)
Corresponding author: Xia ZHOU; Tel: +86-411-84706782; Fax: +86-411-84708400; E-mail: zhouxia@dlut.edu.cn
DOI: 10.1016/S1003-6326(21)65525-5
1003-6326/ 2021 The Nonferrous Metals Society of China. Published by Elsevier Ltd & Science Press

