2.2.4 Zeta potential measurement
The zeta potential was measured with Zeta Plus from Brookhaven Instruments Corporation. Up to 0.1 g of anosovite (d<5 μm) was placed in a solution with a certain pH, and SHA was added to the solution. The solution was stirred for 10 min using a magnetic stirrer and then allowed to rest for 10 min. The pH of up to 1.5 mL of supernatant, pipetted by a sampler, was measured in a measurement cell; the ζ- potential was measured 10 times to calculate the average.
2.2.5 FTIR analysis
The potassium bromide squash method was used in the FTIR study. One gram of anosovite (d<5 μm) was added to the 40 mL SHA solution and stirred for 5 min. Subsequently, the suspensions were filtered and rinsed three times with deionized water. Finally, the samples were air-dried. The FTIR spectra (Tensor 27, Bruker, Germany) were recorded in the range of 400 to 4000 cm-1 with a spectral resolution of 4 cm-1 and a scan number of 10.
2.2.6 SEM-EDS analysis
Surface micromorphological characteristics were examined with a Quantan 200 scanning electron microscope (SEM; FEI, the Netherlands). Element contents were determined by Genesis 2000 energy dispersive spectroscopy (EDS; EDAX, USA). The preparation methods of the test samples used in the SEM-EDS analysis were consistent with the methods used in the FTIR analysis.
2.2.7 XPS analysis
The preparation methods of the test samples used in the XPS study were consistent with the methods used in the FTIR analysis. XPS analysis was conducted with a PHI 5000 Versa Probe II spectrometer (ULVAC-PHI, Japan) using an Al Kα irradiation X-ray source; the pressure in the analyser chamber was 1×10⁻⁸ Pa. MultiPak Spectrum software was used to analyse the spectra. C1s binding energy (284.8 eV) was used to calibrate the Ti2p3/2 and Ti2p1/2 peaks.
3 Results and discussion
3.1 Effect of pH and SHA dosage on anosovite flotability
The pulp pH and collector dosage are two major factors affecting mineral recovery in flotation, thus this study focuses on these two factors. The effect of pH on anosovite flotation recovery at a SHA dosage of 1×10⁻⁵ mol/L is shown in Figure 2. Results show that the recovery of anosovite in a neutral and weak alkaline environment is higher than that in acid and alkaline environment, especially in alkaline environment. The collecting ability of SHA for anosovite reduces in acid and alkaline environment; thus, the neutral and weak alkaline pH ranges are available for SHA to collect anosovite.
The effect of SHA dosage on the flotation recovery of anosovite at pulp pH=7 was studied, and the results are shown in Figure 3. As can be seen from Figure 3, with the increase of SHA dosage, the anosovite recovery gradually increases and then levels off. The recovery reaches a maximum of 93.26% when SHA dosage is 4×10⁻⁵ mol/L.

Figure 2 Effect of pH on flotation recovery of anosovite at SHA concentration of 1×10⁻⁵ mol/L

Figure 3 Effect of SHA dosage on flotation recovery of anosovite at pH=7
3.2 Adsorption amount of SHA on anosovite surface
The collector concentration before and after mineral adsorption is often measured to indirectly calculate the amounts of the collector adsorption on mineral surface. TOC method was employed in this study to calculate the concentration of SHA.
At a pH of 7, the adsorption amount of SHA on anosovite surface at different initial SHA concentrations were evaluated. Figures 4 and 5 show that the adsorption amount of SHA on anosovite surface increases when the initial concentration increases and then remains stable. The adsorption amount of anosovite to SHA was 0.32×10⁻⁵ mol/L to 0.38×10⁻⁵ mol/L, when the SHA initial concentration ranged from 2.12×10⁻⁵ mol/L to 6.33×10⁻⁵ mol/L.The adsorption amount of SHA becomes saturated when the initial concentration exceeds 2.12×10⁻⁵ mol/L, and the recovery of anosovite also leveled off at that point (Figure 3), thus proving that they are positively correlated.

Figure 4 SHA concentration in solution before and after anosovite adsorption
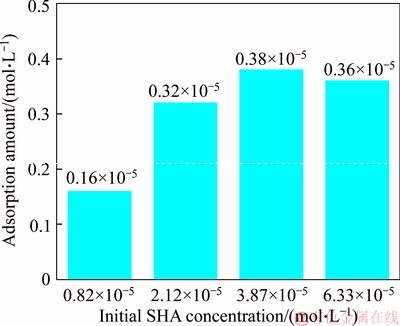
Figure 5 Adsorption amount of SHA at different initial concentrations
3.3 Solution chemistry and zeta potential
SHA dissociates in water as it is a weak acid. The ratio of undissociated SHA molecules to dissociated SHA ions depends on the pH of aqueous solution. The lgC– pH diagram of SHA solution is shown in Figure 6.
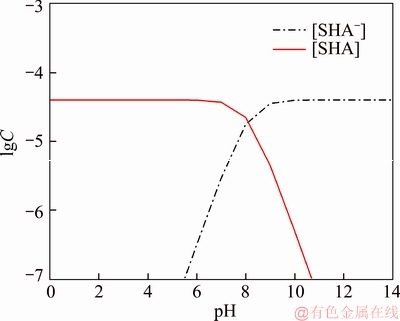
Figure 6 Relationship between lgC and pH of SHA solution components at CT of 4×10⁻⁵ mol/L
Figure 7 shows the zeta potential of anosovite in deionized water and in SHA solution at a concentration of 4×10⁻⁴ mol/L. The point of zero charge (PZC) is visible near pH 3.2. The zeta potential of the anosovite surface shifted toward negative direction in the presence of SHA, indicating that SHA adsorbed on the surface of the anosovite. At pH<3.2, the adsorption is expected as electrostatic adsorption or chemisorption, whereas at pH>3.2, the adsorption is expected as chemisorption. As can be seen from Figure 6, the concentrations of [SHA–] increase rapidly in a range of 7<pH<8.5. Therefore, the increasing level of anion adsorption on the anosovite surface leads to a decrease in zeta potential. The above analysis of the zeta potential results is further supported by flotation experiments (as shown in Figure 2). In a weak alkaline solution (7<pH<8.5), the higher anosovite recovery indicates that more collectors are adsorbed onto the anosovite surface.

Figure 7 Effects of SHA and pH on zeta potential of anosovite
3.4 FTIR spectra analysis
The FTIR was conducted at a SHA concentration of 1×10⁻² mol/L and pH=8. Figure 8 shows the FTIR spectra of SHA, and the FTIR spectra of the anosovite before and after reaction with SHA. SHA has many characteristic absorption peaks, which have been reported in the literature. The peak at 3289.20 cm-1 is due to the N–H stretching vibration peak. The peak at 1619.35 cm-1 is the C=O vibration peak. Benzene skeleton vibration is shown at 1518.68 and 1490.96 cm-1, and the peak at 1453.38 cm-1 is the C=C stretching vibration peak in benzene. The peaks at 1096.82 and 1039.39 cm-1 are the split peaks of N—O vibration.

Figure 8 FTIR spectra of anosovite before and after reaction with SHA
As shown in Figure 8, a new peak at 1402.24 cm-1 was detected after anosovite reacted with SHA, and this peak may be the characteristic peak of the benzene ring. In addition, a characteristic peak of anosovite at 1094.70 cm-1 moved to 1084.11 cm-1 after SHA adsorption due to N—O vibration, indicating that a chemical reaction occurred between the N—O bond and the atoms on the mineral surface.
3.5 SEM-EDS and XPS analysis
The experimental conditions used in SEM-EDS and XPS analysis were consistent with FTIR analysis. Figures 9 and 10 show the element distributions of anosovite surface after SHA adsorption. N element and C element were evenly distributed on the anosovite surface after reaction with SHA, indicating adsorbance. A peak of N element was detected in XPS broad scan spectra (Figure 11), further supporting SEM-EDS analysis. The binding energies of Ti2p before and after SHA adsorption are shown in Figure 12. The binding energies of Ti2p3/2 and Ti2p1/2 on the anosovite mineral surface were measured as 458.56 and 464.26 eV [20–22]. After conditioning anosovite with SHA, the binding energies of Ti2p changed from 458.56 and 464.26 eV to 458.84 and 464.54 eV, respectively, with energy differences of 0.28 eV. The change in Ti2p binding energy demonstrates that chemical adsorption occurred at the Ti sites on the anosovite surface. XPS analysis results are consistent with the FTIR spectra.
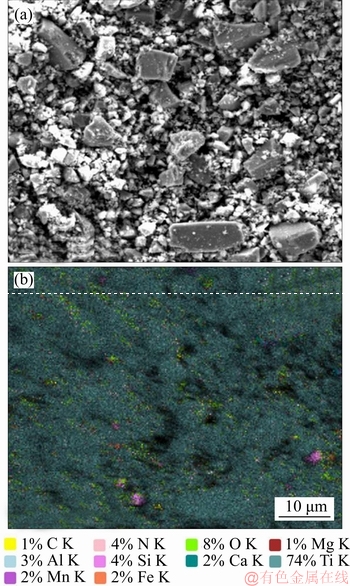
Figure 9 SEM images (a) and EDS spectrum (b) of anosovite surface after SHA adsorption

Figure 10 Distribution of N (a) and C (b) elements on mineral surface after SHA adsorption

Figure 11 XPS broad scan spectrum of anosovite after SHA adsorption

Figure 12 Ti2p XPS spectra of anosovite before and after SHA adsorption
4 Conclusions
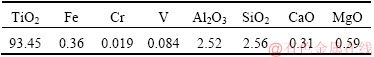
This work demonstrates the flotation behavior and adsorption mechanism of SHA to the artificial mineral anosovite. Analyses of the anosovite properties show that the TiO2 grade of the anosovite ore sample is 93.45%, and its chemical composition is Mg0.09Ti2.91O5. A neutral and weak alkaline environment (7<pH<8.5) is reasonable for SHA to collect anosovite. Furthermore, a maximum recovery of 93.26% can be acquired at an SHA dosage of 4×10⁻⁵ mol/L. TOC results indicate that the adsorption amount of SHA are positively correlated with flotation recovery. The zeta potential decreased to a negative direction largely at 7<pH<8.5 when the concentrations of [SHA–] increased rapidly. Moreover, FTIR and SEM-EDS analyses showed that SHA adsorption depends on chemisorptions. XPS studies further suggested that the chemical adsorption occurred at the Ti sites as a result of the change in the binding energy for Ti2p.
References
[1] SAMAL S. Synthesis and characterization of titanium slag from ilmenite by thermal plasma processing [J]. JOM, 2016, 68(9): 1–10.
[2] XUE Ya-zhou, WANG Xue-feng, WANG Hai-jun, LI Wen-chao. On comprehensive utilization of vanadium- titanium magnetite resources in Panzhihua-Xichang region of Sichuan province [J]. Chinese Land Resources Economy, 2017, 30(4): 9–13. (in Chinese)
[3] ZHANG Ying, FANG Zhi-gang Zak, XIA Yang, HUANG Zhe, LEFLER H, ZHAGN Tuo-yang, SUN Pei, FREE M L, GUO Jun. A novel chemical pathway for energy efficient production of Ti metal from upgraded titanium slag [J]. Chemical Engineering Journal, 2016, 286: 517–527.
[4] CHEN Xu-ling, HUANG Yun-song, FAN Xiao-hui, GAN Min. Oxidation roasting behavior and concretion properties of vanadium-titanium magnetite pellet [J]. Journal of Central South University: Science and Technology, 2016, 47(2): 359–366. (in Chinese)
[5] SUI Li-li, ZHAI Yu-chun, MIAO Li-hua. Recovery of titania from high titanium slag by roasting method using concentrated sulfuric acid [J]. Rare Metals, 2015, 34(12): 895–900.
[6] WAN He-li, XU Bao-qiang, DAI Yong-nian, YANG Bin, LIU Da-chun, SEN Wei. Preparation of titanium powders by calciothermic reduction of titanium dioxide [J]. Journal of Central South University, 2012, 19(9): 2434–2439.
[7] CHO J, ROY S, SATHYAPALAN A, ZENG W. Purification of reduced upgraded titania slag by iron removal using mild acids [J]. Hydrometallurgy, 2016, 161: 7–13.
[8] ZHENG Fu-qiang, CHEN Feng, GUO Yu-feng, JIANG Tao, TRAVYANOV A Y, QIU Guan-zhou. Kinetics of hydrochloric acid leaching of titanium from titanium- bearing electric furnace slag [J]. JOM, 2016, 68(5): 1476–1484.
[9] LASHEEN T A. Soda ash roasting of titania slag product from Rosetta ilmenite [J]. Hydrometallurgy, 2008, 93(3, 4): 124–128.
[10] SZCZE A, YAN Ying-di, CHIBOWSKI E,
  L, BANACH M. Properties of natural and synthetic hydroxyapatite and their surface free energy determined by the thin-layer wicking method [J]. Applied Surface Science, 2017, 434: 1232–1238.
[11] MA Jun-wei, SUI Zhi-tong, CHEN Bing-chen, NIE Yong-feng. Flotation behavior and mechanism on perovskite in Ti-bearing blast furnace slag [J]. Chinese Journal of Nonferrous Metals, 2002, 12(1): 171–177. (in Chinese)
[12] WANG Wei-qing, ZHU Yang-ge, ZHANG Shi-qiu, DENG Jie, HUANG Yang, YAN Wu. Flotation behaviors of perovskite, titanaugite, and magnesium aluminate spinel using octyl hydroxamic acid as the collector [J]. Minerals, 2017, 7(8): 134–152.
[13] MARABINI A M, BARBARO M. A study of the surface electrical properties of titanium oxide [J]. International Journal of Mineral Processing, 1980, 7(2): 159–166.
[14] MEHDILO A, IRANNAJAD M, REZAI B. Effect of crystal chemistry and surface properties on ilmenite flotation behavior [J]. International Journal of Mineral Processing, 2015, 137: 71–81.
[15] GRASS V, ISTOMIN P, NAZAROVA L. X-ray diffraction refinement of the crystal structure of anosovite prepared from leucoxene [J]. Crystal Research and Technology, 2009, 44(1): 117–122.
[16] GREY I E, CRANSWICK L M D, LI C, WHITE T J, BURSILL L A. New M3O5-anatase intergrowth structures formed during low-temperature oxidation of anosovite [J]. Journal of Solid State Chemistry, 2000, 150(1): 128–138.
[17] XIROUCHAKIS D, SMIRNOV A, WOODY K, LINDSLEY D H, ANDERSEN F J. Thermodynamics and stability of pseudobrookite-type MgTi2O5 (karrooite) [J]. American Mineralogist, 2002, 87(5, 6): 658–667.
[18] QIN Wen-qing, REN Liu-yi, XU Yang-bao, WANG Pei-pei, MA Xi-hong. Adsorption mechanism of mixed salicylhydroxamic acid and tributyl phosphate collectors in fine cassiterite electro-flotation system [J]. Journal of Central South University, 2012, 19(6): 1711–1717.
[19] FENG Qi-cheng, ZHAO Wen-juan, WEN Shu-ming, CAO Qin-bo. Activation mechanism of lead ions in cassiterite flotation with salicylhydroxamic acid as collector [J]. Separation and Purification Technology, 2017, 178: 193–199.
[20] ESKANDARLOO H, HASHEMPOUR M, VICENZO A, FRANZ S, BADIEI A, BEHNAJADY M A, BESTETTI M. High-temperature stable anatase-type TiO2 nanotube arrays: A study of the structure-activity relationship [J]. Applied Catalysis B: Environmental, 2016, 185: 119–132.
[21] HOANG S, BERGLUND S P, HAHN N T, BARD A J, MULLINS C B. Enhancing visible light photo-oxidation of water with TiO2 nanowire arrays via cotreatment with H2 and NH3: Synergistic effects between Ti3+ and N [J]. Journal of the American Chemical Society, 2012, 134: 3659–3662.
[22] LIU Jian, DUAN Xiu-lan, ZHANG Yang, LI Zi-qing, YU Fa-peng, JIANG Huai-dong. Growth, electronic structure and properties of Rb2Ti1.95Yb0.05(PO4)3 crystals [J]. Journal of Alloys & Compounds, 2016, 660: 356–360.
(Edited by HE Yun-bin)
中文导读
人造矿物黑钛石的浮选行为及水杨羟肟酸的吸附机理
摘要:浮选经常被应用于分离天然的有用矿物和脉石矿物,但是很少有研究聚焦于人造矿物的浮选。黑钛石作为钛渣中的主要矿物,是一种典型的人造矿物,可以通过浮选来富集。本文研究了黑钛石在水杨羟肟酸溶液中的浮选行为及吸附机理,重点研究了pH和水杨羟肟酸用量对黑钛石浮选性能的影响。纯矿物浮选试验结果表明,以水杨羟肟酸为捕收剂,黑钛石最佳的浮选区间是7<pH<8.5,当水杨羟肟酸的用量只有4×10⁻⁵mol/L时,黑钛石的回收率可以达到93.26%。另外,采用总有机碳分析、zeta电位、红外光谱分析、扫描电镜能谱分析、X射线光电子能谱分析等测试手段研究吸附机理。研究结果表明水杨羟肟酸在黑钛石表面是化学吸附,X射线光电子能谱分析显示化学吸附发生在Ti位点上。
关键词:黑钛石;水杨羟肟酸;浮选;吸附
Foundation item: Project(51090385) supported by the Major Program of the National Natural Science Foundation of China; Projects(121102000000160001, 121102000000170013) supported by the Ministry of Land and Resources Department Budget, China; Project(DD20179133) supported by the Geological Survey and Evaluation Project of China; Project(2018M641439) supported by China Postdoctoral Science Foundation
Received date: 2017-11-23; Accepted date: 2018-07-23
Corresponding author: WANG Yi-jie, PhD; Tel: +86-10-61592381; E-mail: yjwang2012@126.com; ORCID: 0000-0001-7918-8779


 Central South University Press and Springer-Verlag GmbH Germany, part of Springer Nature 2019