
��-pH diagram of V-Ti-H2O system during pressure acid leaching of converter slag containing vanadium and titanium
MU Wang-zhong, ZHANG Ting-an, DOU Zhi-he, L? Guo-zhi, LIU Yan
Key Laboratory of Ecological Utilization of Multi-metal Intergrown Ores of Ministry of Education,
School of Materials and Metallurgy, Northeastern University, Shenyang 110819, China
Received 30 October 2010; accepted 27 May 2011
Abstract: To analyze the thermodynamic characteristics of leaching process of converter slag, ��-pH diagram of V-Ti-H2O system at oxygen partial pressure of 0.5 MPa, ionic mass concentration of 0.1 mol/kg and temperatures ranging from 60 to 200 ��C was obtained by recently published critically assessed standard Gibbs energies and activity coefficients of various species. When pH<2, stable regions of V3+, VO2+ and VO2+ exist in the stable region of TiO2. The pH values of stable regions of vanadium and titanium decrease and redox potentials become more positive with the temperature increasing. Vanadium and titanium could be separated by one-step leaching based on thermodynamics. The experiment results of pressure acid leaching of converter slag show that leaching rates of vanadium and titanium are 96.87% and 8.76% respectively, at 140 ��C of temperature, 0.5 MPa of oxygen partial pressure, 0.055-0.075mm of particle size, 15:1 of liquid to solid ratio, 120 min of leaching time, 500 r/min of stirring speed and 200 g/L of initial acid concentration. Vanadium and titanium could be selectively separated in the pressure acid leaching process, and the experiment result is in agreement with thermodynamic calculation result.
Key words: ��-pH diagram; V-Ti-H2O system; pressure acid leaching; converter slag; vanadium; titanium
1 Introduction
Vanadium is an important product which is used almost exclusively in ferrous and non-ferrous alloys due to its physical properties such as high hardness, large tensile strength, and good fatigue resistance. The vanadium ends up normally in the converter steel slag containing 3%-10% vanadium, which is the world��s principal raw material for vanadium production [1-2].
Vanadium-bearing converter slag is treated by several methods, such as sodium salt roasting-low acidity leaching [3] or water leaching [4], oxidizing roasting-alkaline leaching [5] or low acidity leaching [6], calcium salt roasting-acidity leaching [7] or alkaline leaching [8]. Traditional roasting-leaching process has two main disadvantages: low recovering rate of vanadium and severe impact on the environment [9-10]. Pressure acid leaching process, which cancels the roasting step, is used to extract vanadium from converter slag in an environmental and economical way.
Thermodynamic diagrams provide a rapid and reliable method for visual assessment of equilibrium behavior and reaction feasibility [11]. ��-pH diagram of V-H2O system is mainly reported at atmospheric pressure and normal temperature (25 ��C, 0.1 MPa) at present [12]. At the mean time, ��-pH diagram of Ti-H2O system has been reported at elevated temperature [13], but it is a single system and V-Ti-H2O system described for pressure leaching process of converter slag has never been covered. Variation tendency of stable regions of dissolved ionics of vanadium and titanium has the originally thermodynamic guidance on experiment process.
2 Thermodynamics
2.1 Method
A brief method for construction of ��-pH diagram, which could be constructed from the stoichiometry of reactions and free energy data for the species involved. Either the van��t Hoff isotherm or Nernst equation was utilized for the determination of the equilibrium lines of reactions.
The calculation required to obtain the ��-pH diagram was based upon the general equilibrium equations for an aqueous system containing vanadium and titanium. The basic equation of reactions was shown as formula (1), ��T and pH for this equation could be calculated as formulas (2) and (3):
aAb+nH++Ze=bBa+cH2O (1)

 (2)
(2)
 (3)
(3)
Values of ��T�� were determined according to Nernst equation, ��-pH diagram was obtained based on formulas (2) and (3) sequently, and free energy data of high temperature were required by formula (4) [14]. Values of A, D, ��, ��, �� and free energy at 298 K could be required from Refs. [12-13, 15].
 (4)
(4)


Average activity coefficients of electrolyte changed with temperature variation. According to Ref. [16], Debye�CH��ckel equation, as formula (5), was used to estimate average activity coefficient at high temperature, where ���� is average activity coefficient of electrolyte in the solution (calculated by the form of mass concentration), I is ionic strength which could be calculated as formula (6), AT is a constant which changed with temperature increasing (see Table 1), z+ and z- are number of positive and negative ion, respectively.
 (5)
(5)
 (6)
(6)
Table 1 AT values at different temperatures

In this work, Davids equation was used to calculate the average activity coefficient of electrolyte at 25 ��C, shown as formula (7). This equation, with average error of 1.6%, is the widely used method [17].
 (7)
(7)
2.2 ��-pH diagram of V-H2O system
According to the thermodynamic data in Refs. [12-13, 15], GT�� of substance in V-H2O system could be calculated as formula (3) at 25, 60, 100, 150 and 200 ��C, then ?GT�� of different reactions could be obtained according to ?GT��=��G��T,P-��G��T,R. Values of ���� and pH�� at different temperatures are listed in Tables 2-3. The activity coefficients of substance in V-H2O system at different temperatures are listed in Table 4.
 (8)
(8)
 (9)
(9)
Due to the different types of reaction in V-H2O system, the expressions of �� and pH were calculated by formula (2) or (3) and then ��-pH diagram of V-H2O system (Fig. 1) was realized at oxygen partial pressure of 0.5 MPa, ionic mass concentration of 0.1 mol/kg, and temperatures of 60, 100, 150 and 200 ��C.
Vanadium exists as oxides in the stable region of water. V3+, VO2+ and VO2+ exist in the acid solution of pH<2, HVO42-, HV2O5- and VO43- exist in the alkaline solution of pH>8. The stable regions approved the feasibility of acid/alkali leaching of converter slag.
Thermodynamics of pressure acid leaching of converter slag were studied, the variation condition of soluble vanadium ionic at the acid situation was the main object of investigation. ���� of V3+, which is -0.211 V at 60 ��C, becomes more negative with increasing temperature to -0.062 1 V at 200 ��C. pH�� values of stable regions of V3+, VO2+ and VO2+ composed of reactions 19, 20 and 22 decrease from 1.64, 1.615 and -1.030 to 0.198, 0.283 and -1.606, respectively. Based on thermodynamic principle, increasing temperature is adverse for the leaching process, redox potentials and initial acid concentration need to be much higher. Consequently, it is possibly due to the kinetic control, the experiment needs to proceed at high temperature to ensure a rapidly leaching speed.
2.3 ��-pH diagram of Ti-H2O system
The method of drawing ��-pH diagram of Ti-H2O system was the same as V-H2O system. Values of ���� and pH�� of Ti-H2O system at different temperatures are shown in Tables 5-6, and activity coefficients are listed in Table 7. ��-pH diagram of Ti-H2O system (Fig.2) were obtained at oxygen partial pressure of 0.5 MPa, ionic mass concentration of 0.1 mol/kg, and temperatures of 60, 100, 150 and 200 ��C.
Table 2 ���� of reactions in V-H2O system at high temperature (V)

Table 3 pH�� of reactions in V-H2O system at high temperature

Table 4 Activity coefficients of substance in V-H2O system at high temperature


Fig. 1 ��-pH diagram of V-H2O system at different temperatures: (a) 60 ��C; (b) 100 ��C; (c) 150 ��C; (d) 200 ��C
Table 5 ���� of reactions of Ti-H2O system at high temperature (V)
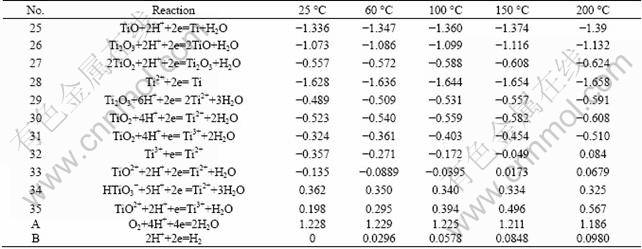
Table 6 pH�� of reactions of Ti-H2O system at high temperature

Table 7 Activity coefficients for substances in Ti-H2O system at high temperature

Based on Fig.2, reactions occurring by dissoluble titanium oxides are expressed as solid line, and by soluble titanium ionics are dotted line respectively. Stable regions of TiO2+ and HTiO3- (formed by dotted line) exist in the stable region of water when only soluble titanium ionics exist in the solution. This is hydrolysis reaction of titanium, which can proceed at low acid concentration and high temperature, due to the fact that pH values become less positive from 4.432 at 60 ��C to 1.829 at 200 ��C.
Titanium mainly exists as oxides in the converter, so a stable region of TiO2 mainly exists in the stable region of water, and regions of ionics dissolved from oxides. For example, Ti3+ and Ti2+ are seldom in the region of water. The oxide is thermodynamically stable in almost any noncomplexing aqueous solution from strong acid to strong alkali. Stable region of TiO2- exists at pH<2, which is outside the pH range of this study. Thermodynamically, there are only a small amount of Ti3+ in the leachate but most exist as TiO2 in the slag during the pressure acid leaching process of converter slag. TiO2- would exist at a high acid concentration. Based on thermodynamic principle, titanium can be enriched in the residue as TiO2.

Fig. 2 ��-pH diagram of Ti-H2O system at different temperatures: (a) 60 ��C; (b) 100 ��C; (c) 150 ��C; (d) 200 ��C
���� of Ti3+ dissolved from TiO2 is -0.271V at 60 ��C and becomes more positive with increasing temperature to 0.084 V at 200 ��C. The area of stable region of Ti3+, which entered into stable region of water, enlarges gradually. Based on thermodynamics principle, increasing temperature, which tends to improve TiO2 dissolution at the same oxygen partial pressure and acid concentration, is adverse for selective separation of vanadium and titanium. At the same time, the reaction speed and leaching rate of titanium arise with the increasing temperature. Consequently, leaching temperature cannot be too high to keep titanium stable in the residue.
2.4 ��-pH diagram of V-Ti-H2O system
Due to the ��-pH expressions of V-H2O system and Ti-H2O system, ��-pH diagram of V-Ti-H2O system (Fig. 3) was obtained at the oxygen partial pressure of 0.5 MPa, ionic mass concentration of 0.1 mol/kg, and temperatures of 60, 100, 150 and 200 ��C. The reactions 33, 34, 35 and 38, which were carried out by soluble titanium ionics (stable regions formed by dotted lines) were not contained in Fig.3 because only titanium oxides exist in the converter slag, but not soluble titanium ionics.
Based on Fig. 3, the stable regions of V3+, VO2+ and VO2+ are practically contained in that of TiO2, but few coincide with stable regions of Ti3+ and TiO2+ at pH<2. Coexistence of stable region shows that pressure acid leaching process could selectively separate vanadium from titanium based on thermodynamic principle.
Redox potentials of stable region of vanadium and titanium become more positive as well as pH values get more negative with temperature increasing from 60 ��C to 200 ��C. The acid concentration should be high enough to dissolve vanadium ionics from converter slag, but titanium would be easy to be dissolved at this condition as well. Some factors, such as acid concentration, oxygen partial pressure and temperature, which control the redox potentials and pH, are used to dissolve vanadium sufficiently and enrich titanium oxides in the residue during the pressure acid leaching process. Coexisting characteristics of stable region of vanadium and titanium would be stable with temperature increasing from 60 ��C to 200 ��C.

Fig. 3 ��-pH diagram of V-Ti-H2O system at different temperatures: (a) 60 ��C; (b) 100 ��C; (c) 150 ��C; (d) 200 ��C
3 Experimental
3.1 Materials
The converter slag containing vanadium and titanium was from Panzhihua of Sichuan province, China. Mineralogical and chemical analyses of the sample were carried out using X-ray diffractometer (XRD, model PW3040/60, Netherland) and X-ray fluorescence spectroscope (XRF, model ZSX100e, Japan). The XRD pattern of the mineral sample is shown in Fig.4. The XRD result reveals that the major phases in the slag are vanadium and ferrous spinel containing manganese and chromium, fayalite, titanium and ferrous spinel and quartz. Based on the XRD pattern, vanadium and titanium in the complex spinel phase exist in oxide forms. Table 8 presents the chemical compositions of the slag. Leaching agent was sulfuric acid solution which was diluted from 98% to a certain concentration range. The used gas was bottled oxygen for industry.
Table 8 Main compositions of converter slag (mass fraction, %)


Fig. 4 XRD patter of converter slag
3.2 Equipments
Experiment equipments included autoclave (model KCFD2-10), planetary high energy ball mill (model Pulverisette5), rotary-vane vacuum pump (model 2XZ-1) and vacuum drying oven (model ZK-82B).
Inductively coupled plasma-atomic emission spectrometer (ICP, model Prodigy XP, America) was used to test the ionic concentration of vanadium and titanium in the leachate. X-ray fluorescence spectroscope (XRF, model ZSX100e, Japan) was used to analyze the elemental content of vanadium and titanium in the residue.
3.3 Methods
A sample of converter slag was added to a zirconium autoclave at the desired temperature and then oxygen was continuously aerated into the reactor to produce a certain pressure. The reaction time (after achieving the desired temperature), initial acid concentration, liquid to solid ratio, oxygen partial pressure, particle size and stirring speed were fixed, and desired temperature was varied. When the reaction completed, the cover of autoclave was removed. The slurry was separated by vacuum filtration, and the leachate and residue were analyzed for vanadium and titanium content to calculate leaching rate.
4 Results and discussion
Figure 5 illustrates the effect of temperature on leaching rate of vanadium and titanium ranging from 60 ��C to 180 ��C, at oxygen partial pressure of 0.5 MPa, particle size of 0.055-0.075 mm, liquid to solid ratio of 15:1, leaching time of 120 min, stirring speed of 500 r/min and initial acid concentration of 200 g/L. When the temperature increases from 60 to 140 ��C, leaching rate of vanadium rises from 65.48% to 96.87%. However, leaching rate of vanadium gets 97.07% at the temperature of 180 ��C, which is stable above 140 ��C.

Fig. 5 Effect of temperature on leaching rates of V and Ti
Leaching rate of titanium increases from 3.41% to 12.33% with the temperature increasing from 60 to 180 ��C.
Leaching process is mainly controlled by the kinetics process of liquid-solid reaction according to the experiment results at different temperatures. Dissolved reaction speed is rapidly to promote the leaching process of vanadium and titanium with temperature increasing. From Fig. 5, leaching temperature cannot be above 140 ��C, and leaching rates of vanadium and titanium are 96.87% and 8.76% at this temperature, respectively.
5 Conclusions
1) Based on ��-pH diagram of V-H2O system at different temperatures, the stable regions of V3+, VO2+ and VO2+ are contained in the stable region of solution at pH<2, which provides the thermodynamic feasibility of pressure acid leaching of vanadium.
2) Titanium mainly exists as oxides in the converter, so the stable region of TiO2 mainly exists in the stable region of solution according to ��-pH diagram of Ti-H2O system at different temperatures, which provides the thermodynamics principle of enrichment of titanium in the residue.
3) Based on ��-pH diagram of V-Ti-H2O system at different temperatures, the stable regions of V3+, VO2+ and VO2+ are practically contained in stable region of TiO2. Redox potentials of stable region of vanadium and titanium become more positive as well as pH values get more negative with temperature increasing from 60 ��C to 200 ��C. Coexisting characteristics of stable regions, which would be stable with temperature increasing, provide a thermodynamic view that vanadium dissolves in the leachate as well as titanium oxides enrich in the residue during the pressure acid leaching of converter slag.
4) Leaching rate of vanadium and titanium are 96.87% and 8.76% at 140 ��C, 0.5 MPa of oxygen partial pressure, 0.055-0.075 mm of particle size, 15:1 of liquid to solid ratio, 120 min of leaching time, 500 r/min of stirring speed and 200 g/L of initial acid concentration. Vanadium and titanium can be selectively separated in the pressure acid leaching process, and the experiment result is in agreement with that of thermodynamic calculation.
References
[1] MOSKALYK R R, ALFANTAZI A M. Processing of vanadium: A review [J]. Minerals Engineering, 2003, 16: 793-805.
[2] NAVARRO R, GUZMAN J, SAUCEDO I, REVILLA J, GUIBAL E. Vanadium recovery from oil fly ash by leaching precipitation and solvent extraction processes [J]. Waste Management, 2006, 27: 425-438.
[3] SHELWIT H, ALIBRAHIM M. Extraction of sulfur and vanadium from petroleum coke by means of salt-roasting treatment [J]. Fuel, 2006, 85(6): 878-880.
[4] FAN Bei-wei, LIN Hai-ling. Effects of roasting process on extraction of vanadium from stone coal at Fangshankou [J]. Hydrometallurgy of China, 2001, 20 (2): 79-83. (in Chinese)
[5] TAN Ai-hua. Study on extracting V2O5 by the roasting-alkaline leaching from vanadium-containing stone coal [J]. Hunan Nonferrous Metals, 2008, 24(1): 24-27. (in Chinese)
[6] BIN Zhi-yong. Study on extraction of V2O5 from vanadium ore by roasting and acid leaching process [J]. Iron Steel Vanadium Titanium, 2006, 27(1): 21-26. (in Chinese)
[7] ZOU Xiao-yong, PENG Qing-jing, OUYANG Yu-zhu, TIAN Ren-guo. Research on the roasting process with calcium compounds for silica based vanadium ore [J]. The Chinese Journal of Process Engineering, 2001, 1(2): 189-192. (in Chinese)
[8] WANG Jin-chao. Effect of calcium on leaching of vanadium from vanadium slag [J]. Sichuan Nonferrous Metals, 2004(4): 27-29. (in Chinese)
[9] DENG Zhi-gan, WEI Chang, FAN Gang, LI Min-ting, LI Cun-xiong, LI Xing-bin. Extracting vanadium from stone-coal by oxygen pressure acid leaching and solvent extraction [J]. Transactions of Nonferrous Metals Society of China, 2010, 20(S1): 118-122.
[10] LI Min-ting, WEI Chang, FAN Gang, LI Cun-xiong, DENG Zhi-gan, LI Xin-bin. Pressure acid leaching of black shale for extraction of vanadium [J]. Transactions of Nonferrous Metals Society of China, 2010, 20(S1): 112-117.
[11] MU Wang-zhong, ZHANG Ting-an, LIU Yan, GU Yan, DOU Zhi-he, L? Guo-zhi, BAO Li, ZHANG Wei-guang. E��pH diagram of ZnS-H2O system during high pressure leaching of zinc sulfide [J]. Transactions of Nonferrous Metals Society of China, 2010, 20(10): 2012-2019.
[12] POST K, ROBINS R G. Thermodynamic diagrams for the vanadium-water system at 298.15 K [J]. Electrochimica Acta, 1976, 21(6): 401-405.
[13] LEE J B. Elevated temperature potential-pH diagrams for the Cr-H2O, Ti-H2O, Mo-H2O, and Pt-H2O system [J]. Corrosion, 1981, 37(8): 467-481.
[14] YI Xian-wu. An empirical estimation of standard entropy for some complex cations and the E��pH diagram of As-H2O system at elevated temperature [J]. Journal of Kunming University of Science and Technology, 1982(3): 58-73. (in Chinese)
[15] YANG Xian-wan. Handbook of thermodynamic data in aqueous solutions at high temperature [M]. Beijing: Metallurgical Industry Press, 1983: 523-674. (in Chinese)
[16] TIAN Yan-wen, ZHAI Xiu-jing, LIU Kui-ren. Short course of metallurgical physical chemistry [M]. Beijing: Chemical Industry Press, 2007: 225-227. (in Chinese)
[17] HUANG Zi-qing. Introduction of electrolyte solutions theory [M]. Beijing: Science Press, 1983: 83-87.(in Chinese)
������ת¯����ѹ�������V-Ti-H2Oϵ�ĵ�λ-pHͼ
IJ���أ���͢������־�ӣ�����־���� ��
������ѧ ������ұ��ѧԺ���������������̬�����ý������ص�ʵ���ң����� 110819
ժ Ҫ��Ϊ�˷���������ת¯����ѹ������̵�����ѧ�ص㣬���ݸ���ˮ��Һ�м����Ħ������˹�����ܺͻ��ϵ���ľ��鹫ʽ��ͨ������õ�������ѹ0.5 MPa����Ӧ���ӵ�����Ũ��0.1 mol/kg���¶�60~200 ��C������V-Ti-H2Oϵ�ĵ�λ-pHͼ����pH<2�����������£�������V3+��VO2+��VO2+���ȶ�������ȫ��������TiO2���ȶ�����Χ�ڣ������¶���60 ��C���ߵ�200 ��C���������ȶ���������Ӧ��������ԭ��λ������pH���͡��������ȶ����Ĺ����ص������ѧ�Ƕ�Ϊת¯��������ѹ�������ͨ��һ���������������ͬʱʹ�Ѹ����������ṩ���������ݡ�������ת¯������ѹ���ʵ�����������ڽ����¶�140 ��C������ѹ0.5 MPa������0.055~0.075 mm��Һ�̱�15:1������ʱ��120 min�������ٶ�500 r/min������Ũ��200 g/L�������£����Ľ�����Ϊ96.87%���ѵĽ�����Ϊ8.76%��������ͨ����ѹ��������ܹ��õ���Ч���룬ʵ����������ѧ������һ�¡�
�ؼ��ʣ���λ-pHͼ��V-Ti-H2Oϵ����ѹ�����ת¯����������
(Edited by LI Xiang-qun)
Foundation item: Project (2007CB613504) supported by the National Key Basic Research Program of China; Projects (51004033, 50974035, 51074047) supported by the National Natural Science Foundation of China; Project (2008BAB34B01) supported by National Science and Technology Support Plan of China during the 11th Five-Year Plan
Corresponding author: ZHANG Ting-an; Tel: +86-24-83687732; E-mail: zta2000@163.net
DOI: 10.1016/S1003-6326(11)60976-X

