Optimizing pulsed current gas tungsten arc welding parameters of AA6061 aluminium alloy using Hooke and Jeeves algorithm
��Դ�ڿ����й���ɫ����ѧ��(Ӣ�İ�)2008���5��
�������ߣ�S. BABU T. SENTHIL KUMAR V. BALASUBRAMANIAN
����ҳ�룺1028 - 1028
Key words��pulsed current; gas tungsten arc welding; aluminium alloy; grain size; response surface graph; analysis of variance;Hooke and Jeeves pattern search method
Abstract: Though the preferred welding process to weld aluminium alloy is frequently constant current gas tungsten arc welding (CCGTAW), it resulted in grain coarsening at the fusion zone and heat affected zone(HAZ). Hence, pulsed current gas tungsten arc welding(PCGTAW) was performed, to yield finer fusion zone grains, which leads to higher strength of AA6061 (Al-Mg-Si) aluminium alloy joints. In order to determine the most influential control factors which will yield minimum fusion zone grain size and maximum tensile strength of the joints, the traditional Hooke and Jeeves pattern search method was used. The experiments were carried out based on central composite design with 31 runs and an algorithm was developed to optimize the fusion zone grain size and the tensile strength of pulsed current gas tungsten arc welded AA6061 aluminium alloy joints. The results indicate that the peak current (Ip) and base current (IB) are the most significant parameters, to decide the fusion zone grain size and the tensile strength of the AA6061 aluminum alloy joints.

S. BABU1, T. SENTHIL KUMAR2, V. BALASUBRAMANIAN1
1. Centre for Materials Joining Research (CEMAJOR), Department of Manufacturing Engineering,
Annamalai University, Annamalai Nagar �C 608 002, Tamil Nadu, India;
2. Department of Automobile Technology, Bharathidasan Institute of Technology,
Anna University, Tiruchirappalli �C 620 016, Tamil Nadu, India
Received 27 January 2008; accepted 23 June 2008
Abstract: Though the preferred welding process to weld aluminium alloy is frequently constant current gas tungsten arc welding (CCGTAW), it resulted in grain coarsening at the fusion zone and heat affected zone(HAZ). Hence, pulsed current gas tungsten arc welding(PCGTAW) was performed, to yield finer fusion zone grains, which leads to higher strength of AA6061 (Al-Mg-Si) aluminium alloy joints. In order to determine the most influential control factors which will yield minimum fusion zone grain size and maximum tensile strength of the joints, the traditional Hooke and Jeeves pattern search method was used. The experiments were carried out based on central composite design with 31 runs and an algorithm was developed to optimize the fusion zone grain size and the tensile strength of pulsed current gas tungsten arc welded AA6061 aluminium alloy joints. The results indicate that the peak current (Ip) and base current (IB) are the most significant parameters, to decide the fusion zone grain size and the tensile strength of the AA6061 aluminum alloy joints.
Key words: pulsed current; gas tungsten arc welding; aluminium alloy; grain size; response surface graph; analysis of variance; Hooke and Jeeves pattern search method
1 Introduction
Weld fusion zones typically exhibit coarse columnar grains because of the prevailing thermal conditions during weld metal solidification. This often results in inferior weld mechanical properties and poor resistance to hot cracking. In order to avoid this situation, it is desirable to choose appropriate materials and appropriate methods of welding and to formulate mathematical models[1] for the responses. By doing this, it is hoped that the degree of empiricism, which is usually associated with the choice of welding parameters, might be reduced or even eliminated[2-3].
Current pulsing has been used by several investigators to obtain grain refinement in weld fusion zones and improvement in weld mechanical properties [4-5]. Moreover, the metallurgical advantages of pulsed current welding frequently reported in literature include reduced width of HAZ, control of segregation etc[6]. Important consideration in current pulsing is the choice of pulse parameters. Several investigators have stressed the importance of using the optimum pulse parameters for maximizing the beneficial influence of current pulsing. There are four important parameters, namely peak current, base current, pulse on time and pulse frequency. All these parameters are, by and large, interdependent[7].
Thus, many considerations come into the picture and one needs to carefully balance various pulse parameters to arrive at an optimum combination. Hence, in this investigation, an attempt has been made to optimize the pulsed current GTA welding parameters to attain maximum tensile strength and minimum fusion zone grain size in the medium strength AA6061 aluminium alloy using Hooke and Jeeves algorithm.
2 Scheme of investigation
From Refs.[4-9] and the previous work done in our laboratory[10-11], predominant factors which have greater influence on fusion zone grain refinement of pulsed current GTA welding process have been identified. They are: 1) Peak current, 2) Background current, 3) Pulse Frequency, and 4) Pulse on time.
2.1 Finding working limits of parameters
A large number of trial runs were carried out using 6 mm-thick rolled sheets of AA7075 aluminium alloy to find out the feasible working limits of pulsed current GTA welding parameters[12]. AA5356 (Al-5%Mg) aluminium alloy of 4 mm in diameter was used as the filler material. Different combinations of pulsed current parameters were used to conduct the trial runs. The bead contour, bead appearance and weld quality were inspected to identify the working limits of the welding parameters. From the above analysis, following observations were made:
1) If the peak current was less than 160 A, incomplete penetration and lack of fusion were observed. At the same time, if the peak current exceeded 180 A, undercut and spatter were observed on the weld bead surface.
2) If background current was lower than 80 A, arc length was found to be very short. On the other hand, if the background current was greater than 90 A, arc became unstable and arc wandering was observed due to increased arc length.
3) If the pulse frequency was 2 Hz, then the bead appearance and bead contours were similar to those of constant current welding. However, if the pulse frequency was greater than 6 Hz, arc glare and arc spatter were experienced.
4) If the pulse on time was lower than 40%, weld nugget formation was not smooth due to incomplete melting of the base metal. On the contrary, if the pulse on time was greater than 60%, overmelting of the base metal and overheating of the tungsten electrode were noticed.
2.2 Developing design matrix
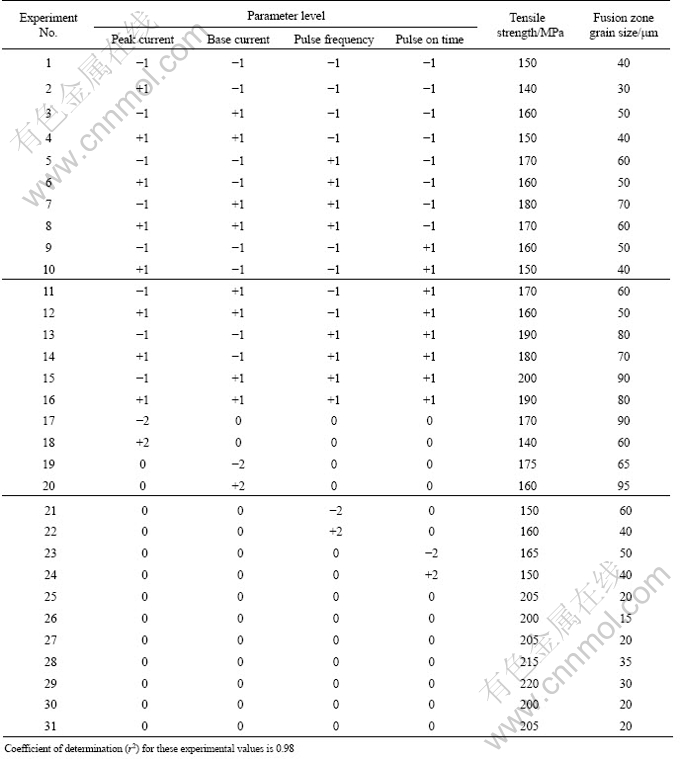
By considering all the above conditions, the feasible limits of the pulsed current parameters were chosen in such a way that the 5 mm AA6061 aluminium alloy was welded without any weld defects. Due to wide ranges of factors, it was decided to use four factors, five levels, and rotatable central composite design matrix to optimize the experimental conditions. Table 1 presents the ranges of factors considered and Table 2 shows the 31 sets of coded conditions used to form the design matrix.
The first 16 experiments were formulated as per 24 (two levels and four factors) factorial design. The 16 experimental conditions (rows) were formed for main effects by using the formula  for the low (-1) and high (+1) values, where ��mc�� refers to the column number. For example, in Table 2, the first four rows are coded as -1 and next four rows are coded as +1, alternatively, in the third column (because mc=3 and therefore 23-1=4). The next 8 experimental conditions are called as corner points, i.e. keeping one factor at the lowest/highest level and the remaining factors at middle level. The last 7 experimental conditions are known as center points, i.e. keeping all the factors at the middle level and it is normally done to know the repeatability of the experimental procedures. The method of designing such matrix is dealt elsewhere[13-14]. For the convenience of recording and processing the experimental data, the upper and lower levels of the factors were coded as +2 and -2, respectively and the coded values of any intermediate levels were calculated by using the following expression [15]:
![]()
where Xi is the required coded value of a parameter of any value X from Xmin to Xmax; Xmin is the lower level of the parameter and Xmax is the upper level of the parameter.
Table 1 Important parameters and their levels

2.3 Conducting experiments
The single V butt joints were fabricated by gas tungsten arc welding(GTAW) process using AA4043 (Al-5%Si) grade aluminium alloy as filler metal as per the conditions dictated in design matrix. In this investigation, 31 joints have been fabricated using different combination of pulsed current welding parameters as prescribed by the design matrix. Three transverse tensile specimens were prepared as per the ASTM E8M-04 guidelines (Fig.1). Tensile tests were carried out in 100 kN electro-mechanical controlled Universal Testing Machine (FIE-BLUE STAR). The specimen was loaded at a rate of 1.5 kN/min as per ASTM specifications, so that the tensile specimen undergoes deformation. From the load��displacement curve, the tensile strength of the joints was evaluated and the average of the three results is presented in Table 2.

Fig. 1 Dimensions of tensile test specimen
Table 2 Design matrix and experimental results
Microstructural examinations were carried out using a light optical microscope (VERSAMET-3) incorporated with an image analyzing software (Clemex-Vision). The specimens for metallographic examination were sectioned to the required sizes from the joint comprising weld metal, heat affected zone and base metal regions and were polished using different grades of emery papers. Final polishing was done using the diamond compound (1 mm in particle size) in the disc- polishing machine. Specimens were etched with Kellers reagent to reveal the microstructure. Optical micrographs of the fusion zone regions for some of the joints are displayed in Fig.2. Average diameter of the fusion zone grains was measured by applying Heyn��s line intercept method.

Fig.2 Optical micrographs of fusion zone: (a) Joint 1 (D=40 �� m); (b) Joint 2 (D=30 �� m); (c) Joint 3 (D=50 �� m); (d) Joint 8 (D=60 ��m); (e) Joint 14 (D=70 �� m); (f) Joint 16 (D=80 �� m); (g) Joint 15 (D=90 �� m); (h) Joint 25 (D=20 �� m)
2.4 Developing mathematical models
Using SPSS statistical software package, the significant coefficients were determined, and final models were developed using only these coefficients to estimate tensile strength and fusion zone grain size. The final mathematical models are given by
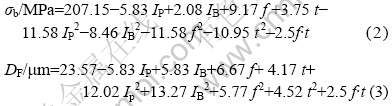
The adequacy of the developed models was tested using the analysis of variance technique (ANOVA). As per this technique, if the calculated value of the Fratio of the developed model is less than the standard Fratio (from F-table) value at a desired level of confidence (say 95), then the model is said to be adequate within the confidence limit. ANOVA test results are presented in Table 3 for both the models. From the table, it is understood that the developed mathematical models are found be adequate at 95% confidence level.
Table 3 ANOVA test results

3 Optimization of welding parameters
The traditional Hooke and Jeeves method[16] is used as an optimization tool to search the optimum values of the process variables. The developed mathematical model has been framed by using the coded values. Hence the optimization is done on coded values and then converted to actual values. A computer program using ��C�� language for the algorithm is developed to optimize the process variables. First the objective is written as a non-linear programming problem (NLPP).
Z=Max/Min (Tensile strength/Fusion zone grain size) = Z (IP, IB, f, t)

The pattern search method works by creating a set of search directions iteratively. The created search direction should completely scan the search space. In the Hooke-Jeeves method, a combination of exploratory moves(EM) and heuristic pattern moves(PM) should be made iteratively. An exploratory move is performed in the vicinity of the current point systematically to find the best point around the current point. Thereafter, two such points are used to make a pattern move.
3.1 Hooke and Jeeves algorithm
Step 1: Choose a starting point y(0), variable increments ��j (j=1, 2, ��, N), a step reduction factor �£�1, and a convergence/termination parameter ��, set K=0, set boundary conditions for variables.
Step 2: Perform an exploratory move (referred as EM) with y(K) as the base point. Say ��y�� is the outcome of the exploratory move. If the exploratory move is a success, set y(K+1) =y and go to step 4; else go to step 3.
Step 3: Is ������? If yes, terminate; else set ��j=��j/�� for j=1, 2, ��, N and go to step 2.
Step 4: Set K=K+1 and perform Pattern Move yp(K+1)= y(K)+(y(K) -y(K-1)).
Step 5: Perform another exploratory move using yp(K+1) as the base point. Let the result be y(K+1).
Step 6: Is f(y(K+1))��f(y(K))? If yes, go to step 4, else go to step 3.
3.2 Exploratory Move(EM)
Assume that the current solution (the base point) is denoted by yc. Assume also that the variable yjc is perturbed by ��j. Set j=j+1 and y= yc.
Step 1: Calculate f=f(y), f +=f(yj+��j) and f-= f(yj-��j).
Step 2: Find fmin=min(f, f +, f-), set x corresponds to fmin.
Step 3: Is j=N? If no, set j=j+1 and go to step 1; else y is the result and go to step 4.
Step 4: If y=yc, success; else failure.
3.3 Patter Move(PM)
A new point is found by jumping from the current best point yc along a direction connecting the previous best point y(K-1) and the current base point y(K) as follows:
yp(K+1)=y(K)+(y(K)-y(K-1))
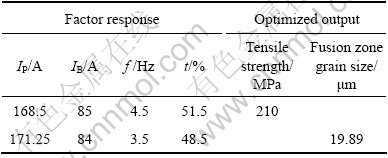
The mathematical models (Eqns.(2) and (3)) developed in the previous section were used in Hooke and Jeeves algorithm to predict the optimum value for the process variables, from which the optimum responses are estimated. The optimum values obtained are listed in Table 4.
Table 4 Optimized pulsed current welding parameters
4 Contour plots and response graphs
Contour plots show distinctive circular mound shape indicative of possible independence of factors with response. A contour plot is produced to visually display the region of optimal factor settings. For second order response surfaces, such a plot can be more complex than the simple series of parallel lines that can occur with first order models. Once the stationary point is found, it is usually necessary to characterize the response surface in the immediate vicinity of the point. Characterization means identifying whether the stationary point found is a maximum response or minimum response or a saddle point. To classify this, the most straightforward way is to examine through a contour plot. Contour plots play a very important role in the study of the response surface. By generating contour plots using software for response surface analysis, the optimum is located with reasonable accuracy by characterizing the shape of the surface. If a contour patterning of circular shaped contours occurs, it tends to suggest the independence of factor effects; while elliptical contours may indicate factor interactions[13]. Response surfaces have been developed for the developed model, taking two parameters in the middle level and two parameters in the X and Y axes and response in Z axis. From the response surfaces, the optimal response point can be identified very easily.
4.1 Analysis of response surface plots and contour plots
Fig.3 represents three dimensional response surface plot for the response tensile strength obtained from the regression model, assuming the peak current 170 A, base current 85 A, pulse frequency 4 Hz and pulse on time 50%. The apex of the response surface exhibits the optimum tensile strength of about 210 MPa. It is relatively easy by examining the contour plot (Fig.4) that changes in the tensile strength are more sensitive to changes in peak current and base current than to changes in pulse frequency and pulse on time. Fig.4(a) exhibits almost a circular contour, which suggests independence of factor effects namely peak current and base current at a frequency of 4 Hz and pulse on time of 50%. Validation with confirmation experiments to evaluate tensile strength is shown in Table 5.
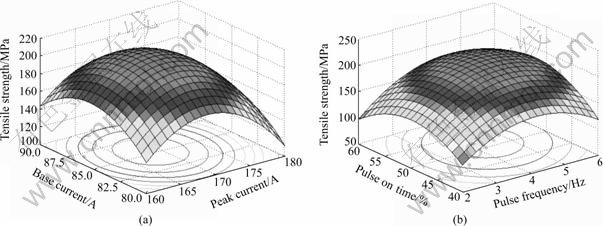
Fig.3 Response graphs for PCGTAW parameters on tensile strength: (a) f=4 Hz, t=50%; (b) IP=170 A, IB=85 A
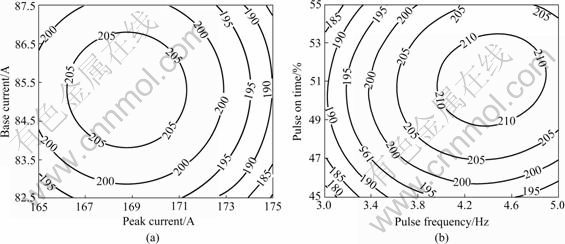
Fig.4 Contour plots for PCGTAW parameters on tensile strength: (a) f=4 Hz, t=50%; (b) IP=168.5 A, IB=85 A
Table 5 Validation with confirmation experiments to evaluate tensile strength
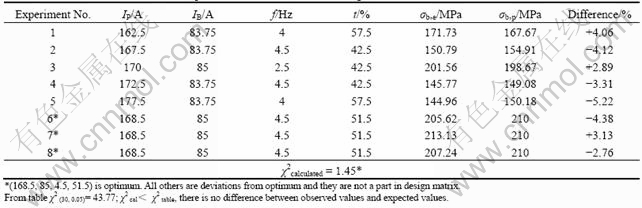
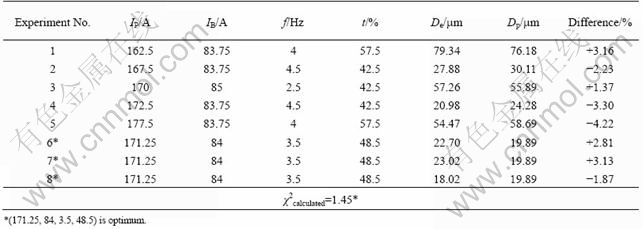
Fig.5 represents three dimensional response surface plot for the response fusion zone grain size obtained from the regression model, assuming the peak current 170 A, base current 85 A, pulse frequency 4 Hz and pulse on time 50%. The optimum fusion zone grain size obtained at the valley of the response surface is about 19.89 ��m. It is relatively easy by examining the contour plot (Fig.6) that changes in the fusion zone grain size are more sensitive to changes in pulse frequency and pulse on time than to changes in peak current and base current. Fig.6(a) exhibits almost a elliptical contour, which suggests interaction effects between the factors at a peak current of 170 A, base current of 85 A, pulse frequency of 4 Hz and pulse on time of 50%. Validation with confirmation experiments to reveal fusion zone is shown in Table 6.
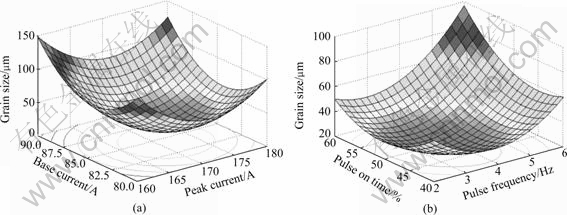
Fig.5 Response graphs for PCGTAW parameters on fusion zone grain size: (a) f=4 Hz, t=50%; (b) IP=170 A, IB=85 A

Fig.6 Contour plots for PCGTAW parameters on fusion zone grain size: (a) f=4 Hz, t=50%; (b) IP=171.250 A, IB=84 A
Table 6 Validation with confirmation experiments to reveal fusion zone grain Size
From the contour plot, the interaction effect between the factors on tensile strength and fusion zone grain size are clearly evidenced. In the contour plot (Fig.4(b)) drawn, the tensile strength is more sensitive to changes in peak current than changes in pulse frequency and pulse on time. There seems to be a definite interaction effect of pulse frequency and pulse on time on tensile strength, while there is an interaction effect of peak current and base current on fusion zone grain size.
From the contour plots and response surfaces shown in Figs.4 and 6, the following inferences can be obtained. Of the four factors used, the tensile strength and fusion zone grain size are more sensitive to peak current at an optimum base current, pulse frequency and pulse on time. Interaction effects between factors, peak current and base current, pulse frequency and pulse on time exist, are evidenced and exhibited in contour plots. Optimum tensile strength is obtained from the response surface and contour plots by using a peak current of 168.5 A, base current of 85 A, pulse frequency of 4.5 Hz and pulse on time of 51.5%, whereas optimum fusion zone grain size is obtained at a peak current of 171.25 A, base current of 84 A, pulse frequency of 3.5 Hz and pulse on time of 48.5%, assuming any two factors at optimum levels obtained from Hooke and Jeeves pattern search method.
5 Conclusions1) The predominant pulsed current parameters of GTA welded AA6061 aluminium alloy such as peak current, base current, pulse frequency and pulse on time are optimized by using Hooke and Jeeves algorithm, to attain the maximum tensile strength and minimum fusion zone grain size. However, the validity of the procedure is limited to the range of parameters considered for investigation.
2) Design of experiment concept and Hooke and Jeeves Pattern Search method are more economical to predict the effects of pulsed current parameters on tensile strength and grain size by conducting an optimum number of experiments.
3) A minimum fusion zone grain diameter of 19.89 ��m is obtained at a peak current of 171.25 A, base current of 84 A, pulse frequency of 3.5 Hz and pulse on time about 48.5% using the optimization procedure and it closely matches with the experimentally determined results.
4) Response graphs and contour plots are drawn to study the interaction effect of pulsed current GTA welding parameters on tensile strength and fusion zone grain size of AA6061 aluminium alloy.
5) The differences in responses of confirmation tests are due to the influences of the uncontrollable factors such as heat conduction, heat input variation and hysteric losses, which can be controlled by the use of heat resistant materials.
AcknowledgementsThe authors are grateful to the Department of Manufacturing Engineering, Annamalai University, Annamalainagar, Tamil Nadu, India, for extending the facilities of Metal Joining Laboratory and Materials Testing Laboratory to carry out this investigation. The authors also wish to express their sincere thanks to Naval Research Board (NRB), Ministry of Defence, New Delhi for the financial support to carry out this investigation through sponsored project No.DNRD/05/4003/NRB/67. The authors also acknowledge the help rendered by Mr. Subbiah, Manager, LTM, Chennai to procure the base material.
References
[1] CERJAK H. Mathematical modeling of weld phenomena [M]. London: The Institute of Materials, 1988.
[2] VITEK J M, DAVID S A, JOHNSON J A, SMARTT H B, DEBROY T. Trends in welding research [C]// Proceedings of the 5th International Conference on Materials. ASM International, Materials Park, Ohio, 1999.
[3] THOMAS B G, BECKERMANN C. Modeling of casting, welding and advanced solidification processes VIII [M]. Warrendale, PA, The Minerals, Metals and Materials Society, 1998.
[4] MADUSUDHANA REDDY G, GOKHALE A A, PRASAD RAO K. Weld microstructure refinement in a 1441 grade aluminum-lithium alloy [J]. Journal of Material Science, 1997, 32(5): 4117-4126.
[5] YAMAMOTO H, HARADA S, UEYAMA T, OGAWA S, MATSUDA F, NAKATA K. Beneficial effect of low frequency pulsed MIG welding on grain refinement of weld metal and improvement of solidification crack susceptibility for weld metal and improvement of solidification crack susceptibility for aluminium alloy [J]. Welding International, 1993, 7(8): 593-598.
[6] GOKHALE A A, TZAVARAS A A, BRODY H D, HCER G M. Proceedings of International Conference on Grain Refinement in Casting and Welds. St. Louis, MO: TMS-AIME, 1982: 223-247.
[7] MADUSUDHANA REEDDY G, GOKHALE A A, PRASAD RAO K. Optimization of pulse frequency in PCGTAW of Al-Li alloy sheets [J]. Journal of Material Science Technology, 1998, 14: 61-66.
[8] SHELWATKAR D, MADUSUDHANA REDDY G, GOKHALE A A. GTAW studies on similar and dissimilar combination of Al-Zn-Mg alloy RDE 40 and Al-Li alloy 1441 [J]. Journal of Science and Technology of Welding and Joining, 2002, 7(6): 352-361.
[9] MESSLER R W. Principles of Welding [M]. New York: John Wiley & Sons, 1999.
[10] BALASUBRAMANIAN V, RAVISANKAR V. Effect of pulsed current welding parameters on fatigue properties of high strength aluminium alloys [C]// Proceedings of International Welding Symposium (IWS). Hydrebad, India, 2003: 159-166.
[11] BALASUBRAMANIAN V, RAVISANKAR V. Influences of pulsed current parameters on tensile and impact behaviour of Al-Mg-Si alloy weldments [C]// Proceedings of International Conference on Welding (IMPLAST). New Delhi, India, 2003: 224-232.
[12] SENTHILKUMAR T, BALASUBRAMANIAN V, BABU S, SANAVULLAH M Y. Effect of pulsed current gas tungsten arc welding parameters on the fusion zone microstructure of AA6061 aluminum alloy [J]. Metals and Materials International, 2007, 13(4): 345-351.
[13] MONTGOMERY D C. Design and analysis of experiments [M]. 3rd Edition, New York, John Wiley & Sons: 1991: 291-295.
[14] BOX G E P, HUNTER W H, HUNTER J S. Statistics for experimenters [M]. New York: John Wiley & Sons, 1978: 112-115.
[15] RAVINDRA J, PARMAR R S. Mathematical model to predict weld bead geometry for flux cored arc welding [J]. Journal of Metal Construction, 1987, 19: 45-52.
[16] KALYANMOY D. Optimization for engineering design [M]. India: Prentice Hall, 1988.
Corresponding author: V. BALASUBRAMANIAN; Tel: +91-4144-239734 (O), +91-4144-241147 (R); Fax: +91-4144-238080/238275;
E-mail: visvabalu@yahoo.com

