
Quantitative analysis of impurities in aluminum alloys by laser-induced breakdown spectroscopy without internal calibration
LI Hong-kun(黎洪坤), LIU Ming(刘 明), CHEN Zhi-jiang(陈志江), LI Run-hua(李润华)
School of Physics, South China University of Technology, Guangzhou 510640, China
Received 22 December 2006; accepted 19 September 2007
Abstract: To develop a fast and sensitive alloy elemental analysis method, a laser-induced breakdown spectroscopy(LIBS) system was established and used to carry out quantitative analysis of impurities in aluminum alloys in air at atmospheric pressure. A digital storage oscilloscope was used as signal recording instrument, instead of traditional gate integrator or Boxcar averager, to reduce the cost of the whole system. Linear calibration curves in the concentration range of 4×10⁻⁵-10-2 are built for Mg, Cr, Mn, Cu and Zn using absolute line intensity without internal calibrations. Limits of detection for these five elements in aluminum alloy are determined to be (2-90)×10-6. It is demonstrated that LIBS can provide quantitative trace elemental analysis in alloys even without internal calibration. This approach is easy to use in metallurgy industries and relative research fields.
Key words: laser-induced breakdown spectroscopy; aluminum alloy; impurity analysis
1 Introduction
Fast, accurate impurities elemental analysis for alloys is very important for product’s quality control in lots of industrial processes. Laser-induced breakdown spectroscopy(LIBS) is a fast developing elemental analysis approach that has been widely used in qualitative and quantitative elemental analysis for different alloys, such as steel[1-3], copper-based alloys [4-5], zinc alloy[6] and gold jewellery[7-8] due to its versatility, minimal sample preparation and simplicity. LIBS is also used for precipitates identification[9], surface-scanning microanalysis[10] and industrial on-line analysis for aluminum alloys[11-12].
For quantitative elemental analysis, in order to reduce mass ablation variation effect and matrix effect, internal calibration method is generally used[11-18]. In this method, an element with known concentration and one of its adequate analyzed lines have to be selected as internal calibration standard, and the intensity ratio is plotted versus concentration ratio between the analyzed element and internal standard element to construct calibration curves.
The usage of internal calibration method has two difficulties: first, it is not always easy to have concentration information for the standard element; second, if a high concentration element is selected as the internal standard, self-absorption effect for resonant lines is usually unavoidable. Therefore, these lines cannot be selected as internal standard lines. To overcome these drawbacks, a direct calibration method with absolute line intensity of the analyzed element has been tested[19-21] and compared with internal calibration method[22-24] by studying aluminum alloy with LIBS. It was demonstrated that it was possible to construct a good calibration curve for one element based on its absolute line intensity without using internal calibration.
The purpose of this work is to set up a less expensive LIBS system and take fast quantitative alloy elemental analysis in air at atmospheric pressure. The system introduced here will be found wide applications in nonferrous metallurgy industries and relative research fields.
2 Experimental
Fig.1 shows a schematic diagram of the experimental se-tup used in this work. The fundamental output (1 064 nm) of a Q-switched Nd: YAG laser (Joyee Technologies, Turbolite 1000) with 12 ns pulse width and 5 Hz repetition rate was focused by a spherical lens L1 (BK7, Lf=100 mm) on the surface of a rotating alloy rod to generate laser-induced plasma. An iris was put in front of L1 to adjust laser energy. The typical pulse energy used in the experiment was 15-30 mJ. Plasma emission was collected by the spherical lens L2 (BK7, Lf=150 mm) into a parallel beam. This beam was reflected by the folding mirror RM and then focused by the spherical lens L3 (BK7, Lf=250 mm) onto the entrance slit of a 50 cm monochromator (Tianjin Tuopu, Model WDS-5) equipped with a 1 200 L/mm diffraction grating and a photomultiplier tube (Hamamatsu, CR114). Both widths of the entrance and exit slits of the monochromator were set at 200 μm in experiments.
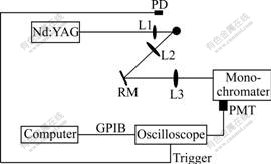
Fig.1 Schematic diagram of experimental set-up of laser- induced breakdown spectroscopy
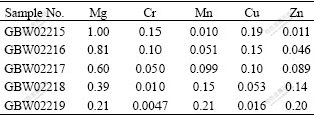
The electric signal was monitored with a 250 MHz digital storage oscilloscope (Good Will, GDS-840C) and waveform data of the oscilloscope were transferred to a computer via a GPIB interface for analysis. A fast photodiode receiving scattering laser light was used to generate a trigger source for the oscilloscope. All experiments in this work were carried out in air at atmospheric pressure. Five standard aluminum alloy samples GBW02215-02219 were purchased from Institute of Standard Materials in Fushun Factory of Aluminum, China for constructing calibration curves. The concentrations of different elements are listed in Table 1.
Table 1 Concentrations of trace elements in standard aluminum alloy samples (mass fraction, %)
3 Results and discussion
3.1 Theoretical bases for quantitative analysis
Under the condition of optical thin plasma, that is, the optical length times absorption efficient is less than 1.0, and supposing local thermodynamics equilibrium occurs, the intensity of an atomic emission spectral line is[25]
 (1)
(1)
where h is Planck’s constant; c is velocity of light; g is degeneracy of a given energy state; A is Einstein coefficient for spontaneous emission; N is the total population of the atom or ion concerned; λ is wavelength; Z is partition function; W is energy of the upper state; k is Boltzmann’s constant and Te is the electron temperature. From this equation, I∝N, and this is the basis of construction calibration curve to realize quantitative analysis for one element. The only parameter affecting calibration curve is Te, which is dependent on the matrix and ablation conditions. Therefore, if one calibration curve of the absolute intensity versus concentration is obtained using standard samples, quantitative analysis of an analyzed sample with similar matrix as the standard sample and under same ablation condition with LIBS will be possible.
If the intensity ratio of a spectral line emitted by a trace element (denoted i) to that emitted by the major constituent (j) is taken, then
 (2)
(2)
where ΔW=W2-W1. If ΔW≈0, the intensity ratio will be independent (or only a weak function) of temperature. This is the basis of internal standard calibration for quantitative analysis.
3.2 Time-resolved detection and spectra observation
At a few microseconds after laser ablation, the spectrum of the plasma is dominated by continuum emission. Electron ion collisions in the plasma plume produce Bremsstrahlung radiation across the bandwidth. This radiation shows short lifetime. As the plasma cools down, the electron density of the plasma decreases and the continuum emission fades. Atomic emissions are clear enough to detect. Fig.2 shows the temporal profile of Cu 324.75 nm line obtained under 15 mJ excitation pulse energy. The saturated peak at the beginning is electron Bremsstrahlung emission. Starting from 3 μs, Cu atomic emission is dominated. This can be proofed by tuning the monochromator to a wavelength without atomic emission and recording temporal profile of the continuum emission. To reduce the contribution of the Bremstrahlung emission to the background signal, a time-resolved detection is necessary. Adequate gate delay and gate width should be selected according to emission duration of different atomic lines. In this work, for lines of different analyzed elements, gate delay was set at 5 μs and gate width was 2.5 μs. Fig.3 shows a typical spectrum of aluminum alloy (Sample No. GBW02215) recorded under these gate parameters.
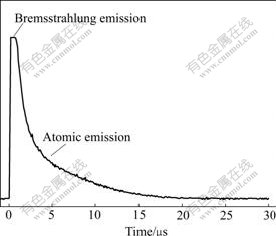
Fig.2 Temporal profile of Cu emission at 324.75 nm from laser- induced plasma of aluminum alloy
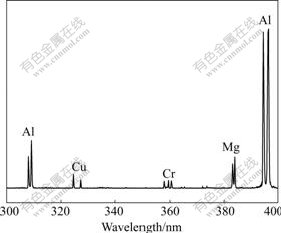
Fig.3 Typical plasma emission spectrum of aluminum alloy obtained with 5 μs gate delay and 2.5 μs gate width under 15 mJ laser energy
3.3 Signal reproducibility
The main reason of using internal calibration is to reduce error from variation of mass ablation and plasma property for each laser shot. If the LIBS system works under stable condition, plasma emission will be only affected by laser energy and inhomogeneity of the samples. These can be reduced by averaging the signal for many events under the same experimental conditions. In our experiments, we first observed signal fluctuation for single laser shot (the maximum signal fluctuation is larger than 12%); then we set the oscilloscope at 128 averaged mode and to take average of Cu 324.75 nm emission for 1 min (300 shots) for ten times. The results are plotted in Fig.4. The statistical relative standard deviation is reduced to 5%. Therefore, the averaged signal intensity can be used directly to construct calibration curves for the trace elements in aluminum alloys based on standard samples within small deviation.

Fig.4 Signal reproducibility and relative standard deviation of Cu 324.75 nm emission (Signal is averaged for 300 shots; 5 μs gate delay and 2.5 μs gate width are used to obtain signal intensity; Inlet is overlapped plots of ten temporal profiles)
3.4 Calibration curves
The calibration curves of Mg, Cr, Mn, Cu and Zn were constructed using integrated absolute line intensity and known concentrations for different elements in standard aluminum alloy samples. For all five elements, the same gate parameters were used (5 μs gate delay and 2.5 μs gate width) and the signals were all averaged for 300 shots using oscilloscope. The calibration curves are shown in Figs.5(a)-(c), all fitted with linear lines.
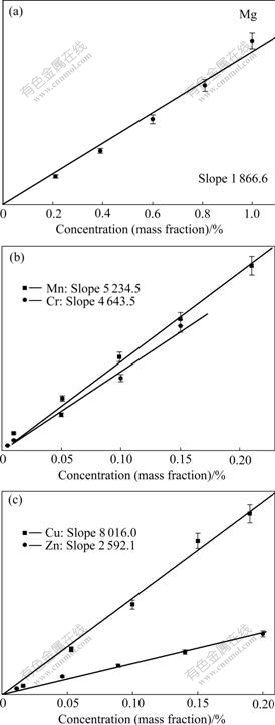
Fig.5 Calibration curves of Mg, Mn, Cr, Cu and Zn for aluminum alloys (Error bars show standard deviations estimated according to different measurements under same condition)
3.5 Limits of detection
The limit of detection(LOD) for each element was determined according to the definition LD=3σB/s, where σB is the standard deviation of the background; s is the sensitivity that is determined by the slope of the calibration curve. σB was determined according to the standard deviation of ten runs of the background signal at a wavelength close to the analyzed line. To obtain the intensity of the background signal, the same gate delay (5 μs) and gate width (2.5 μs) were used. Fig.6 shows background intensity of ten runs, where the detection wavelength is 323.5 nm. The inlet shows temporal profile of ten runs at 323.5 nm and one run at 324.75 nm (Cu line) while using one aluminum standard sample (No. GBW02219).
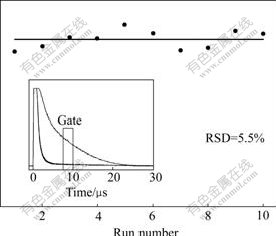
Fig.6 Standard deviation of background signal (Signal is taken at 323.5 nm. Inlet shows temporal profile of ten runs at 323.5 nm and one run at 324.75 nm (Cu line) for comparison)
Table 2 lists the analyzed lines, LODs for different elements achieved in this work and gives a comparison with LODs achieved in other works using same analyzed lines. According to data on signal intensities recorded in our experiments, the estimated error of the determined LODs is approximately equal to ±5%.
Table 2 Comparison of LODs in this work with those in other works using same analyzed lines
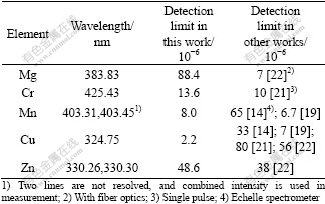
The LOD of Mg is worse than that reported in literature. This is due to self-absorption effect leading to a lower slope of the calibration curve under high concentration than under low concentration. For Cr, Mn and Zn, their LODs are comparable with those reported in other works; For Cu, our LOD is even better.
Further efforts to improve detection limits for different elements in aluminum alloys include: using gateable high voltage on the photomultiplier to reduce contribution of the Bremsstrahlung emission to the background, therefore the signal to background ratio is enhanced; and cooling the photomultiplier tube to decrease thermal noise of the signal.
4 Conclusions
1) A digital storage oscilloscope can be used as signal recording instrument, instead of traditional gate integrator or Boxcar averager, to reduce the cost of a LIBS system.
2) Using LIBS to realize quantitative trace elemental analysis in alloys, the calibration curves can be constructed by absolute line intensity versus concentrations of the elements without internal calibrations.
3) Calibration curves for Mg, Cr, Mn, Cu and Zn are constructed in 4×10⁻⁵-10-2 concentration for aluminum alloys experimentally.
4) (2-90)×10-6 detection limits can be reached for Mg, Cr, Mn, Cu and Zn in aluminum alloys.
References
[1] BASSIOTIS I, DIAMANTOPOULOU A, GIANNOUDAKOS A, ROUBANI- KALANTZOPOULOU F, KOMPITSAS M. Effects of experimental parameters in quantitative analysis of steel alloy by laser-induced breakdown spectroscopy [J]. Spectrochimica Acta Part B―Atomic Spectroscopy, 2001, 56(6): 671-683.
[2] STURM V, VRENEGOR J, NOLL R, HEMMERLIN M. Bulk analysis of steel samples with surface scale layers by enhanced laser ablation and LIBS analysis of C, P, S, Al, Cr, Cu, Mn and Mo [J]. Journal of Analytical Atomic Spectrometry, 2004, 19(4): 451-456.
[3] LOPEZ-MORENO C, AMPONSAH-MANAGER K, SMITH B W, GORNUSHKIN I B, OMENETTO N, PALANCO S, LASERNA J J, WINEFORDNER J D. Quantitative analysis of low-alloy steel by microchip laser induced breakdown spectroscopy [J]. Journal of Analytical Atomic Spectrometry, 2005, 20(6): 552-556.
[4] SANTAGATA A, DE BONIS A, VILLANI P, TEGHIL R, PARISI G P. Fs/ns-dual-pulse orthogonal geometry plasma plume reheating for copper-based-alloys analysis [J]. Applied Surface Science, 2006, 252(13): 4685-4690.
[5] KUZUYA M, ARANAMI H. Analysis of a high-concentration copper in metal alloys by emission spectroscopy of a laser-produced plasma in air at atmospheric pressure [J]. Spectrochimica Acta Part B― Atomic Spectroscopy, 2000, 55(9): 1423-1430.
[6] KIM D E, YOO K J, PARK H K, OH K J, KIM D W. Quantitative analysis of aluminum impurities in zinc alloy by laser-induced breakdown spectroscopy [J]. Applied Spectroscopy, 1997, 51(1): 22-29.
[7] JURADO-LOPEZ A, DE CASTRO M D L. Laser-induced breakdown spectrometry in the jewellery industry (Part I): Determination of the layer thickness and composition of gold-plated pieces [J]. Journal of Analytical Atomic Spectrometry, 2002, 17(5): 544-547.
[8] CORSI M, CRISTOFORETTI G, PALLESCHI V, SALVETTI A, TOGNONI E. A fast and accurate method for the determination of precious alloys caratage by Laser Induced Plasma Spectroscopy [J]. European Physical Journal D, 2001, 13(3): 373-377.
[9] CRAVETCHI I V, TASCHUK M, RIEGER G W, TSUI Y Y, FEDOSEJEVS R. Spectrochemical microanalysis of aluminum alloys by laser-induced breakdown spectroscopy: Identification of precipitates [J]. Applied Optics, 2003, 42(30): 6138-6147.
[10] CRAVETCHI I V, TASCHUK M, TSUI Y Y, FEDOSEJEVS R. Scanning microanalysis of Al alloys by laser-induced breakdown spectroscopy [J]. Spectrochimica Acta Part B―Atomic Spectroscopy, 2004, 59(9): 1439-1450.
[11] RAI A K, YUEH F Y, SINGH J P, ZHANG H S. High temperature fiber optic laser-induced breakdown spectroscopy sensor for analysis of molten alloy constituents [J]. Review of Scientific Instruments, 2002, 73(10): 3589-3599.
[12] RAI A K, YUEH F Y, SINGH J P. Laser-induced breakdown spectroscopy of molten aluminum alloy [J]. Applied Optics, 2003, 42(12): 2078-2084.
[13] FREEDMAN A, IANNARILLI F J, WORMHOUDT J C. Aluminum alloy analysis using microchip-laser induced breakdown spectroscopy [J]. Spectrochimica Acta Part B―Atomic Spectroscopy, 2005, 60(7/8): 1076-1082.
[14] DETALLE V, H?ON R, SABSABI M, ST-ONGE L. An evaluation of a commercial ?chelle spectrometer with intensified charge- coupled device detector for materials analysis by laser-induced plasma spectroscopy [J]. Spectrochimica Acta Part B―Atomic Spectroscopy, 2001, 56: 1011-1025.
[15] CRISTOFORETTI G, LEGNAIOLI S, PALLESCHI V, SALVETTI A, TOGNONI E, BENEDETTI P A, BRIOSCHI F, FERRARIO F. Quantitative analysis of aluminium alloys by low-energy, high-repetition rate laser-induced breakdown spectroscopy [J]. Journal of Analytical Atomic Spectrometry, 2006, 21(7): 697-702.
[16] FORNARINI L, COLAO F, FANTONI R, LAZIC V, SPIZZICCHINO V. Calibration analysis of bronze samples by nanosecond laser induced breakdown spectroscopy: A theoretical and experimental approach [J]. Spectrochimica Acta Part B―Atomic Spectroscopy, 2005, 60: 1186-1201.
[17] CUI Z F, ZHANG X Y, YAO GX, WANG X L, XU X S, ZHENG X F, FENG E Y, JI X H. Quantitative analysis of the trace element in Cu-Pb alloy by the LIBS [J]. Acta Physica Sinica, 2006, 55(9): 4506-4513.
[18] ZHAO S H, CHEN J Z. The application of the high-energy laser-induced plasma technology in the analysis of the substance’s composition [J]. Chinese Journal of Spectroscopy Laboratory, 2005, 22(2): 235-237.
[19] LE DROGOFF B, MARGOT J, CHAKER M, SABSABI M, BARTH?LEMY O, JOHNSTON T W, LAVILLE S, VIDAL F, VON KAENEL Y. Temporal characterization of femtosecond laser pulses induced plasma for spectrochemical analysis of aluminum alloys [J]. Spectrochimica Acta Part B―Atomic Spectroscopy, 2001, 56(6): 987-1002.
[20] STAVROPOULOS P, PALAGAS C, ANGELOPOULOS G N, PAPAMANTELLOS D N, COURIS S. Calibration measurements in laser-induced breakdown spectroscopy using nanosecond and picosecond lasers [J]. Spectrochimica Acta Part B―Atomic Spectroscopy, 2004, 59: 1885-1892.
[21] ISMAIL M A, CRISTOFORETTI G, LEGNAIOLI S, PARDINI L, PALLESCHI V, SALVETTI A, TOGNONI E, HARITH M A, Comparison of detection limits, for two metallic matrices, of laser-induced breakdown spectroscopy in the single and double-pulse configurations [J]. Analytical and Bioanalytical Chemistry, 2006, 385(2): 316-325.
[22] RAI A K, ZHANG H S, YUEH F Y, SINGH J P, WEISBURG A. Parametric study of a fiber-optic laser-induced breakdown spectroscopy probe for analysis of aluminum alloys [J]. Spectrochimica Acta Part B―Atomic Spectroscopy, 2001, 56(12): 2371-2383.
[23] VRENEGOR J, NOLL R, STURM V. Investigation of matrix effects in laser-induced breakdown spectroscopy plasmas of high-alloy steel for matrix and minor elements [J]. Spectrochimica Acta Part B―Atomic Spectroscopy, 2005, 60: 1083-1091.
[24] XU L, BULATOV V, GRIDIN V V, SCHECHTER I. Absolute analysis of particulate materials by laser-induced breakdown spectroscopy [J]. Analytical Chemistry, 1997, 69: 2103-2108.
[25] ADRAIN R S, WATSON J. Laser microspectral analysis: A review of principles and applications [J]. Journal of Physics D: Applied Physics, 1984, 17: 1915-1940.
Foundation item: Project supported by Research Funding and Hundred-Step-Ladder Climbing Program of South China University of Technology, China
Corresponding author: LI Run-hua; Tel: +86-20-39611376; E-mail: rhli@scut.edu.cn
(Edited by YANG Bing)

