
Effect of Sn4+ content on properties of indium tin oxide nanopowders
XU Bao-qiang(徐宝强)1, 2, 3, FENG Rui-kang(冯瑞康)4, YANG Bin(杨 斌)1, 2, 3, DENG Yong(邓 勇)1, 2, 3
1. National Engineering Laboratory for Vacuum Metallurgy, Kunming 650093, China;
2. Faculty of Metallurgical and Energy Engineering, Kunming University of Science and Technology, Kunming 650093, China;
3. Key Laboratory for Non-ferrous Vacuum Metallurgy of Yunna Province, Kunming 650093, China;
4. Henan Yuguang Gold and Lead Group Co., Ltd., Henan 454650, China
Received 6 July 2009; accepted 18 January 2010
Abstract: Indium tin oxide (ITO) nanopowders were prepared by a modified chemical co-precipitation process. The influence of different SnO2 contents on the decomposition behavior of ITO precursors, and on the phase and morphology of ITO precursors and ITO nanopowders were studied by X-ray diffractometry, transmission electron microscopy and differential thermal and thermogravimetry analysis methods. The TG-DSC curves show that the decomposition process of precursor precipitation is completed when the temperature is close to 600 ℃ and the end temperature of decomposition is somewhat lower when the doping amount of SnO2 is increased. The XRD patterns indicate that the solubility limit of Sn4+ relates directly to the calcining temperature. When being calcined at 700 ℃, a single phase ITO powder with 15% SnO2 (mass fraction) can be obtained. But, when the calcining temperature is higher than 800 ℃, the phase of SnO2 will appear in ITO nanopowders which contain more than 10% SnO2. The particle size of the ITO nanopowders is 15-25 nm. The ITO nanoparticles without Sn have a spherical shape, but their morphology moves towards an irregular shape when being doped with Sn4+.
Key words: indium tin oxide (ITO); chemical precipitation; nano-particle; SnO2
1 Introduction
Transparent conducting oxides (TCOs) with high transparency in the visible region and high conductivity have attracted much attention due to their technological applications[1-2]. Tin-doped indium oxide films (or indium tin oxide films), as a kind of TCO materials, are widely used in a variety of opto-applications such as transparent electrodes in liquid crystal display (LCD), plasma display panels (PDP), organic light emitting diodes (OLEDs), transparent conducting thin films, coating materials in CRTs, solar cells, solid-state image sensors and energy-efficient windows[3-7], due to the wide bandgap of indium oxide (direct gap of 3.55-3.75 eV), good transparency (better than 90% at 550 nm) and low resistivity (10-5-10-4 Ω・cm)[8-14].
When SnO2 is doped in In2O3, the electrical conductivity will increase. The reason is that Sn4+ doping causes n-type doping of the lattice by providing an electron to the conduction band. But, Sn doping is limited because the solubility limit of Sn4+ in In2O3 is about 6%-8% (mole fraction)[15] with a chemical co-precipitation process. In this work, influence of different SnO2 contents on ITO nanopowders was investigated using a modified chemical co-precipitation process.
2 Experimental
2.1 Raw materials
The composition of metal indium as the In3+ source is listed in Table 1. Tin tetrachloride pentahydrate (A.R.) was used as the Sn4+ source. 25% ammonia water (A.R.) and ammonia sulfate (A.R.) were used to adjust the pH in the precipitation process and absolute ethanol (A.R) was used as the dispersion medium in the washing process.
Table 1 Composition of metal indium (mass fraction, %)

2.2 Experimental procedure
The metal indium was dissolved in dilute sulfuric acid to form indium sulfate solution with 50 g/L In3+, and SnCl4?5H2O was dissolved in deionized water to make a solution of 30 g/L Sn4+. Mixed solutions corresponding to compositions of 0%, 5%, 10%, and 15% SnO2 (mass fraction) in ITO powders were prepared. A mixed solution of (NH4)2SO4 and NH3?H2O with a pH of 9.0 was prepared as the primary reaction liquid in a three-necked bottle in a water bath. By using two different peristaltic pumps, the mixed solution of In3+ and Sn4+ and 25% ammonia solution were simultaneously added into a reactor in 40 ℃ water bath with mechanical stirring at 1 000 r/min. In this injection process, the injection rate for the mixed solution of In3+ and Sn4+ was held constant at 3.0 mL/min and the injection rate for ammonia was adjusted to maintain the pH at 9.0. After the precipitation process, the reaction solution was heated to 80 ℃ while continually stirring for 1 h, then aged at room temperature for 12 h. The resultant suspension was filtered and washed with deionized water and absolute ethanol by ultrasonic dispersion to remove the residual impurities, such as ammonia sulfate and ammonia chloride. The final filter cake was dried at 85 ℃ in a vacuum drying oven for 16 h, and then calcined at different temperatures for 4 h to obtain the ITO powders.
2.3 Characterization of ITO powders
The phase and the crystallographic structure of the samples were characterized from their X-ray diffraction (XRD) patterns, recorded using a Rigaku (Japan) D/max-3B X-ray diffractometer equipped with graphite- monochromatized Cu Kα radiation produced at 40 kV and 30 mA. The transmission electron microscopy (TEM, HITACHI H-800) was used to observe the morphology and particle size of the ITO nanopowders. The TG-DSC curves of the samples were recorded using a STA409 PC/PG TGA-DTA analyzer, from the NETZSCH Company in Germany, at 10 ℃/min in atmosphere.
3 Results and discussion
3.1 Influence of different SnO2 contents on ITO precursors
Fig.1 shows the X-ray diffraction patterns of the ITO precursors from ITO powders containing 0%, 5%, 10% and 15% SnO2. The XRD peaks are consistent with the data of Card 16-0161 in the JCPDS file of In(OH)3 with a cubic phase[16] and there are no any other crystal peaks, which indicates that the Sn4+ has been doped into the precursors. But the amorphous scattering peaks in every pattern indicate that the crystal precursors are not perfect, and depend on the aging time and temperature during the preparation process. When Sn4+ is doped, the intensity of the peaks decreases and the peaks are broadened.
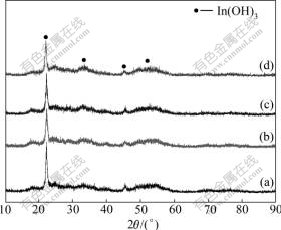
Fig.1 XRD patterns of ITO precursors with different SnO2 contents: (a) 0; (b) 5%; (c) 10%; (d) 15%
Fig.2 shows the TEM images of the ITO precursors corresponding to powders containing 0%, 10% and 15% of SnO2. It can be seen from Fig.2 that the SnO2 content does not significantly affect the grain size of the precipitates, and it can also be seen that these precipitates do not have a perfect crystal shape, which is consistent with the XRD results reported above.

Fig.2 TEM images of ITO precursors: (a) 0% SnO2; (b) 10% SnO2; (c) 15% SnO2
In order to investigate the decomposition behavior and to obtain the calcining temperature of ITO precursors, TG-DSC curves of precipitates corresponding to powders containing 0%, 10% and 15% of SnO2 were examined and the results are shown in Fig.3. TG curves indicate that the precursors with different SnO2 contents have similar decomposition behavior. According to the TG-DSC curves, the decomposition process has three main stages. Stage I is a period where adhesive water on the precursors of ITO leaves the surfaces of the ITO precursors below 100 ℃. The strongest endothermic peak indicates the process from precursors to ITO powders happening mainly in the range of 100-360 ℃ in Stage Ⅱ with the fastest decomposition rate. The rest of the hydration water is removed in Stage Ⅲ. When the temperature is close to 600 ℃, the TG curves tend to flatten to a straight line, which indicates that the decomposition process has finished.
The theoretical mass loss is 16.28% from In(OH)3 to In2O3 and 19.28% from Sn(OH)4 to SnO2, which would give mass losses of the precursor powders containing 0, 10% and 15% of SnO2, of 16.28%, 16.58% and 16.73%, respectively. In Figs.3(a), (b), and (c), the total mass losses of Stage Ⅱ and Stage Ⅲ are 16.98%, 17.36 and 17.33%, respectively. These measured mass losses are more than those calculated results from the adhesive water on the surfaces of the ITO precursors. Additionally, Fig.3 suggests that the decomposition temperature will be lower by increasing the doping amount of SnO2.

Fig.3 TG-DSC curves of ITO precursors with different SnO2 contents: (a) 0; (b) 10%; (c) 15%
3.2 XRD analysis of ITO powders doped with different amounts of SnO2
Figs.4(a) and (b) show the XRD patterns of ITO powders, containing 0, 5%, 10% and 15% SnO2 sintered for 4 h at 700 ℃ and 900 ℃, respectively. In Fig.4(a), all XRD peaks well match with the data of the Card 6-0416 in the JCPDS file of In2O3 with cubic phase[17], which indicates that all SnO2 is soluble in In2O3 and forms a single phase of ITO. The sharp diffraction peaks present the powder of ITO with perfect crystalline. When sintering at 900 ℃ in Fig.4(b), the phase SnO2[15] is seen in the composition of 10% and 15% SnO2 and it is also observed when being calcined above 800 ℃ according to the X-ray diffraction patterns of the ITO powders with 10% SnO2 calcined at different temperatures for 4 h, as shown in Fig.5. This indicates that the higher the calcining temperature, the lower the solid solubility of SnO2 in In2O3. This result is similar to that of KIM’s group but the tin compound phase that appeared in XRD patterns is different from that found in their work[15]. PRAMANIK et al[18] reported that when ITO precursors were calcined at 300 ℃, only the cubic phase of In2O3 existed up to In-to-Sn ratio of 70:30 (mole fraction, %)[18]. As shown in Fig.5, the XRD peaks become sharper at the higher calcining temperature, which implies that the ITO nanopowders are better crystallized at higher calcining temperatures.
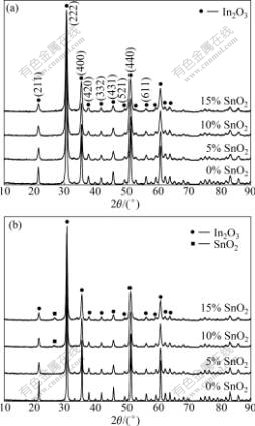
Fig.4 X-ray diffraction patterns of ITO powders with different SnO2 contents calcined for 4 h at different temperatures: (a) 700 ℃; (b) 900 ℃
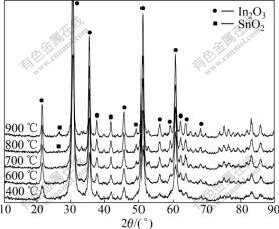
Fig.5 X-ray diffraction patterns of ITO powders with 10% SnO2 calcined at different temperatures for 4 h
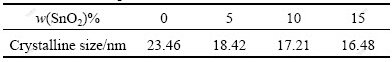
In addition, the XRD peaks of ITO powders are broaden remarkably with increasing SnO2 content, as seen in Fig.4. The crystalline sizes of the (222) face of crystalline ITO particles with different SnO2 contents calcined at 700 ℃ for 4 h were calculated using the Derby-Scherrer formula and the results are given in Table 2, which indicates that doping with SnO2 makes the ITO particles have smaller crystalline sizes.
Table 2 Crystalline sizes of crystal face (222) on ITO particles with different SnO2 contents calcined at 700 ℃ for 4 h
3.3 Morphology of ITO nanoparticles doped with different SnO2 contents
Fig.6 shows the TEM images of ITO nanoparticles calcined at 700 ℃ for 4 h with different SnO2 contents. It can be seen from Fig.6 that the particle size of the ITO powders is somewhat alike between 15 and 25 nm regardless of the SnO2 content, and the size of the ITO particles seems to be smaller when Sn4+ is doped. With respect to the morphology of the ITO nanoparticles, a spherical shape is observed in the case of 0% SnO2. However, the particles having a spherical shape decrease and the morphology tends towards an irregular shape when Sn4+ is doped, as in the case of 5%, 10% and 15% SnO2, which may relate to the fact that doping with Sn4+ can refine the crystalline of In2O3.
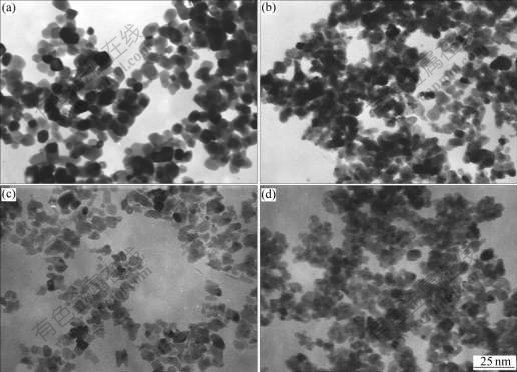
Fig.6 TEM images of ITO nanoparticles calcined at 700 ℃ for 4 h with different SnO2 contents: (a) 0; (b) 5%; (c) 10%; (d) 15%
4 Conclusions
1) The content of SnO2 doped into the ITO precursors has no significant effect on the phase, morphology and decomposition behavior of the precipitates in our experiments. TG-DSC curves show that the decomposition process is complete when the temperature is close to 600 ℃, and the final decomposition temperature is somewhat lower when the doping amount of SnO2 is increased.
2) The XRD analysis of the ITO powders indicates that SnO2 has a certain solubility in ITO powders and that the solubility limit depends on the calcining temperature. When being calcined at 700 ℃, a single phase ITO powder with 15% SnO2 can be obtained. But, when being calcined up to 800 ℃, SnO2 diffraction peaks appear in the XRD patterns of the ITO powders when they contain more than 10% SnO2.
3) Sn4+ can reduce the crystalline size of ITO powders according to the broadened XRD peaks, and is confirmed from calculations using the Derby-Scherrer formula. The particle size of ITO nanopowders synthesized by the modified chemical coprecipitation process used in our research is 15-25 nm regardless of the SnO2 content. ITO nanoparticles with 0% SnO2 have a spherical shape, but their morphology tends towards an irregular shape when Sn4+ is doped into the In2O3.
Acknowledgments
The authors gratefully acknowledge the help of Professor KAN Jia-de and Professor LIU from Yunnan University, and Professor LI Jian from Kunming University of Science and Technology for their help with the XRD, TEM and TG-DSC analysis.
References
[1] SONG J E, LEE D K, KIM D K, KIM Y I, KANG Y S. Preparation and characterization of monodispersed indium-tin oxide nanoparticles [J]. Colloids and Surfaces A: Physicochemical and Engineering Aspects, 2005, 257/258: 539-542.
[2] ITO N, SATO Y, SONG P K, KAIJIO A, INOUE K, SHIGESATO Y. Electrical and optical properties of amorphous indium zinc oxide films [J]. Thin Solid Films, 2006, 496: 99-103.
[3] OMANOVIC S, METIKOS H M. A study of the kinetics and mechanisms of electrocrystallization of indium oxide on an in situ prepared metallic indium electrode [J]. Thin Solid Films, 2004, 458: 52-62.
[4] SHIGESATO Y, KOSHI I R, KAWASHIMA T, OHSAKO J. Early stages of ITO deposition on glass or polymer substrates [J]. Vacuum, 2000, 59: 614-621.
[5] KAVEI G, MOHAMMADI G A. The effects of surface roughness and nanostructure on the properties of indium tin oxide (ITO) designated for novel optoelectronic devices fabrication [J]. Journal of Materials Processing Technology, 2008, 208: 514-519.
[6] OUERFELLI J, OURO D S, BERNEDE J C, CATTIN L, MORSLI M, BERREDJEM Y. Organic light emitting diodes using fluorine doped tin oxide thin films, deposited by chemical spray pyrolysis, as anode [J]. Materials Chemistry and Physics, 2008, 112: 198-201.
[7] LEE W, KWAK C G, MANE R S, MIN S K, CAI G, GANESH T, KOO G, CHANG J, CHO B W, KIM S K, HAN S H. Enhanced photocurrent in RuL2(NCS)2/di-(3-aminopropyl)-viologen/SnO2/ITO system [J]. Materials Chemistry and Physics, 2008, 112: 208-212.
[8] ALFANTAZI A M, MOSKALYK R R. Processing of indium: A review [J]. Minerals Engineering, 2003, 16: 687-694.
[9] PUJILAKSONO B, KLEMENT U, NYBORG L, NYBORG L, JELVESTAM U, HILL S, BURGARD D. X-ray photoelectron spectroscopy studies of indium tin oxide nanocrystalline powder [J]. Material Characterization, 2005, 54: 1-7.
[10] BESBES S, OUADA H B, DAVENAS J, PONSONNET L, JAFFREZIC N, ALCOUFFE P. Effect of surface treatment and functionalization on the ITO properties for OLEDs [J]. Materials Science and Engineering C, 2006, 26: 505-510.
[11] GRANQVIST C G, HUTAKER A. Transparent and conducting ITO film: New developments and applications [J]. Thin Solid Films, 2002, 411: 1-5.
[12] KIM G Y, OH J S, CHOI E H, CHO G S, KANG S O, CHO J. Work function change on O-plasma treated indium-tin-oxide [J]. Materials Science and Engineering B, 2003, 100: 275-279.
[13] HAYNES T E, SHIGESATO Y, YASUI I, TAGA N, ODAKA H. Ion beam modification of transparent conducting indium-tin-oxide thin films [J]. Nuclear Instruments and Methods in Physics Research (Section B): Beam Interactions with Materials and Atoms, 1997, 121: 221-225.
[14] SREENIVAS K, MANSINGH A. The growth and structure of RF sputtered indium tin oxide thin films [J]. Applications of Surface Science, 1985, 22/23: 670-680.
[15] KIM S M, SEO K H, LEE J H, KIM J J, LEE H Y, LEE J S. Preparation and sintering of nanocrystalline ITO powders with different SnO2 content [J]. Journal of the European Ceramic Society, 2006, 26: 73-80.
[16] 16-0161. Joint Committee on Powder Diffraction Standards. Diffraction Data File [S]. 1991.
[17] 6-0416. Joint Committee on Powder Diffraction Standards. Diffraction Data File [S]. 1991.
[18] PRAMANIK N C, DAS S, BISWAS P K. The effect of Sn(Ⅳ) on transformation of co-precipitated hydrated In(Ⅲ) and Sn(Ⅳ) hydroxides to indium tin oxide (ITO) powder [J]. Materials Letters, 2002, 56: 671-679.
Foundation item: Project(U0837604) supported by the Natural Science Foundation of Yunnan Province, China; Project (07C40291 ) supported by Research Fund of Yunnan Education Department, China; Project (2007003) supported by Research Fund of Kunming University of Science and Technology, China
Corresponding author: YANG Bin; Tel: +86-871-5114017; E-mail: kgyb2005@126.com
DOI: 10.1016/S1003-6326(09)60192-8
(Edited by LI Xiang-qun)

