J. Cent. South Univ. (2012) 19: 688-695
DOI: 10.1007/s11771-012-1058-6
Optimal design of vegetation in residential district with
numerical simulation and field experiment
HONG Bo(洪波)1, LIN Bo-rong(林波荣)2, WANG Bing(王冰)2, LI Shu-hua(李树华)2
1. Department of Ornamental Horticulture and Landscape Architecture,China Agricultural University, Beijing 100193, China;
2. School of Architecture, Tsinghua University, Beijing 100084, China
? Central South University Press and Springer-Verlag Berlin Heidelberg 2012
Abstract: Vegetation plays a key role in improving wind environment of residential districts, and is helpful for creating a comfortable and beautiful living environment. The optimal design of vegetation for wind environment improvement in winter was investigated by carrying out field experiments in Heqingyuan residential area in Beijing, and after that, numerical simulation with SPOTE (simulation platform for outdoor thermal environment) experiments for outdoor thermal environment of vegetation was adopted for comparison. The conclusions were summarized as follows: 1) By comparing the experimental data with simulation results, it could be concluded that the wind field simulated was consistent with the actual wind field, and the flow distribution impacted by vegetation could be accurately reflected; 2) The wind velocity with vegetation was lower than that without vegetation, and the wind velocity was reduced by 46%; 3) By adjusting arrangement and types of vegetation in the regions with excessively large wind velocity, the pedestrian-level wind velocity could be obviously improved through the simulation and comparison.
Key words: wind environment; simulation platform for outdoor thermal environment (SPOTE); field experiment; optimal design of vegetation; simulation
1 Introduction
With the enlargement of urban scale, accompanied by the constant increase of population and area of residential lands in recent years, residential district has become an apparent heat source in cities, and results in gradual deterioration of urban thermal environment, as well as the deterioration of the thermal environment of residential areas [1-5]. The outdoor thermal environment of residential areas has various problems in both summer and winter. Better ventilation is considered a crucial measure for improving the outdoor thermal environment in summer. On the other hand, stronger wind in winter is regarded as being highly unpleasant due to its poor influences on pedestrian thermal comfort [6].
The difference in underlying surface properties of different residential areas is currently considered to be one of the most important factors related to the formation of heat islands [7]. Such research has concentrated on improving the outdoor thermal environment by changing the arrangement of the building and building coverage ratio for a given background [8-9]. Therefore, planting of vegetation is accepted as a means of easing the uncomfortable outdoor thermal environment in urban areas during summer and winter [10-11]. It has been found on average that about 80% of the cooling effect in hot and humid climate regions is contributed by vegetation shading [12], and the relief effect on the outdoor thermal environment of plant arrangements has also attracted attention from the point of view of promoting latent-heat evaporation and solar shading [13]. In addition, vegetation would decrease the upstream wind velocity obviously [14]. However, most of these research efforts have been concerned with the development of an evaluation method to measure the effect of these techniques on the outdoor thermal environment. An optimal design of vegetation for the outdoor thermal environment has not been developed sufficiently.
Despite the import influence of vegetation on thermal environment in residential areas, the current vegetation design only considers that visual requirements or the arrangements of vegetation are actually often made empirically from the varying standpoints of conventional planning concepts for landscape design [15]. There is almost no example of research in the optimal design system for vegetation. On the other hand,or the designer, it would be very useful to develop an optimal design for vegetation. Furthermore, a typical problem for residential quarters in Beijing is that the long and cold winter is impacted by monsoon climate, where the wind velocity is too great and the frequency is high [16]. It is necessary and significant to study the optimal design of vegetation to improve wind environment in winter.
Combining field experimental tests with numerical studies by simulation platform for outdoor thermal environment (SPOTE) [17], the optimal design of vegetation was investigated in this work to achieve the best windproof effect in winter for living areas, in order to provide references for design of vegetation in residential districts in Beijing, China.
2 Methodology
2.1 Research method
Figure 1 shows the flow of the optimal vegetation design system for improving wind environment in residential areas using numerical simulation and field experiment. This optimum design system was composed of the following three stages: 1) Initially, an optimization problem was established by the designer; 2) Next, numerical analysis was performed on the outdoor wind environment using SPOTE; 3) Thirdly, by consistency of model simulation and experimental testing, the influences of vegetation on wind environment were investigated, and the optimum solution candidates and the optimum process were examined. Hence, as the first step, the design objective and evaluation method were determined in these stages. In the second stage, models including vegetation and buildings were used to analyze the outdoor environment. In the third stage, in order to investigate the influence of vegetation on wind field, numerical simulations were carried out. Further, the optimal design of vegetation was examined for improved wind environment in winter. Thus, the optimal vegetation design for comfortable wind environment was carried out.
2.2 Field experiment
Heqingyuan residential area is located at the north site of Tsinghua University, with Heqing Road to the north, southwest residential area to the west, and China Redbud Apartment to the east. With an area of 7.44×10⁶ m2, buildings are distributed in rows and there is a main road dividing the whole area into two symmetrical sections, each of which has an open activity area. The green space between buildings is large with various vegetation patterns designed and arranged. This is suitable for comparison research, for it can better reflect the impact of vegetation on wind environment.
Portable weather stations were used in this work to measure wind velocity (measurement accuracy: 0.1 m/s, measurement range: 0-70 m/s, measurement error: ±(0.3+3%) m/s and wind direction (measurement accuracy: 1°, measurement range: 0-360°, measurement error: ±3°), as well as air temperature and humidity.
Under consideration of attenuation effect of vegetation on wind and the location of concentrated open activity areas for residents, a total of eight measuring points were installed for studying the impact of air flow on the daily activities of local residents. Meanwhile, the attenuation effect of different vegetation types and arrangements on wind velocity could also be investigated (Fig. 2).
Testing time was January 23rd, 2011, and the dominant wind direction was west-north with the velocity of 3-5 m/s. Measurement parameters included wind velocity, wind direction, temperature with a 1 min sample frequency. The values were taken for several times with the average value obtained in the stable wind field.
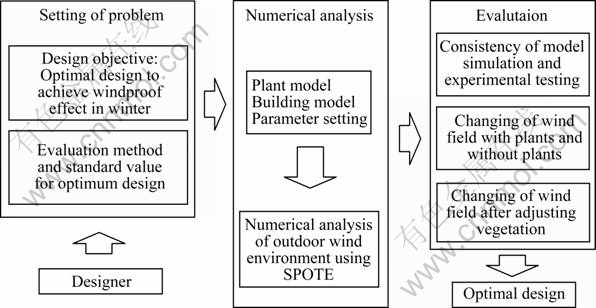
Fig. 1 Schematic diagram of optimal design for vegetation
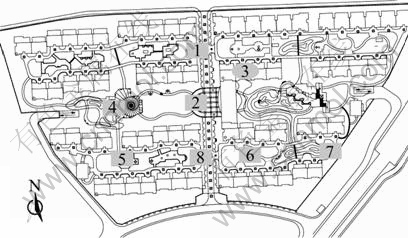
Fig. 2 Layout of measuring points in experiment
2.3 Numerical simulation study
In order to compare results of experiment and simulation, models should be built based on the actual environment, including proper vegetation and building models. SPOTE, consisting of an air model, vegetation model, underlying surface model and a general radiation calculation model, and validated by a filed measurement in the summer of 2002 [18], was selected for numerical simulations in this work, and coupled calculations of radiation, convection, conduction and air flow were carried out considering vegetation influences. Standard k-ε turbulence model and incoming gradient wind were taken as boundary conditions. Other simulation settings were implemented with the AIJ guidance [19].
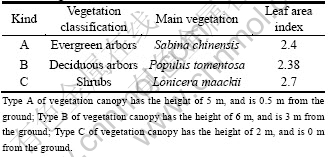
Vegetation was described as porous medium in micro-environmental simulation in the vicinity of buildings. Therefore, the following simplifications have been made: 1) The canopy (leaves + branches) was considered as an organic whole, i.e. the branches were approximated to be leaves; 2) The trunk was approximated to be the canopy [15]. Based on this theory, the vegetation in study object was classified and modeled.
In this work, vegetation was divided into the following three categories according to height, leaf density and effects on pedestrian. Typical vegetation and final leaf area index for each kind of vegetation are listed in Table 1 [20-21].
Table 1 Vegetation classification
According to the vegetation classification, vegetation and buildings models are shown in Fig. 3.
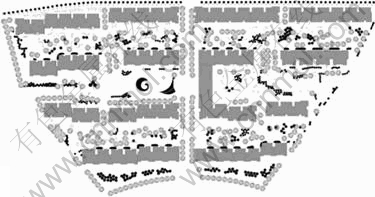
Fig. 3 Building and vegetation model of Heqingyuan residential area
3 Comparisons and analysis
3.1 Comparison of results between experiment and simulation based on measured data
Combining the field measurement data with incoming air velocity, numerical simulation was carried out with SPOTE. The average wind velocity of each point was calculated and compared with the experimental data.
The measured data were consistent well with the simulation results, especially for the wind direction of each measuring point (Fig. 4). Through comparison of the deviation between wind velocity in simulation and experiment, the deviation between experimental and simulation results ranged from 1.45% to 15.02% (Table 2). The following factors should be comprehensively considered: the deviation between vegetation model and actual experiment, errors caused by instrumental measurement and systematic errors. With all these factors considered, it can be concluded that simulated values represent those measured in actual experiment.
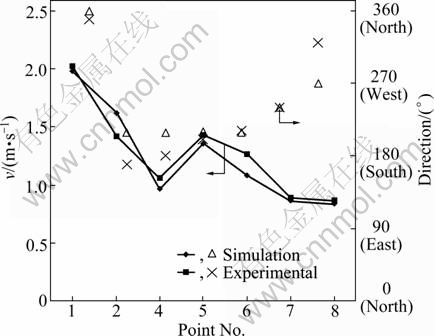
Fig. 4 Comparison of wind velocity and direction between experiment and simulation
3.2 Comparison of simulations with and without vegetation
The experimental data above were selected as boundary conditions for numerical simulation. The simulations with and without vegetation were compared. The comparison results are shown in Figs. 5 and 6.
Table 2 Comparison of wind velocity between experiment and simulation
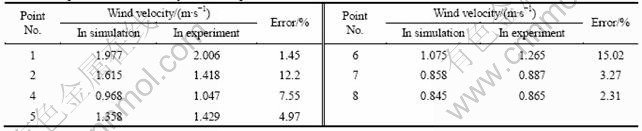
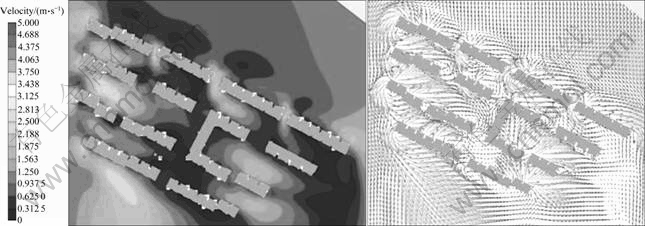
Fig. 5 Simulation without vegetation
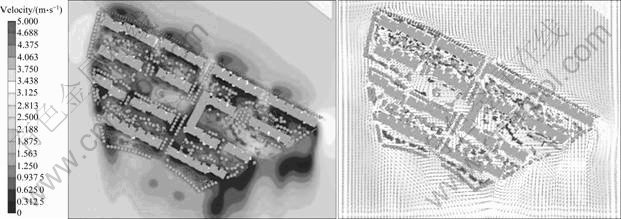
Fig. 6 Simulation with vegetation
Defining δ, a ratio of simulated data with or without vegetation to experimental data, the data of simulations with and without vegetation were compared in Fig. 7 and Fig. 8, respectively, and analysis for the wind environment at pedestrian level was carried out.
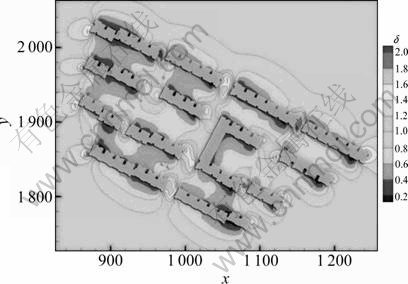
Fig. 7 Distribution of δ in simulation without vegetation
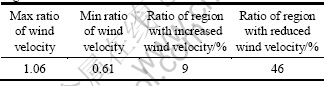
The actual wind velocity increased to a much less extent in areas with vegetation than areas without vegetation, and the wind velocity was reduced by 46% (Table 3). It is strongly indicated that vegetation plays a significantly active role in improving wind environment.
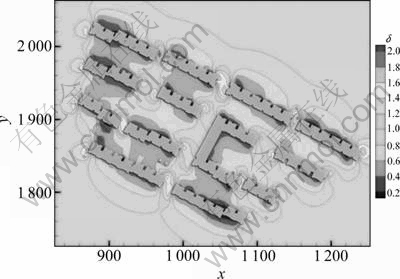
Fig. 8 Distribution of δ in simulation with vegetation
Table 3 Comparison of simulations data with and without vegetation
3.3 Comparison analysis of simulation by varying simulation boundary conditions
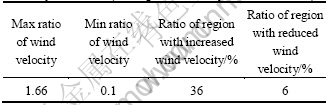
According to experimental data, the condition when coming wind velocity reached 7 m/s was selected for further simulation in order to study potentials for vegetation optimization. The simulation results are shown in Fig. 9.
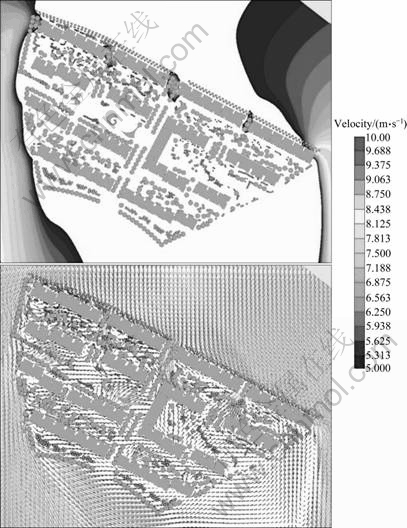
Fig. 9 Simulation results under coming wind velocity of 7.0 m/s
Similarly, the simulation data after the variation of simulation boundary conditions were compared in Figs. 10 and 11.
When the velocity of coming wind increased to 7.0 m/s, wind velocity of open space also increased by 36% (Table 4). Especially, when the winds flowed through a narrow channel, the wind velocity increased more significantly. Among the three buildings windward, the wind velocity was as high as 9 m/s. When the wind velocity is greater than 5 m/s, the residents will feel uncomfortable, and pedestrians will be affected by the wind [22].

Fig. 10 Distribution of δ with coming wind velocity of 3.2 m/s
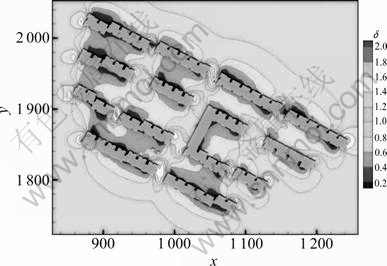
Fig. 11 Distribution of δ with coming wind velocity of 7 m/s
Table 4 Comparison of simulations data by varying simulation boundary conditions (coming wind velocity of 7.0 vs 3.2 m/s)
3.4 Comparison of conditions by adjusting and optimizing layout and types of vegetation
When wind velocity was too great, the wind environment inside the residential area was severely affected. Based on the accuracy of simulation of wind field using SPOTE in this district, appropriate adjustments could be made to mitigate the adverse impact of excessively great wind velocity on pedestrians. Next, the impact of vegetation after adjustment in wind field was verified, and then by optimizing the vegetation types and layout in the residential area, the wind field distribution in this district was improved.
The regions with wind velocity greater than 5 m/s was marked and numbered (Fig. 12). Further analysis of vegetation status and optimum methods in regions was conducted (Figs. 13-15).
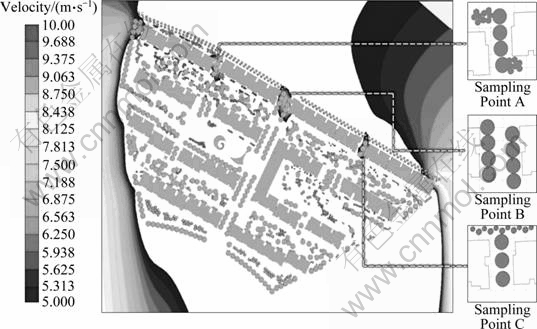
Fig. 12 Vegetation layout plan of velocity region with excessively great wind
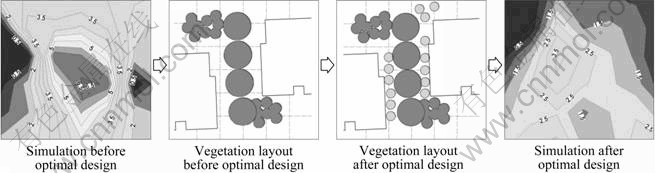
Fig. 13 Optimal design system of vegetation (Sampling Point A)
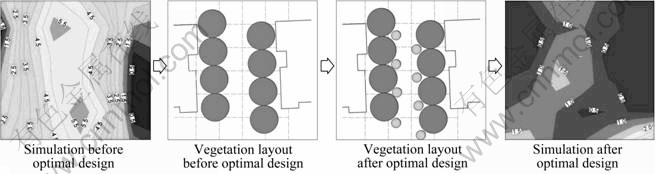
Fig.14 Optimal design system of vegetation (Sampling Point B)
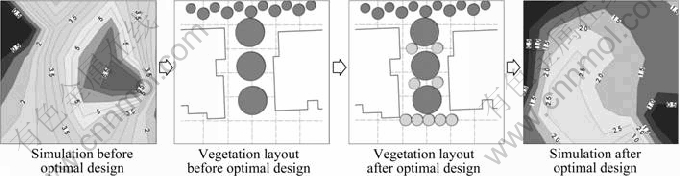
Fig.15 Optimal design system of vegetation (Sampling Point C)
In accordance with the definition of δ above, the data of simulations before and after optimum arrangement of vegetation were compared in Fig.16 and Fig. 17.
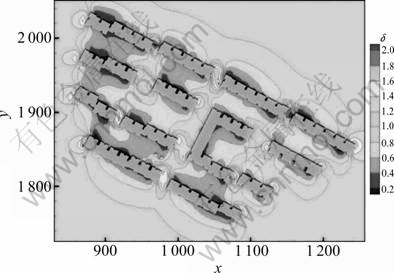
Fig. 16 Distribution of δ before optimization
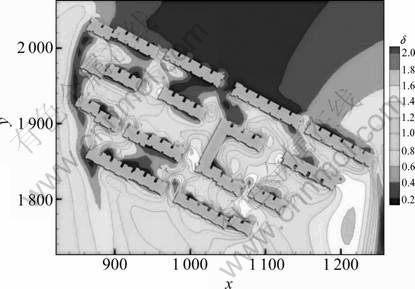
Fig. 17 Distribution of δ after optimization
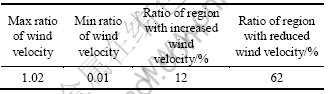
After adjustment and optimization of vegetation on the site, under identical simulation boundary conditions, the wind environment of the residential area was significantly improved, and the wind velocity was reduced by 62% (Table 5). Especially, at the three passages located at the northmost part of residential buildings, wind velocity reduction was relatively more significant after vegetation optimization.
Table 5 Comparison of simulations data by adjusting and optimizing vegetation (After optimization vs before optimization)
4 Conclusions
1) Through a comparison between experiment and simulation based on SPOTE, it could be concluded that the simulation is consistent well with the experiment, and the wind field distribution can be accurately reflected.
2) The wind velocity is obviously decreased with vegetation compared with the case without vegetation. The wind velocity with vegetation situation can be reduced by 1-2 m/s than without vegetation case with a good improvement of 46%.
3) By comparison of simulation results before and after vegetation optimization, the wind environment can be well improved with a reduction by 62%.
References
[1] ANTROP M. Changing patterns in the urbanized countryside of Western Europe [J]. Landscape Ecology, 2000, 15: 257-270.
[2] CAPELUTO I G, YEZIORO A, SHAVIV E. Climatic aspects in urban design―A case study [J]. Building and Environment, 2003, 38: 827-835.
[3] GLUCH R, QUATTROCHI D A, LUVALL J C. A multi-scale approach to urban thermal analysis [J]. Remote Sensing of Environment, 2006, 104: 123-132.
[4] RIZWAN A M, LEUNG Y C, DENNIS, LIU C. A review on the generation, determination and mitigation of Urban Heat Island [J]. Journal of Environmental Science, 2008, 20: 120-128.
[5] ZHANG Yi-ping, ZHANG De-shang. A study about urbanization effect on the indoor and outdoor air temperature of Beijing city [J]. Climatic and Environmental Research, 2002, 09: 345-350. (in Chinese)
[6] CHEN H, OOKA R, KATO S. Study on optimum arrangement of pilots for design of pleasant outdoor wind environment using CFD simulation and Genetic Algorithms (GA) [C]// The Sixth Asia-Pacific Conference on Wind Engineering (APCWE-VI). Seoul: 2005: 1-11.
[7] HUANG Liang-mei, LI Jian-long, ZHAO De-hua, ZHU Ji-yu. A fieldwork study on the diurnal changes of urban microclimate in four types of ground cover and urban heat island of Nanjing, China [J]. Building and Environment, 2008, 43: 7-17.
[8] CHEN H, OOKA R, MURAKAMI S. Study on air quality in urban area using scale for ventilation efficiency. The effect of building shape and its arrangement on ventilation efficiency in urban area [C]// Annual Technical Meetings of Architectural Institute of Japan. Tokyo, Japan: 2001: 933-934. (in Japanese )
[9] ASHIE Y, MURAKAMMI S, MORIGAWA T, MOCHIDA A, OOKA R, OGURO M. CFD analyses on effects of wind from rivers on outdoor thermal environment: Part 2. Control of thermal environment based on building layout [C]// Annual Technical Meetings of Architectural Institute of Japan. Tokyo, Japan: 2002: 881-882. (in Japanese )
[10] OOKA R, CHEN H, KATO S. Study on optimum arrangement of trees for design of pleasant outdoor environment using multi-objective genetic algorithm and coupled simulation of convection, radiation and conduction [J]. Journal of Wind Engineering Industrial Aerodynamics, 2008, 96: 1733-1748.
[11] LIN T P, MATZARAKIS A, HWANG R L. Shading effect on long-term outdoor thermal comfort [J]. Building and Environment, 2010, 45: 213-221.
[12] SHASHUA-BAR L, HOFFMAN M. Vegetation as a climatic component in the design of an urban street: An empirical model for predicting the cooling effect of urban green areas with trees [J]. Energy and Buildings, 2000, 31: 221-233.
[13] YOSHIDA S, MURAKAMI S, OOKA R, MOCHIDA A, TOMINAGA Y. CFD prediction of thermal comfort in microscale wind climate [C]// The International Symposium on Computational Wind Engineering 2000(CWE 2000). Birmingham: 2000: 27-30.
[14] FENG Ning, MA Jie, LIN Bo-rong, ZHU Ying-xin, Impact of landscape on wind environment in residential area [J]. Journal of Central South University of Technology, 2009, 16: 80-83.
[15] LIN Bo-rong. Studies of greening’s effects on outdoor thermal environment [D]. Beijing: Tsinghua University, 2004. (in Chinese)
[16] YAO Peng, HUANG Lei. Winter plant-landscape design on the residential area of Beijing [J]. Journal of Shanxi Agricultural Sciences, 2008, 36: 106-107. (in Chinese)
[17] LIN Bo-rong, Li Xiao-feng, Zhu Ying-xin, Qin You-guo. Numerical simulation studies of the different vegetation patterns’ effect on outdoor pedestrian thermal comfort [J]. Journal of Wind Engineering and Industrial Aerodynamics, 2008, 96: 1707-1718.
[18] LIN Bo-rong. Simulation study of the effects of plants on outdoor thermal environment [C]// Proceedings of the 2005 Simulation Academic Workshop for Chinese HVAC Specialty Boards. Beijing: 2005: 340-348. (in Chinese)
[19] TOMINAGA Y, MOCHIDA A, YOSHIE R, KATAOKA H, NOZU T, YOSHIKAWA M, SHIRASAWA T. AIJ guidelines for practical application of CFD to pedestrian wind environment around buildings [J]. Journal of Wind Engineering and Industrial Aerodynamics, 2008, 96: 1749-1761.
[20] SHAW R H, SEGINER I. The dissipation of turbulence in plant canopies [C]// The 7th Symposium American Meteorological Society on Turbulence and Diffusion. Boulder, 1985: 200-203.
[21] SCHILLING V K. A parameterization for modeling the meteorological effects of tall forests―A case study of a large clearing [J]. Boundary-Layer Meteorology, 1991, 55: 283-304.
[22] LIN Bo-rong, LI Xiao-feng. Thermal environment control and technology improvement in residential district [M]. Beijing: China Architecture and Building Press, 2010: 22-23. (in Chinese)
(Edited by YANG Bing)
Foundation item: Project(50878111) supported by the National Natural Science Foundation of China
Received date: 2011-07-26; Accepted date: 2011-11-14
Corresponding author: LIN Bo-rong, Associate Professor, PhD; Tel: +86-10-62785691; E-mail: linbr@tsinghua.edu.cn

