Crushing analysis and multi-objective optimization of bitubular hexagonal columns with ribs
来源期刊:中南大学学报(英文版)2017年第5期
论文作者:高广军 邹翔 董海鹏 李健 周细赛 陈威 关维元
文章页码:1164 - 1173
Key words:bitubular hexagonal column; axial crushing; crashworthiness optimization; global sensitivity analysis
Abstract: In order to improve the crashworthiness of thin-walled columns, the energy absorption characteristics of three columns under quasi-static axial crushing loads were analyzed through LS-DYNA. Numerical results show that the energy absorption capability of the bitubular hexagonal columns with middle to middle (MTM) ribs is the best, followed by the bitubular hexagonal columns with corner to corner (CTC) ribs and the bitubular hexagonal columns without (NOT) ribs, respectively. Then, the MTM rib was optimized by using multi-objective particle swarm optimization algorithm. Through the analysis of the Pareto front for specific energy absorption (SEA, Ase) and peak crushing force (PCF, Fpc), it is found that there is a vertex on the Pareto front. The vertex has the design parameters of t1=1.2 mm, t2=1.2 mm, Ase=11.3729 kJ/kg, Fpc=235.8491 kN. When the PCF is in a certain size, on the left of the vertex, the point with t2=1.2 mm has the biggest SEA, meanwhile on the right of the vertex, the point with t1=1.2 mm has the biggest SEA. Finally, the global sensitivity analysis was conducted to investigate the effect of two design parameters. The result is obtained that both SEA and PCF for MTM are more sensitive to t1 rather than t2 in the design domain.
Cite this article as: ZOU Xiang, GAO Guang-jun, DONG Hai-peng, LI Jian, ZHOU Xi-sai, CHEN Wei, GUAN Wei-yuan. Crushing analysis and multi-objective optimization of bitubular hexagonal columns with ribs [J]. Journal of Central South University, 2017, 24(5): 1164-1173. DOI: 10.1007/s11771-017-3519-4.
J. Cent. South Univ. (2017) 24: 1164-1173
DOI: 10.1007/s11771-017-3519-4

ZOU Xiang(邹翔), GAO Guang-jun(高广军), DONG Hai-peng(董海鹏), LI Jian(李健),
ZHOU Xi-sai(周细赛), CHEN Wei(陈威), GUAN Wei-yuan(关维元)
Key Laboratory of Traffic Safety on Track of Ministry of Education (School of Traffic &
Transportation Engineering, Central South University), Changsha 410075, China
 Central South University Press and Springer-Verlag Berlin Heidelberg 2017
Abstract: In order to improve the crashworthiness of thin-walled columns, the energy absorption characteristics of three columns under quasi-static axial crushing loads were analyzed through LS-DYNA. Numerical results show that the energy absorption capability of the bitubular hexagonal columns with middle to middle (MTM) ribs is the best, followed by the bitubular hexagonal columns with corner to corner (CTC) ribs and the bitubular hexagonal columns without (NOT) ribs, respectively. Then, the MTM rib was optimized by using multi-objective particle swarm optimization algorithm. Through the analysis of the Pareto front for specific energy absorption (SEA, Ase) and peak crushing force (PCF, Fpc), it is found that there is a vertex on the Pareto front. The vertex has the design parameters of t1=1.2 mm, t2=1.2 mm, Ase=11.3729 kJ/kg, Fpc=235.8491 kN. When the PCF is in a certain size, on the left of the vertex, the point with t2=1.2 mm has the biggest SEA, meanwhile on the right of the vertex, the point with t1=1.2 mm has the biggest SEA. Finally, the global sensitivity analysis was conducted to investigate the effect of two design parameters. The result is obtained that both SEA and PCF for MTM are more sensitive to t1 rather than t2 in the design domain.
Key words: bitubular hexagonal column; axial crushing; crashworthiness optimization; global sensitivity analysis
1 Introduction
Thin-walled metal columns are widely applied as energy absorber in automotive engineering, military engineering and other industries for their low cost, high specific strength and high energy absorption performance. In the crash process, they can absorb massive kinetic energy and protect the safety of occupants. Compared with slit and fracture, plastic deformation is the main way to absorb kinetic energy. At the same time, the energy stored in their longitudinal plastic deformation is much higher than that stored in the transverse. Thus, the crashworthiness research of thin- walled columns under axial crush loads attracts much attention [1].
ALEXANDER [2] firstly proposed a theoretical expression of the mean crushing force for axial crushing of a circular in 1960. WIERZBICKI et al [3] proposed a theoretical method to predict the mean crushing of a prismatic structure. GAO et al [4] studied the collision performance of square tubes with diaphragms. Besides, the crashworthiness of different structures, such as square structures [5-8], circular structures [9], spot- welded structures [10] , cellular structures [11-15] and multi-cell, multi-corner structures [16-20] , were studied by using finite element method, theoretical method and experiment.
To improve the crashworthiness of a thin-walled structure, which is influenced by a large amount of factors, such as wall thicknesses, material properties and so on, the optimization of design parameters is the main way. For instance, DJAMALUDDIN et al [21] conducted multi-objective optimization to minimize the weight and maximize the energy absorption of foam-filled double circular tubes. YANG et al [22] studied the crashworthiness of empty and foam-filled thin-walled square structures under oblique impact loading and conducted multi-objective optimization by using the Kriging metamodel and the multi-objective particle swarm optimization algorithm. EBRAHIMI et al [23] provided a crashworthiness optimization of honeycomb sandwich cylindrical columns, the objectives are maximum specific energy absorption (SEA, Ase) and minimum peak crushing force (PCF, Fpc), the design parameters are the thickness of inner, outer and core. ZHENG et al [24] used the non-dominated sorting genetric algorithm to optimize SEA and PCF for foam- filled single and bitubular polygonal thin-walled tubes.In this work, two types of bitubular hexagonal columns with ribs were proposed to improve the crashworthiness of thin-walled columns. First, three columns subjected to axial loading were simulated using nonlinear explicit finite element software LS-DYNA. Then, the response surface method models of SEA and PCF for bitubular hexagonal columns with middle to middle (MTM) ribs were established. Based on these models, the multi-objective particle swarm optimization (MOPSO) algorithm was used for maximum SEA and minimum PCF of bitubular hexagonal columns with MTM ribs. The Pareto front of SEA and PCF was obtained. Finally, in order to investigate the effect on the SEA and PCF of two design parameters, the global sensitivity analysis was conducted in design domain.
2 Crushing analysis
2.1 Configuration of bitubular hexagonal columns with ribs
Two bitubular hexagonal columns with ribs and one bitubular hexagonal column without ribs were analyzed. The cross sections of three columns are illustrated in Fig. 1. Three columns were named as bitubular hexagonal columns with corner to corner (CTC) ribs, bitubular hexagonal columns with MTM ribs, and bitubular hexagonal columns without (NOT) ribs. All columns have identical material (mild steel), length (L=400 mm), wall thickness (t=1.2 mm) and the width of the outer and inner hexagonal thin-wall tubes (d1=70 mm, d2=50 mm).

Fig. 1 Cross-section of three columns
In order to decrease the initial peak force and trigger the development of inextensional mode of the outer hexagonal tubes, three indentation triggers were introduced in odd side panels or even side panels of the outer tubes, as shown in Fig. 2(a).
The dimensions of the indentation triggers are shown in Fig. 2(b). These triggers have a depth of 0.5 mm and an angle of 120°. Their positions are 18 mm below the top end of the outer tubes. Because of the limits of the structural shapes, there are no indentation triggers on the inner tubes and ribs.
2.2 Finite element model
Finite element analysis was conducted with LS-DYNA [25]. The columns were modeled with the Belytchko-Tsay shell elements. The elements which have five integration points through the wall thickness and one integration point in the plane were adopted. During the simulation, the bottom end of the column was constrained in all degrees of freedom and the free upper end was impacted by a given rigid plate. In order to stop the columns from folding over the bottom end of the column, a rigid bottom floor is placed at the bottom end.

Fig. 2 Indentation triggers:
The rigid plate has a constant speed v=1 m/s, which is constrained in all degrees of freedom except in the direction of motion. The distance of impact compression is 300 mm. The schematic diagram of the simulation is shown in Fig. 3. In the analysis, an automatic node-to- surface contact algorithm was used for column and the given rigid plate. An automatic-single-surface contact algorithm was used to account for the self-contact between lobes. The static and dynamic friction coefficient is set as 0.15 [19].

Fig. 3 Schematic diagram of simulation
The material of the columns was mild steel, with density ρ=7800 kg/m3, elastic modulus E=210 GPa, Poisson ratio ν=0.3, yield stress σy=235 MPa and tangent modulus Et=2200 MPa. In LS-DYNA, plastic kinematic hardening material model was selected to describe the material behavior of columns [25]. The kinematic hardening parameter was taken as 0.
In order to calculate accurately and save computing time, effect of element size on the result was performed. A group of single hexagonal tubes with different element sizes was simulated. After analysis, three tubes with 1.0, 2.0 and 3.0 mm mesh respectively are chosen to testify numerical convergence and accuracy. The crushing force vs displacement curve is shown in Fig. 4. It is observed that there is a big difference between the results. Meanwhile, the results of 1.0 and 2.0 mm mesh tubes are similar and have identical trend. To save computing time, further analysis is carried out using 2 mm mesh.
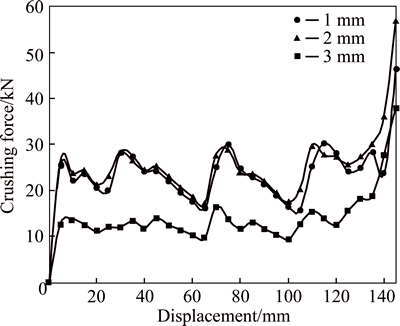
Fig. 4 Effect of element size on crushing force vs displacement curve of single hexagonal tubes
2.3 Validation of numerical model
A single hexagonal tube subjected to quasi-static axial compression was analyzed for the purpose of validating the numerical model. The properties and the sizes of the hexagonal tube are the same as those reported by ZHANG et al [26]. Figures 5(a) and (b) show the deformation modes of numerical result and experimental result of ZHANG. Figure 5(c) shows the crushing force vs displacement curve of numerical result and experimental result of ZHANG.
It is observed from Figs. 5(a) and (b) that the deformation modes of numerical and experimental results are both inextensional mode. There are four folds in both results. As shown in Fig. 5(c), the mean crushing force of the experimental results is 24.62 kN, at the same time, the mean crushing force of the numerical results is 24.03 kN. The absolute error is less than 5% [27].
By comparison of the deformation mode and the mean crushing force, the accuracy of the finite element model is verified.
2.4 Crashworthiness indicators
To evaluate the crashworthiness of the columns properly, it is important to predefine the crashworthiness indicators. In the crushing analysis of columns, four indicators are considered, including the energy absorption (EA, Ae), mean crushing force (Fm), peak crushing force (PCF, Fpc), crushing force efficiency (CFE, Ecf) and specific energy absorption (SEA, Ase) .

Fig. 5 Validation of numerical model:
EA denotes the total absorbed energy of columns during the compression. It can be expressed as
 (1)
(1)
where F(x) is the axial crushing force, d is the crushing displacement. Fm for a given crushing displacement d can be calculated as
 (2)
(2)
SEA is defined as the ratio of the energy absorption to the total mass of the columns:
 (3)
(3)
where m is the total mass of the column. It is clear that higher SEA means better capacity of energy absorption.
2.5 Simulation results
The deformation modes of three columns are shown in Table 1. It can be observed from Table 1 that all the outer tubes deform in inextensional mode. The first folds form at the free upper end and the subsequent folds fold at the upper end for the rest of the crushing process.
Table 1 Deformation modes

For CTC, there are seven outward folds of each face with indentation trigger and eight of each face without indentation trigger. For MTM, the numbers of outward folds are nine and ten respectively. Due to the effect of the rib, each fold of MTM is divided into two smaller folds, which can improve the energy absorption efficiency. The number of outward folds of each face with indentation trigger is four, at the same time, five folds are formed for each face without indentation trigger for NOT.
Figure 6 shows three inner tubes deformation processes of CTC, MTM and NOT, respectively. It is to be noted that all the inner tubes deform in mixed mode. For inner tubes of CTC and MTM, the first folds form at the upper end and the subsequent folds fold at the upper end for the rest of the crushing process. For NOT, the first fold forms at the bottom end and the subsequent folds also fold at the bottom end. Furthermore, in Fig. 6(a), it is to be noted that two extensional folds are formed first and then seven inextensional folds are developed during the compression of CTC. In Fig. 6(b), for MTM, first, six inextensional folds are formed, then, three extensional folds are developed, finally, two inextensional folds are formed. In Fig. 6(c), for NOT, the deformation mode of inner tube is more complex than CTC and MTM. First, two extensional folds are formed,then, three inextensional folds are developed, finally, it is observed that there is Euler buckling at the end of compression for NOT.

Fig. 6 Deformation processes of three inner tubes:
Compared with outer tubes, the deformation modes of inner tubes are more complex. There are two main reasons for this: the interaction effect of ribs and outer tubes, and without trigger.
Figure 7 shows the numerical results of columns. Figure 7(a) shows the curves of the crushing force vs displacement and Fig. 7(b) shows the curves of energy absorption vs displacement.

Fig. 7 Numerical results of columns:
It can be seen from Fig. 7(a) that after the PCF, the crushing forces fluctuate within a small range during the compression process. The crushing force of MTM is greater than CTC and NOT. As shown in Fig. 7(b), the energy absorption vs displacement curves are almost linear during the compression process. The energy absorption of MTM is also greater than CTC and NOT.
Table 2 shows the detailed numerical results. It is noted that the energy absorption of MTM is about 2.31 times of NOT and 1.88 times of CTC. And the SEA of MTM and CTC are increased by 104.05% and 61.20% over the NOT. At the same time, the MTM has maximum PCF and the NOT has the minimum PCF.
Table 2 Numerical results of columns

Therefore, under the axial loading the crashworthiness of bitubular hexagonal columns with ribs is better than bitubular hexagonal columns without ribs. Meanwhile, compared to CTC, the MTM has better energy absorption characteristic.
3 Multi-objective optimization design for MTM and global sensitivity analysis
3.1 Methodology
3.1.1 Response surface method (RSM)
The RSM is an effective way to construct approximate relationships between the objectives and the design variable vector, analytical formulation for which is very complex. In this approach, the RSM approximation of the response function y1(x) is assumed as the following expression:
 (4)
(4)
where n is the number of basis functions φi(x), x is the vector of the normalized design variables. In general, polynomial functions are chosen as basis functions for its simplicity.
The selection of basis functions should ensure sufficient accuracy and fast convergence [26]. In order to find which polynomial functions better, linear, quadratic and cubic polynomials are tested in this work. The unknown coefficients ai (i=1, …, n) are determined based on the m design points xi (i=1, 2, …, m, m>n) in the design domain. After obtaining the numerical results y(xi) (i=1, 2, …, m) of m design points, the method of least squares can be used to determine a by the least squares of the deviation between the numerical results and approximations. The total deviation of all design points is calculated as
 (5)
(5)
Afterwards, the coefficients ai (i=1, …, n) can be determined by  which is written as
 (6)
(6)
where B denotes the matrix consisting of basic functions evaluated at the m design sampling points, which is
 (7)
(7)
3.1.2 Error evaluation of surrogate model
To evaluate the degree of these metalmodels to the numerical results, the relative error(RE) is calculated as
 (8)
(8)
where y(x) stands for the numerical result.
In this study, square value of R, the root mean square error (RMSE, Erms) and the maximum absolute error (Emax) are also selected to evaluate the accuracies of the developed metalmodels.
 (9)
(9)
 (10)
(10)
 i=1, 2, …, m (11)
where Ess and Tss are the sum of the squared errors and the total sum of squares, respectively, and m is the number of design points.
 (12)
(12)
 (13)
(13)
where y11 is the mean value of approximations, and y01 is the mean value of numerical results.
3.1.3 Multi-objective optimization and sensitivity analysis
In order to optimize column for better crashworthiness performances under axial loading, which are minimum PCF and maximum SEA, the MOPSO algorithm is implemented to generate the Pareto front of these two conflicting objectives in this work. There are many algorithms for multi-objective optimization, such as multi-objective the simulated annealing (MOSA) algorithm, the non-dominated sorting genetic algorithm (NSGA) and MOPSO.
The MOPSO algorithm is a relatively new heuristic algorithm inspired by the choreography of a bird flock. Compared with other algorithms, the MOPSO algorithm needs relatively low computational cost. At the same time, it also has the ability to generate the best set of Pareto solutions close to the true Pareto front [22].
Sensitivity analysis studies the effect on outputs of the change of the inputs, which includes local sensitivity analysis and global sensitivity analysis. The local sensitivity analysis has the advantage of maneuverability, however, it just considers the change of one input at a time and cannot consider the effect of the interaction of inputs on outputs. So, the global sensitivity analysis is utilized in this work.
There are many methods of global sensitivity analysis, such as screening design, correlation and partial correlation coefficients, Monte Carlo method and variance-based method. The method used in this work is Sobol’s method, which is a variance-based method. This method is one of the most established and widely used methods for global sensitivity analysis.
It is possible to obtain the main effects of an input and all of the interactions involving this input. Two input parameters t1 and t2 are studied and the total effects on output of t1 and t2 are calculated as
 (14)
(14)
 (15)
(15)
where ST(t1) and ST(t2) are the total effects, S(t1) and S(t2) are the first order effects, and S(t1t2) is the second order effect.
3.2 Multi-objective optimization of MTM
According to the numerical results of three columns, MTM has excellent energy absorption characteristics. Thus, MTM is selected for optimization.
Among many crashworthiness indicators, SEA is an important indicator. The larger the SEA, the more impact energy is absorbed with the same weight. So the SEA should be selected as an objective function. At the same time, the PCF should be limited to a certain level for the purpose of protecting the occupants from high acceleration. Thus, the PCF is chosen as an objective function and its minimum value is calculated in the crashworthiness optimization. In order to simultaneously consider the SEA and PCF, the multi-objective optimization problem is written as
 (16)
(16)
where t1 and t2 are the thicknesses of hexagonal tubes and ribs, respectively.
The design of experiment (DOE) method in this work is full factorial design, which has the advantage of uniformity. Every input parameter has four levels. Thus, there are 16 evenly distributed design points within the design domain of t1 and t2. These design points are listed in Table 3.
The numerical results are shown in Figs. 8 and 9. Figure 8 shows the deformation modes of MTM with t1=1.2 mm, t2=1.2 mm and t1=2.1 mm, t2=0.3 mm. It is shown that the outer and inner tubes of these two columns deform in inextensional mode. In Fig. 9, it is noted that when the values of t1 and t2 increase, the energy absorption increases too.
The detailed numerical results of SEA and PCF for sixteen MTM are listed in Table 3. The response functions of SEA and PCF are calculated from these data. In order to get more accurate results, linear, quadratic and cubic three different polynomial functions based on
the RSM are constructed. The accuracy of these polynomial functions is evaluated by substituting the approximation and the numerical responses of SEA and PCF into Eqs. (6)-(11) and summarized in Table 4.
Table 3 Design matrix of MTM for crashworthiness


Fig. 8 Deformation modes of MTM:
From the data shown in Table 4, it is found that the cubic polynomial functions are the best metamodels in SEA and PCF, compared to linear and quadratic polynomial functions. Because the cubic polynomial functions are high-accuracy, higher order polynomial functions are not constructed. Therefore, the RSM model utilized in the following analysis is cubic polynomial. For SEA and PCF, the RSM models are written as


 (17)
(17)


 (18)
(18)
The SEA and PCF are conflicting objectives. In order to obtain the Pareto front of SEA and PCF, the MOPSO algorithm is used. The detailed results are listed in Table 5 and Fig. 10.
Figure 10 represents the Pareto front of MTM. In order to verify the accuracy of the Pareto front, one way is by constraining the PCF under a certain lever, then, optimizing the SEA, obtaining the detailed design parameters, using the LS-DYNA to calculate the SEA with the same design parameters, finally comparing two SEAs. The constraint of the PCF is 300 kN and both of the SEA are shown in Fig. 10. In Table 5, it can be observed that the errors of SEA and PCF are -1.59% and -0.37%, respectively. This indicates that the Pareto front
of MTM is accurate enough.

Fig. 9 Energy absorption vs displacement curves with different t1 and t2 values:
Table 4 Accuracy of different polynomials for MTM

Table 5 Optimization results

In Fig. 10, the vertex denoted by a dash-line circle has the parameters of t1=1.2 mm, t2=1.2 mm, Ase=11.37 kJ/kg, and Fpc=235.85 kN. The vertical line through this vertex is a dividing line. On the left of this line, the points of the Pareto front have the same design parameter t2=1.2 mm. On the right of this line, the points of the Pareto front has the same design parameter t1= 1.2 mm. It means that on the left of the vertical line, the point with t2=1.2 mm has the biggest SEA when the PCF is a certain size. And on the right of the vertical line, the point with t1=1.2 mm has the biggest SEA when the PCF is a certain size.
3.3 Global sensitivity analysis
Figure 11 shows the global sensitivity analysis results of SEA and PCF functions for MTM. In Fig. 10(a), it can be observed that the first order effects of t1 and t2 on the sensitivity of SEA function are 0.6630 and 0.3355, respectively. Meanwhile, the total effects are 0.6703 and 0.3370. In Fig. 11(b), it is noted that with respect to t1, first order and total effect on PCF function are 0.6592 and 0.6645. With respect to t2, the first order and total effect on PCF function are 0.3355 and 0.3408, respectively. Through the above global sensitivity analysis, a conclusion can be made, which is that both SEA and PCF for MTM are more sensitive to the design variable t1 rather than t2 in the design domain.

Fig. 10 Pareto front of SEA and PCF for MTM
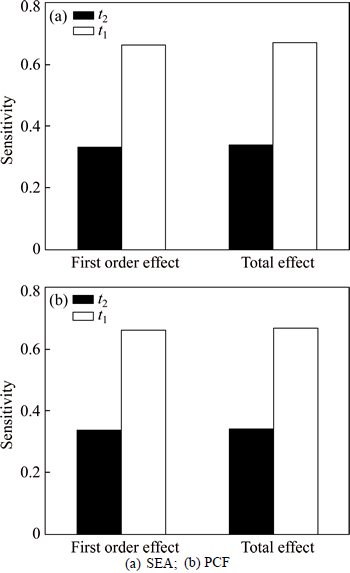
Fig. 11 Global sensitivity analysis results for MTM:
4 Conclusions
1) The energy absorption of MTM is about 2.31 times of NOT and 1.88 times of CTC. And the SEA of MTM and CTC are increased by 104.0469% and 61.2028% over the NOT. At the same time, the MTM has maximum PCF and the NOT has the minimum PCF.
2) About the RSM models, comparing linear and quadratic polynomial functions, the cubic polynomial functions are the best metamodels in SEA and PCF.
3) The multi-objective particle swarm optimization algorithm is used to achieve maximum SEA and minimum PCF, and the Pareto front of SEA and PCF is obtained.
4) In the design domain, there is a dividing line through the vertex which has the design parameters of t1=1.2 mm, t2=1.2 mm, SEA of 11.37 kJ/kg, PCF of 235.85 kN. On the left of the vertex, the point with t2= 1.2 mm has the biggest SEA when the PCF is a certain size. Meanwhile, on the right of the vertex, the point with t1=1.2 mm has the biggest SEA when the PCF is a certain size.
5) In order to measure the effect on the SEA and PCF of two design parameters, the global sensitivity analysis is conducted, it is known that both SEA and PCF for MTM are more sensitive to the design variable t1 rather than t2 in the design domain.
References
[1] LU Guo-xing, YU Tong-xi. Energy absorption of structures and materials [M]. Cambridge, UK: Woodhead Publishing Limited, 2003.
[2] ALEXANDER J M. An approximate analysis of the collapse of thin cylindrical shells under axial loading [J]. Quarterly Journal of Mechanics and Applied Mathematics, 1960, 13(1): 10-15.
[3] WIERZBICHI T, ABRAMOWICZ W. On the crushing mechanics of thin-walled structures [J]. Journal of Applied Mechanics, 1983, 50: 727-734.
[4] GAO Guang-jun, DONG Hai-peng, TIAN Hong-qi. Collision performance of square tubes with diaphragms [J]. Thin-Walled Structures, 2014, 80(1): 167-177.
[5] ALLAHBAKHSH H R, SHARIATI M, SEDIGHI M. Effect of stiffeners on crashworthiness of square aluminium columns considering damage evolution [J]. Journal of Central South University, 2013, 20(3): 599-607.
[6] ZHANG Xiong, CHENG Geng-dong, YOU Zhong, ZHANG Hui. Energy absorption of axially compressed thin-walled square tubes with patterns [J]. Thin-Walled Structures, 2007, 45(9): 737-746.
[7] KASHANI M H, ALAVIJEH H S, AKBARSHAHI H, SHAKERI M. Bitubular square tubes with different arrangements under quasi-static axial compression loading [J]. Materials and Design, 2013, 51: 1095-1103.
[8] DONG Hai-peng, Gao Guang-jun, XIE Su-chao, Li Jian. Collision performance of bitubular tubes with diaphragms [J]. Journal of Central South University, 2015, 22(9): 3657-3665.
[9] CHEN D H, OZAKI S. Circumferential strain concentration in axial crushing of cylindrical and square tubes with corrugated surfaces [J]. Thin-Walled Structures, 2009, 47(5): 547-554.
[10] WANG Feng, MO Yi-min, LV Jun-cheng, HUANG Feng, HE Qing. Numerical studies on STFD-HAT sections under axial dynamic impact [J]. Thin-Walled Structures, 2014, 82: 105-114.
[11] HOU Shu-juan, LI Qing, LONG Shu-yao, YANG Xu-jing, LI Wei. Multiobjective optimization of multi-cell sections for crashworthiness design [J]. International Journal of Impact Engineering, 2008, 35(11): 1355-1367.
[12] HOU Shu-juan, LI Qing, LONG Shu-yao, YANG Xu-jing, LI Wei. Design optimization of regular hexagonal thin-walled columns with crashworthiness criteria [J]. Finite Elements in Analysis and Design, 2007, 43(6, 7): 555-565.
[13] XIE Su-chao, ZHOU Hui, LIANG Xi-feng, REN Xing. Contrastive analysis and crashworthiness optimization of two composite thin-walled structures [J]. Journal of Central South University, 2014, 21(11): 4386-4394.
[14] ZHANG Zong-hua, LIU Shu-tian, TANG Zhi-liang. Crashworthiness investigation of kagome honeycomb sandwich cylindrical column under axial crushing loads [J]. Thin-Walled Structures, 2010, 48(1): 9-18.
[15] ZHANG Zong-hua, LIU Shu-tian, TANG Zhi-liang. Comparisons of honeycomb sandwich and foam-filled cylindrical columns under axial crushing loads [J]. Thin-Walled Structures, 2011, 49(9): 9-18.
[16] LIU Yu-cheng. Crashworthiness design of multi-corner thin-walled columns [J]. Thin-Walled Structures, 2008, 46(12): 1329-1337.
[17] NAJAFI A, RAIS-ROHANI M. Mechanics of axial plastic collapse in multi-cell, multi-corner crush tubes [J]. Thin-Walled Structures, 2011, 49(1): 1-12.
[18] TANG Zhi-liang, LIU Shu-tian, ZHANG Zong-hua. Energy absorption properties of non-convex multi-corner thin-walled columns [J]. Thin-Walled Structures, 2012, 51(2): 112-120.
[19] ZHANG Xiong, HUH H. Crushing analysis of polygonal columns and angle element [J]. Thin-Walled Structures, 2014, 37(4): 441-451.
[20] LIU Shu-tian, TONG Ze-qi, TANG Zhi-liang, LIU Yang, ZHANG Zong-hua. Bionic design modification of non-convex multi-corner thin-walled columns for improving energy absorption through adding bulkheads [J]. Thin-Walled Structures, 2015, 88: 70-81.
[21] DJAMALUDDIN F, ABDULLAH S, ARIFFIN A K, NOPIAH Z M. Optimization of foam-filled double circular tubes under axial and oblique impact loading conditions [J]. Thin-Walled Structures, 2015, 87: 1-11.
[22] YANG Shu, QI Chang. Multiobjective optimization for empty and foam-filled square columns under oblique impact loading [J]. International Journal of Impact Engineering, 2013, 54: 177-191.
[23] EBRAHIMI S, VAHDATAZAD N. Multiobjective optimization and sensitivity analysis of honeycomb sandwich cylindrical columns under axial crushing loads [J]. Thin-Walled Structures, 2015, 88: 90-104.
[24] ZHENG Gang, WU Su-zhen, SUN Guang-yong, LI Guang-yao, LI Qing. Crushing analysis of foam-filled single and bitubal polygonal thin-walled tubes [J]. International Journal of Mechanical Sciences, 2014, 87: 226-240.
[25] LS-DYNA Keyword User’s Manual, Version 960 [M]. California: Livermore Software Technology Corporation, 2001: 563-612.
[26] ZHANG Xiong, ZHANG Hui. Experimental and numerical investigation on crush resistance of polygonal columns and angle elements [J]. Thin-Walled Structures, 2012, 57(6): 25-36.
[27] XU Feng-xiang. Enhancing material efficiency of energy absorbers through graded thickness structures [J]. Thin-Walled Structures, 2015, 97: 250-265.
(Edited by FANG Jing-hua)
Cite this article as: ZOU Xiang, GAO Guang-jun, DONG Hai-peng, LI Jian, ZHOU Xi-sai, CHEN Wei, GUAN Wei-yuan. Crushing analysis and multi-objective optimization of bitubular hexagonal columns with ribs [J]. Journal of Central South University, 2017, 24(5): 1164-1173. DOI: 10.1007/s11771-017-3519-4.
Foundation item: Projects(U1334208, 51405516, 51275532) supported by the National Natural Science Foundation of China; Projects(2015ZZTS210, 2015ZZTS045) supported by the Fundamental Research Funds for the Central Universities, China
Received date: 2015-10-11; Accepted date: 2016-04-05
Corresponding author: GAO Guang-jun, Professor, PhD;Tel: +86-731-82655294;E mail: gjgao@csu.edu.cn

