改进的Malkmus带模式晴空大气透射率计算方法
来源期刊:中国有色金属学报(英文版)2014年第8期
论文作者:王琪洁 张 勇 刘小力
文章页码:2618 - 2626
关键词:Malkmus带模式;MODTRAN;透射率;大气吸收
Key words:Malkmus band model; MODTRAN; transmittance; atmospheric absorption
摘 要:Malkmus带模式在气候研究以及遥感应用中具有较高的应用价值,然而其计算精度不高。针对该问题,引入修正量对Malkmus模型进行改进。实验采用HITRAN2008谱线数据和美国空军地球物理实验室(AFGL)提供的6种大气模式计算垂直路径大气分子的透射率数据。在不同的大气模式下,以MODTRAN计算结果为参考标准,利用最小二乘拟合得到修正量并将其用于大气透射率补偿。相对于传统Malkmus模型,改进模型的透射率精度提高了1~2个数量级。结果表明,本方法不仅能有效地提高模型计算精度,而且适用于不同的大气模式和大气分子。
Abstract: The Malkmus band model has been widely used in remote sensing and climate studies. However, its accuracy is not high. To solve this problem, a modified Malkmus band model was proposed by introducing a correction item. The HITRAN (High-resolution TRANsmission) 2008 database and the atmospheric models provided by the Air Force Geophysics Laboratory (AFGL) were used to calculate the molecular transmittances. By fitting the calculated transmittances to those by MODTRAN (MODerate resolution atmospheric TRANsmission) package with the least-squares method, the fitting coefficients of the correction item were obtained under different atmosphere models. The experimental results show that the root mean square errors (RMSE) of the modified model are significantly less than that of the traditional Malkmus band model by 1-2 orders of magnitude. In addition, the modified method is suitable for different atmospheric models and molecules.
Trans. Nonferrous Met. Soc. China 24(2014) 2618-2626
Qi-jie WANG, Yong ZHANG, Xiao-li LIU
School of Geosciences and Info-Physics, Central South University, Changsha 410083, China
Received 3 January 2014; accepted 10 April 2014
Abstract: The Malkmus band model has been widely used in remote sensing and climate studies. However, its accuracy is not high. To solve this problem, a modified Malkmus band model was proposed by introducing a correction item. The HITRAN (High-resolution TRANsmission) 2008 database and the atmospheric models provided by the Air Force Geophysics Laboratory (AFGL) were used to calculate the molecular transmittances. By fitting the calculated transmittances to those by MODTRAN (MODerate resolution atmospheric TRANsmission) package with the least-squares method, the fitting coefficients of the correction item were obtained under different atmosphere models. The experimental results show that the root mean square errors (RMSE) of the modified model are significantly less than that of the traditional Malkmus band model by 1-2 orders of magnitude. In addition, the modified method is suitable for different atmospheric models and molecules.
Key words: Malkmus band model; MODTRAN; transmittance; atmospheric absorption
1 Introduction
The calculation of atmospheric molecular transmittance is essential to atmospheric radiation and remote sensing related research. Currently, the line-by- line (LBL) model is the most accurate algorithm for calculating atmospheric transmittance [1-4]. However, its efficiency is too low to satisfy practical applications. On the contrary, the statistical band model is a simplified method with very high computational efficiency and has been widely used in radiation calculation.
The statistical band model assumes that the spectral line positions are randomly distributed and the line intensities can be described by a probability distribution function (e.g., the exponential function, the Malkmus function) in a given frequency interval [5,6]. As the Malkmus distribution function can better describe the spectral line intensities, LIOU [7] used the Malkmus band model to calculate transmittance hereinafter. However, the difference between the assumption of Malkmus model and the actual distribution of spectral lines can lead to significant errors when calculating transmittance in some absorption bands. To solve this problem, many related studies have been carried out. For example, the band parameters of the Malkmus model were estimated by fitting to line-by-line radiative transfer model (LBLRTM). When the temperature and pressure dependencies of the band parameters were calculated, the band parameters of the model can be adjusted to the actual temperature and pressure in the atmosphere [8,9]. HIRONO et al [10] proposed a method to deal with the line-mixing problem. To estimate the contribution of Doppler broadening, a generalized Malkmus line intensity distribution function was raised by  and SOUFIANI [11], aiming at improving the equivalent width calculation accuracy in Doppler broadening regime. On the other hand, GELEYN et al [12] evaluated this term by introducing Doppler correction. For the methods mentioned above, the one proposed by WARNER et al can effectively estimate the band parameters, but it fails in the low pressure condition [13]. The other methods improve the Malkmus band model from different aspects, but the accuracy of band parameters has not been raised, which makes the improvements very limited.
In view of the shortcomings of existing methods, a modified Malkmus band model was proposed through introducing a correction item in this work. By fitting the Malkmus band model under different atmospheric models to MODTRAN [14] with the least-squares method, the fitting parameters of the correction item for molecular transmittance calculation were obtained. Then, the modified model under the actual atmospheric models provided by AFGL was tested.
2 Methodology
2.1 Malkmus band model
The Malkmus band model is derived under the assumption that the absorption lines distribute randomly and the line intensity distribution follows [6]
 (1)
(1)
where S is the strength of spectral line, and  is the average line intensity within a given spectral interval.
Under the above assumption, the average transmittance with n lines in the interval Δv can be expressed as
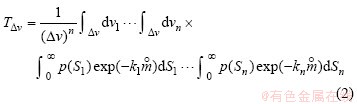
where kn denotes the absorption coefficient and p(Sn) is the probability of the nth line;  is the absorber amount. After integrating over the range of intensity and frequency, the Malkmus band model with Lorentz line shape can be expressed as
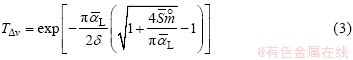
where  and δ are the average Lorentz half-width and line spacing, respectively. Generally,
  and are determined with the spectral line data under the limits of weak-line and strong-line approximations.
2.2 Inhomogeneous atmospheric scaling of Malkmus band model
The effects of inhomogeneous atmospheric mass, temperature, and pressure along absorber paths on transmission must be taken into account when calculating the molecular transmittance over the whole atmosphere. In practical application, the scaled absorber amount , scaled temperature Te, and scaled pressure Pe under the Curtis-Godson approximation are adopted. In the atmosphere, the temperature generally varies within 30% while the change in pressure can be up to several orders of magnitude. Therefore, the average temperature  =250 K is usually taken as the scaled temperature Te, while the scaled pressure Pe and mass are calculated as follows [15,16]:
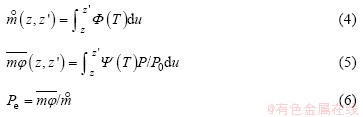
where z is the height; T and P are the temperature and pressure at the absorber path, respectively; P0=1.013×10⁵ Pa is the reference pressure; du=ρdz/cosθ, in which ρ is the gaseous density and θ is the zenith of the path. The scaling functions Φ(T) and Ψ(T) are determined by
 (7)
(7)
 (8)
(8)
The HITRAN (High-resolution TRANsmission) spectral line data were measured at reference pressure Pr=1.013×10⁵ Pa and reference temperature Tr=296 K. So, when we use Eqs. (7) and (8) to estimate the scaling functions, the line positions, intensities and half widths are needed to correct by [17]
 (9)
(9)
 (10)
(10)

 (11)
(11)
where v is the line position, δ is the air-broadened pressure shift of line transition, c2 is the second radiation constant, E is the lower state energy, nair is the coefficient of temperature dependence of air-broadened half width, αair is the air-broadened half width, αself is the self-broadened half width, Pself is the partial pressure of the gas, Q is the total internal partition sums and the term Q(Tr)/Q(T) can be calculated through polynomial fitting [18,19], which simplify the calculation of the total internal partition sums greatly.
The scaling functions Φ(T) and Ψ(T) can be further fitted by the formulas:
 (12)
(12)
 (13)
(13)
where the fitting coefficients a, b, a′, and b′ are determined with least-squares method. In the fitting, the selection of samples T should cover the atmospheric temperature range. In this work, seven reference temperatures, i.e., 175, 200, 225, 250, 275, 300, and 325 K, respectively, are used.
After the above scaling, the spectral transmittance by Malkmus band model can be given by
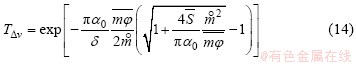
The band parameters are essential to spectral transmittance estimation. Under the limits of weak-line approximations, we have
 (15)
(15)
Besides, under the limits of strong-line approximations, we have
 (16)
(16)
3 Modified Malkmus band model
The estimation accuracy of transmittance based on the Malkmus band model depends on the accuracy of the band parameters and the line shape used in the model. The band parameters calculated under the approximation of weak-line and strong-line limits are inaccurate, which lead to significant errors in some absorption bands. Meanwhile, the Lorentz line shape used in the Malkmus band model over the whole atmosphere will bring errors too. Collision broadening dominates in the lower atmosphere and Doppler broadening plays a major role in the upper atmosphere. In the middle stratosphere, effective line shapes are determined by both collision and Doppler broadening processes. In this case, the Voigt (combined Lorentz with Doppler) line shape is preferable. Since the analytical solution of transmission function with Doppler or Voigt line profile is not available, a modified Malkmus band model is proposed to make full advantage of the simple expression of the transmission function with Lorentz line shape. In the model, a correction item is introduced, which can compensate for the deviations caused by the errors of the band parameters and line shape.
Assuming that TΔv is the genuine transmittance, TM is the calculated transmittance by traditional Malkmus band model within spectral interval Δv, and TR corresponds to the compensation term, the modified model can then be written as
TΔv=TM・TR (17)
As the genuine transmittances TΔv are not known, the most accurate transmittances, as calculated by the very complicated MODTRAN package, are used to approximate them in this work. TR can be determined by
 (18)
(18)
where  is the average equivalent absorber amount, Ci is the polynomial coefficient determined by the method of least-squares, M is the order of polynomial determined by try-and-error tests. For the gas whose content varies with altitude greatly, an appropriate large M shows more improvement to the model. But too large value of M will lead to the inversion of the normal equation unstable. Empirically, in the earth’s atmosphere, for the gases vary greatly with altitude such as water vapor, M=6; while for the gases distribute uniformly such as carbon dioxide and methane, M=4.
Combing Eqs. (15), (17) and (18), we get
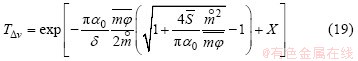
where the correction term X can be expressed as
 (20)
(20)
With Eq. (19), the traditional Malkmus band model can be corrected if only a set of fitting coefficients Ci are obtained in advance.
4 Experimental results and analysis
The HITRAN2008 database [20] was used to calculate the molecule transmittances of six actual atmospheric models within 0.4-4 μm with a resolution of 10 cm-1. The six atmospheric models were provided by the Air Force Geophysics Laboratory (AFGL), which are Tropical, Mid-Latitude Summer (MidSum), Mid- Latitude Winter (MidWin), Sub-Arctic Summer (SubSum), Sub-Arctic Winter (SubWin) and U.S. Standard (USSTD).
The software pcMODTRAN4.0 is a commercial Windows version of MODTRAN package developed by AFGL, which is recognized as the most accurate package for transmittances estimation and has been widely used in atmospheric transmission at medium resolution (1 cm-1). It is very complicated, time-consuming, and not appropriate for practical application, but suitable for laboratory investigation and model validation. Thus, the results by pcMODTRAN4.0 were used as reference transmittances in this work. Considering the consistence of resolution, the transmittances calculated by pcMODTRAN4.0 were smoothed to 10 cm-1.
Since water vapor plays the most important role on absorption in the atmosphere, the proposed model was applied to calculating the transmittance of water vapor and assessing its accuracy. And then the total transmittances of the other main absorbing gases were calculated and evaluated. Besides, a database of fitting coefficients for the correction item of Malkmus band model was obtained under different atmospheric models and molecules.
4.1 Water vapor transmittance experiment and analysis
4.1.1 Accuracy assessment
Firstly, the modified model was validated with six actual atmospheric models. The correction item was calculated with fitting coefficients obtained under each atmospheric model. Figure 1 shows the transmittance of water vapor calculated under the U.S. Standard atmospheric model with vertical path 0-100 km. The calculated transmittance by MODTRAN, Malkmus band model and the modified model is shown in Fig. 1(a), and the errors of the Malkmus band model and the modified model referenced to the MODTRAN are depicted in Fig. 1(b). As shown in Fig. 1(b), the Malkmus band model misestimates the transmittances in most of the spectral region, while the transmittances estimated by the modified model are approximately the same as those by the MODTRAN. This implies that the correction to the model plays an effective role. For the Malkmus band model, when the line distributions differ from the actual lines, the model will couple with significant deviations. It should be noted that the deviation is highly correlated with the atmospheric absorber amount. When the absorber amount is stable, the deviation of the model is steady. As long as the relationship between them was found out the Malkmus band model can be corrected successfully. From the results, it is known that the relationship between absorber amount and the correction term can be described with polynomials.
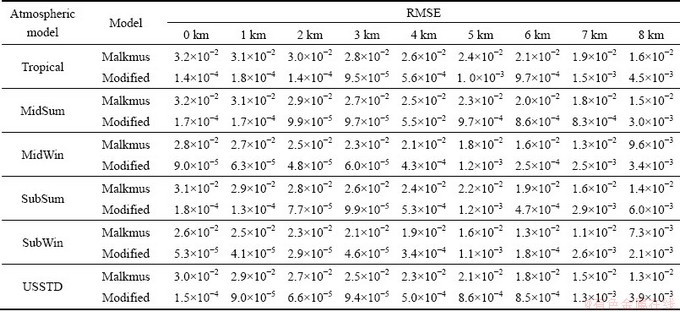
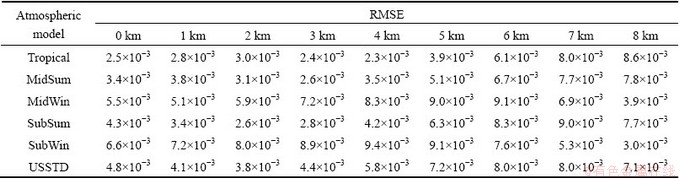
To quantitatively illustrate the accuracy of the improved algorithm, the root mean square errors (RMSEs) of the transmittances calculated by the Malkmus band model and the modified model under six atmospheric models provided by AFGL with absorber path from different altitudes to the top of atmosphere are given in Table 1. Since the water vapor mostly concentrates in the troposphere, the maximum elevation is set to 8 km in this work. Table 1 shows that the accuracy of the modified algorithm is significantly better than that of the Malkmus band model. With the increase of elevation, the calculation accuracy decreases slightly. The reason is that the content of water vapor decreases rapidly when the elevation increases, and the fitting accuracy decreases slightly, too.
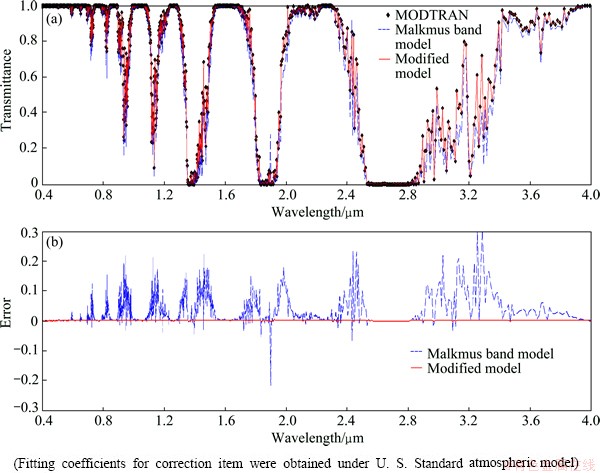
Fig. 1 Calculated transmittances by MODTRAN, Malkmus model and modified model (a) and errors of Malkmus band model and modified model (referenced to MODTRAN) (b)
Table 1 Comparisons of RMSEs of water vapor transmittances calculated by Malkmus band and modified model
4.1.2 Model adaptability analysis under different atmospheric models
Having assessed the accuracy of the modified model, its adaptability was tested by applying a set of fitting parameters to different atmospheric models. Equation (14) exhibits that the absorber path is scaled to a homogeneous path. And the impacts of the atmospheric temperature and pressure are reflected by the scaled absorber amount. Theoretically, if the range of the scaled absorber amount for least squares fitting spans large enough, the fitting coefficients for the correction item should have a good adaptability. In this work, the fitting coefficients were calculated under Tropical model because of its high water vapor content. The discrete values of mean scaled absorber amount used for fitting are given as: 1.43×101, 1.14×101, 8.88×100, 6.83×100, 5.02×100, 3.65×100, 2.63×100, 1.94×100, 1.45×100, 1.11×100, 8.19×10⁻¹, 6.00×10⁻¹, 4.28×10⁻¹, 3.07×10⁻¹, 2.14×10⁻¹, 1.49×10⁻¹, 9.90×10⁻², 6.54×10⁻², 4.09×10⁻², 2.58×10⁻², 1.55×10⁻², 5.61×10⁻³, 2.38×10⁻³, 1.29×10⁻³, 9.28×10⁻⁴, 6.04×10⁻⁴, 3.22×10⁻⁴, 1.17×10⁻⁴, 6.52×10⁻⁵, 1.01×10⁻⁵ g・cm-2. The range spans from 10-5 to 14 g/cm2 and covers most of the cases of atmosphere. For the method used in this work, enough values and range will make a good fitting to MODTRAN.
Figure 2 shows the results calculated under the U.S. standard atmospheric model with this set of fitting coefficients. As shown in Fig. 2(b), the accuracy of the proposed algorithm is superior to that of the Malkmus band model, but drops slightly compared with that in Fig. 1(b). The reason is that the fitting coefficients were calculated under Tropical atmospheric model. Since the temperature, pressure and the water vapor profiles of the Tropical and the U.S. standard atmospheric model are different, the estimation values of spectral line intensity, half-width and absorber amount are deviated. Even if one scaled the inhomogeneous atmospheric path, the differences between the atmospheric models would still lead to errors when calculating transmittance over the whole atmosphere. Then, the RMSEs of the transmittances calculated under different atmospheric models by using the modified model along with the fitting coefficients are listed in Table 2, while the corresponding results by the Malkmus band model are given in Table 1. Comparing Table 1 and Table 2, we can draw a conclusion that the modified model is obviously superior to the Malkmus band model and suitable for different atmospheric models.
4.2 Total transmittance experiment and analysis
To evaluate the performance of the proposed model for total transmittance, the main absorbing gases in the atmosphere were taken into account, including water vapor, ozone, carbon dioxide, nitrous oxide, methane and oxygen. The total transmittances were calculated simply by multiplying the transmittances of each molecule, where the continuum absorption was neglected. The calculated total transmittances are shown in Figs. 3 and 4, which were obtained under the U.S. Standard atmospheric model. In Fig. 3, the fitting coefficients for the correction item of each molecule were obtained under U.S. Standard atmospheric model, while the corresponding fitting coefficients in Fig. 4 were under Tropical model with zenith angle of 60°.
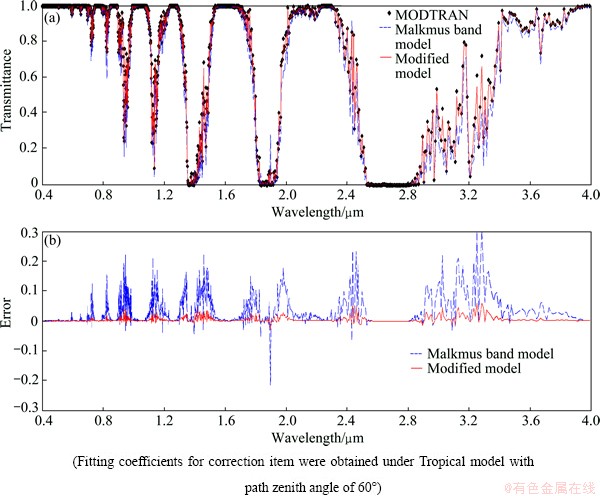
Fig. 2 Calculated transmittances by MODTRAN, Malkmus model and modified model (a) and errors of Malkmus band model and modified model (referenced to MODTRAN) (b)
Table 2 RMSEs of water vapor transmittance calculated by modified model along with a set of fitting coefficients obtained under Tropical model with path zenith angle 60°
The main absorption bands of each molecule have been marked in Figs. 3(a) and 4(a), indicating that most of the absorption bands are determined by water vapor molecule over the spectral range, while the other molecules absorb solar flux in specific frequency or regions. For example, the carbon dioxide exhibits the main absorption region: 1.4, 1.6, 2.0 μm and the strong absorption bands: 2.7 μm.
Figure 3(a) shows that the total transmittances calculated by the modified model for each molecule are almost consistent with those by the MODTRAN, which demonstrate that the modified model for the existing atmospheric model is accurate. By comparing Figs. 2(b) with 4(b), it can be seen that the accuracy is generally high when the fitting coefficients of the correction item obtained under Tropical model were applied to U.S. Standard atmospheric model. But the correction for different molecules works slightly differently, for example, the 0.76 μm band of oxygen, the 2.0 μm band of carbon dioxide and the 3.31 μm band of methane, as shown in the figures. In general, the accuracy of the modified model is apparently higher than that of the Malkmus band model, and similar conclusions can be drawn under other atmospheric models. This indicates that the modified model can be applied to several main atmospheric molecules and has a good adaptability to different atmospheric models.
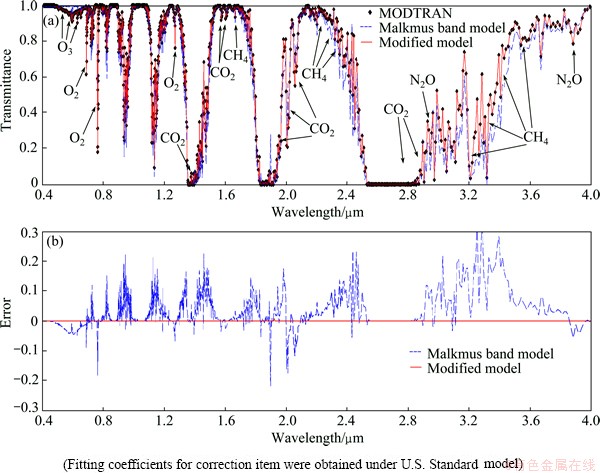
Fig. 3 Calculated total transmittance by MODTRAN, Malkmus band model and modified model (a) and errors of Malkmus band model and modified model referenced to MODTRAN (b)
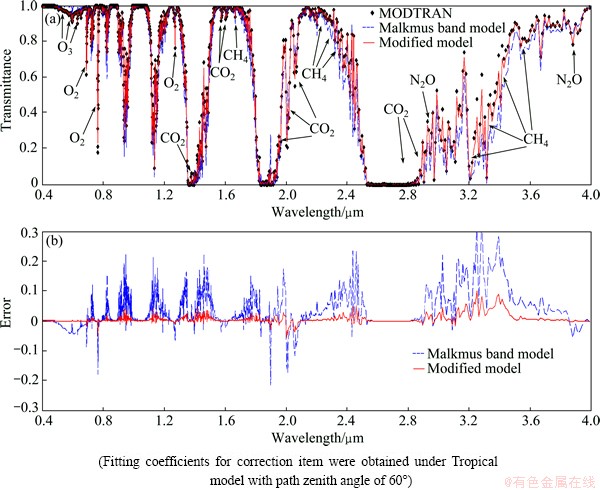
Fig. 4 Calculated total transmittance by MODTRAN, Malkmus band model and modified model (a) and errors of Malkmus band model and modified model referenced to MODTRAN (b)
5 Conclusions
1) The modified model is suitable for main absorbing gases in the Earth’s atmosphere. Besides, the fitting coefficients database can be reused once it has been established.
2) The proposed algorithm can apparently improve the accuracy of the Malkmus band model. The RMSEs of the modified model are significantly less than that of the traditional Malkmus band model by 1-2 orders of magnitude.
3) The method has a good adaptability, as long as the range of absorber amount for fitting coefficients is large enough and selected appropriately, the modified model for different atmospheric models is accurate.
4) The method has a high application potential in practice. But it is necessary to point out that the method is proposed for certain atmospheric models and might fail in arbitrary atmospheric temperature, pressure and absorber amount. Our future study will focus on this problem.
Acknowledgments
The authors acknowledge Air Force Geophysics Laboratory (AFGL) for providing the atmosphere models and Harvard University for providing HITRAN2008 data base.
References
[1] CLOUGH S A, IACONO M J, MONCET J L. Line-by-line calculations of atmospheric fluxes and cooling rates: Application to water vapor [J]. Journal of Geophysical Research, 1992, 97(D14): 15761-15785.
[2] CLOUGH S A, IACONO M J. Line-by-line calculation of atmospheric fluxes and cooling rates 2. Application to carbon dioxide, ozone, methane, nitrous oxide and the halocarbons [J]. Journal of Geophysical Research, 1995, 100(D8): 16519-16535.
[3] ZHANG Hua, SHI Guang-yu. A fast and efficient line-by-line calculation method for atmospheric absorption [J]. Chinese Journal of Atmospheric Sciences, 2000, 24(1): 111-121. (in Chinese)
[4] WANG Qi-jie, LI Zhi-wei, DU Ya-nan. Generalized functional model of the maximum and minimum detectable deformation gradient for PALSAR interferometry [J]. Transactions of Nonferrous Metals Society of China, 2014, 24(3): 824-832.
[5] GOODY R M. A statistical model for water-vapour absorption [J]. Quarterly Journal of the Royal Meteorological Society, 1952, 78(336): 165-169.
[6] MALKMUS W. Random lorentz band model with exponential-tailed S-1 line-intensity distribution function [J]. JOSA, 1967, 57(3): 323-329.
[7] LIOU K N. An introduction to atmospheric radiation [M]. 2nd Ed. Academic Press, 2002.
[8] AER’s radiative transfer working group. AER’s public release radiative transfer models and datebases [EB/OL]. [2013-8-20]. http://www.rtweb.aer.com.
[9] WARNER J X, ELLINGSON R G. A new narrowband radiation model for water vapor absorption [J]. Journal of the Atmospheric Sciences, 2000, 57(10): 1481-1496.
[10] HIRONO M, TANEMURA A, HONDA Y. Band model for modified lorentz lines [J]. Optical Review, 2007, 14(6): 368-372.
[11] P, SOUFIANI A. Generalized Malkmus line intensity distribution for CO2 infrared radiation in Doppler broadening regime [J]. Journal of Quantitative Spectroscopy and Radiative Transfer, 2011, 112(3): 475-485.
[12] GELEYN J F,  P, FOURNIER R. A general-purpose extension of the Malkmus band-model average equivalent width to the case of the Voigt line profile [J]. Quarterly Journal of the Royal Meteorological Society, 2005, 131(611): 2757-2768.
[13] WEI He-li, CHEN Xiu-hong, RAO Rui-zhong,WNAG Ying-jian. A moderate-spectral-resolution transmittance model based on fitting the line-by-line calculation [J]. Optics Express, 2007, 15(13): 8360-8370.
[14] KNEIZYS F X, ABREU L W, ANDERSON G P, CHETWYND J H, SHETTLE E P, BERK A, BERNSTEIN L S, ROBERTSON D C, ACHARYA P, ROTHMAN L S, SELBY J E A, GALLERY W O, CLOUGH S A. The MODTRAN 2/3 report and LOWTRAN 7 model [R]. Phillips Laboratory, Hanscom AFB, MA, 1996: 1731.
[15] VERMOTE E,  J L, HERMAN M, MORCRETTE J J, KOTCHENOVA S Y. Second simulation of a satellite signal in the solar spectrum-vector (6SV) [R]. 6S User Guide Version, 2006, 3.
[16] ZENDER C. Radiative transfer in the earth system [EB/OL]. [2013-8-20]. http://dust.ess.uci.edu/facts/rt/rt.html.
[17] SHI Guang-yu. Atmospheric radiation [M]. Beijing: Science Press, 2007. (in Chinese)
[18] GAMACHE R R, KENNEDY S, HAWKINS R, ROTHMAN L S. Total internal partition sums for molecules in the terrestrial atmosphere [J]. Journal of Molecular Structure, 2000, 517: 407-425.
[19] FISCHER J, GAMACHE R R, GOLDMAN A, ROTHMAN L S, PERRIN A. Total internal partition sums for molecular species in the 2000 edition of the HITRAN database [J]. Journal of Quantitative Spectroscopy and Radiative Transfer, 2003, 82(1): 401-412.
[20] ROTHMAN L S, GORDON I E, BARBE A, BENNER D C, BERNATH P F, BIRK M, BOUDON V, BROWN L R, CAMPARGUE A, CHAMPION J P, CHANCE K, COUDERT L H, DANA V, DEVI V M, FALLY S, FLAUD J M, GAMACHE R R, GOLDMAN A, JACQUEMART D, KLEINER I, LACOME N, LAFFERTY W J, MANDIN J Y, MASSIE S T, MIKHAILENKO S N, MILLER C E, AHMADI N M, NAUMENKO O V, NIKITIN A V, ORPHAL J, PEREVALOV V I, PERRIN A, CROSSS A P, RINSLAND C P, ROTGER M,  M, SMITH M A H, SUNG K, TASHKUN S A. The HITRAN 2008 molecular spectroscopic database [J]. Journal of Quantitative Spectroscopy and Radiative Transfer, 2009, 110(9): 533-572.
王琪洁,张 勇,刘小力
中南大学 地球科学与信息物理学院,长沙 410083
摘 要:Malkmus带模式在气候研究以及遥感应用中具有较高的应用价值,然而其计算精度不高。针对该问题,引入修正量对Malkmus模型进行改进。实验采用HITRAN2008谱线数据和美国空军地球物理实验室(AFGL)提供的6种大气模式计算垂直路径大气分子的透射率数据。在不同的大气模式下,以MODTRAN计算结果为参考标准,利用最小二乘拟合得到修正量并将其用于大气透射率补偿。相对于传统Malkmus模型,改进模型的透射率精度提高了1~2个数量级。结果表明,本方法不仅能有效地提高模型计算精度,而且适用于不同的大气模式和大气分子。
关键词:Malkmus带模式;MODTRAN;透射率;大气吸收
(Edited by Sai-qian YUAN)
Foundation item: Projects (U1231105, 41404013) supported by the National Natural Science Foundation of China; Project (2012AA121301) supported by the National Hi-tech Research and Development Program of China
Corresponding author: Qi-jie WANG; Tel/Fax: +86-731-88830573; E-mail: qjwang@csu.edu.cn
DOI: 10.1016/S1003-6326(14)63391-4

