Influence of electric parameters on MAO of AZ91D magnesium alloy using alternative square-wave power source
��Դ�ڿ����й���ɫ����ѧ��(Ӣ�İ�)2011���2��
�������ߣ������� �ܷ��� �̾�˳ ���ľ� ���� �ż���
����ҳ�룺307 - 316
�ؼ��ʣ�AZ91D�������������䷽����ռ�ձȣ���ѹ��Ƶ��
Key words��AZ91D magnesium alloy; micro-arc oxidation (MAO); alternative square-wave; duty cycle; applied voltage; frequency
ժ Ҫ���ڼ�����������ϵ�У�ʹ�����͵Ľ��䷽����Դ��þ�Ͻ�AZ91D���Ʊ�������Ĥ��������ʵ�鷨�о���ѹ��Ƶ�ʺ�ռ�ձȵȵ�Դ������������Ĥ���ܵ�Ӱ�졣���������������Ĥ�ĺ�����ѹ��ռ�ձȵ����߶�������Ƶ�ʵ����߶�����������Ĥ�Ľṹ����ò���Դ�����ı仯���仯������Ĥ�ϵĿ�϶���ѷ�����ŵ�ѹ��ռ�ձȵ����߶����ࡣ����ѹ����120 Vʱ��ֻ�ܵõ�������������Ĥ������Ĥ����Ҫ�ɷ�ΪMgO, Al2O3, MgAl2O4 ��MgSiO3����3.5%�Ȼ�����Һ�У����õ绯ѧ�迹�ͼ��������������Ĥ����ʴ�ԡ��������������ѹ��Ƶ�ʺ�ռ�ձȷֱ�Ϊ140 V, 2 000 Hz ��0.4ʱ��������Ĥ����ʴ����á�
Abstract: Micro-arc oxidation (MAO) process was carried out on AZ91D alloy in alkaline borate solution using an alternative square-wave power source with different parameters. The effects of voltage, frequency and duty cycle on the coatings were investigated by orthogonal experiment. It is found that the thickness of coatings increases with the increase of voltage and duty cycle, but decreases with the increase of frequency. The structure and morphology of the coatings also depend on voltage, frequency and duty cycle. The coatings become more porous and crack with increasing voltage and duty cycle. The coating is thin and transparent when the voltage is lower than 120 V. The corrosion resistances of different coatings were evaluated by polarization curves and electrochemical impedance spectroscopy (EIS) in 3.5% NaCl (mass fraction) solution. When the optimized values of voltage, frequency and duty cycle are 140 V, 2 000 Hz and 0.4, respectively, the anodic coating shows the best corrosion resistance.

CHANG Lin-rong1, CAO Fa-he1, CAI Jing-shun1, LIU Wen-juan1, ZHANG Zhao1��ZHANG Jian-qing1, 2
1. Department of Chemistry, Zhejiang University, Hangzhou 310027, China;
2. State Key Laboratory for Corrosion and Protection, Institute of Metal Research, Chinese Academy of Sciences, Shenyang 110016, China
Received 1 February 2010; accepted 13 June 2010
Abstract: Micro-arc oxidation (MAO) process was carried out on AZ91D alloy in alkaline borate solution using an alternative square-wave power source with different parameters. The effects of voltage, frequency and duty cycle on the coatings were investigated by orthogonal experiment. It is found that the thickness of coatings increases with the increase of voltage and duty cycle, but decreases with the increase of frequency. The structure and morphology of the coatings also depend on voltage, frequency and duty cycle. The coatings become more porous and crack with increasing voltage and duty cycle. The coating is thin and transparent when the voltage is lower than 120 V. The corrosion resistances of different coatings were evaluated by polarization curves and electrochemical impedance spectroscopy (EIS) in 3.5% NaCl (mass fraction) solution. When the optimized values of voltage, frequency and duty cycle are 140 V, 2 000 Hz and 0.4, respectively, the anodic coating shows the best corrosion resistance.
Key words: AZ91D magnesium alloy; micro-arc oxidation (MAO); alternative square-wave; duty cycle; applied voltage; frequency
1 Introduction
Due to the low density and high strength-to-mass ratio, magnesium alloys are attractive for the automotive and aerospace industries where require the use of light weight materials. Indeed, this property is one of the main ways to make airplanes and cars more fuel-efficient and to fulfill the economic and environmental requirements of transport[1-2]. Unfortunately, the practical application of magnesium alloys has been limited because they are susceptible to corrosion and wear. It is generally accepted that one of the efficient ways to improve the corrosion resistance of magnesium alloy is achieved by anodization[3-5].
Micro-arc oxidation (MAO), a relatively new surface treatment, has been widely used in recent years because MAO can remarkably enhance the corrosion resistance of magnesium alloys by producing a relatively thick and dense coating. The properties of anodic coatings depend on many factors, such as the compositions of the substrate[6-7], the electric parameters[8-10], the concentration and chemical composition of electrolyte[11-15] and the post treatment[16]. The electric parameters applied during the anodization process have great influence on the properties of the anodic coatings. First, the electric parameters can change the transferring process of anions. Anions in the electrolyte need to arrive at the anode/electrolyte interface and then enter into anodic coatings. There are three ways by which anions move to the anode surface, namely, diffusion, convection and the electric migration is the main way during anodization. Under the electric field, the moving speed of anions in the electrolyte is different and therefore the selected electric parameters can affect coating compositions by changing the transferring process of anions. Second, the electric parameters are related with the thickness, structure and surface morphologies of anodic coatings[17]. In previous studies, several kinds of power sources were used to anodization, almost all of which applied the constant current or constant pulsed current mode[9, 18-20], while the constant applied voltage or constant pulsed voltage mode was rarely used. Because the difference of the transferring process of anions and formation process of anodic coating among these power source modes, the properties of anodic coatings obtained under constant pulsed voltage mode, such as thickness, structure, surface morphologies and corrosion resistance, may be different from those of anodic coatings obtained under other kinds of power sources. The effects of electric parameters on properties of anodic coating are often investigated by the conventional experimental approach, namely, one factor is varied while other factors keep constant. The optimum conditions obtained in the conventional approach may not be a true result when the interaction effects between the factors were considered[21].
In the present work, an alternative square-wave power source was designed to prepare the anodic coating of magnesium alloy with constant pulsed voltage mode. The effects of power source parameters such as the applied voltage, the frequency and the duty cycle on properties of the anodic coating on AZ91D were investigated by orthogonal experiment.
2 Experimental
AZ91D magnesium alloy specimens with dimensions of 30 mm ? 20 mm ? 5 mm, cut from ingot, were used as substrates for the anodization process. The compositions of AZ91D are listed in Table 1. Their two faces and four sides were polished by hand with SiC abrasive paper (grit 320 to 1000) and degreased with acetone and then washed with distilled water before anodizing for 3 min in the electrolyte containing 50 g/L NaOH, 10 g/L H3BO3, 20.0 g/L Na2B4O7��10H2O, 10 g/L C6H5Na3O7��2H2O and 2 g/L organic additive[12, 22]. The initial temperature of the electrolyte was (30 �� 1) ��C.
Table 1 Chemical compositions of AZ91D magnesium alloy (mass fraction, %)
![]()
A 20 kW-alternative square wave power source was employed for pulse anodizing with a constant square wave voltage. The wave form of the applied voltage is shown in Fig.1.
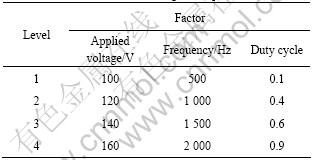
In the orthogonal experiment, three factors with four levels including applied voltage, frequency and duty cycle were used to investigate the effects of electric parameters on the thickness, the morphology and the corrosion resistance of AZ91D with the coating obtained by constant pulsed voltage mode. Factors and levels of the orthogonal experiment are listed in Table 2.
The thickness of the coating was measured using an eddy-current coating thickness measurement gauge

Fig.1 Scheme of wave form of applied voltage (V) for alternative square wave anodization (t: Time)
Table 2 Factors and levels of orthogonal experiment
(TT240 made by Peak Times, China). The thickness data given were the average of at least six values at different locations of the coating. The morphologies of the as-obtained coating were observed using HITACHI S4800 scanning electron microscope. The structure and composition of the coating were examined by D/max-rA X-ray diffractometer (Rigaku, Japan).
Before electrochemical test, the anodized electrodes were covered by epoxy resin except working surface of 2.0 cm2. A three-electrode cell with anodic coating as working electrode, saturated calomel electrode (SCE) as reference electrode and platinum sheet with large area as counter electrode was employed in the electrochemical test. The electrochemical test was carried out in 3.5% NaCl (mass fraction) aqueous solution. Before each corrosion test, the working electrode was immersed in the solution for 30 min to obtain the relatively stable open circuit potential (OCP). Polarization curves were obtained using CHI630C Potentiostat (CH Instruments Inc., USA). The ratio of volume of neutral 3.5% NaCl solutions (pH 7.03) to sample area was 50 mL/cm2. After 30 min immersion, potential scanning was conducted at a rate of 0.5 mV/s from -0.20 V to 1.00 V vs OCP. EIS measurement was performed in the 10 mHz-10 kHz frequency range using a 20 mV peak to peak a.c. excitation[23] with a VMP2 Multichannel Potentiostat produced by Princeton Applied Research Corporation (PARC) of USA. The experimental impedance spectra were interpreted on the basis of equivalent electrical circuits using fitting software (ZView).
3 Results
3.1 Orthogonal experiment and analysis
In the present work, the orthogonal experiment of three factors including applied voltage, frequency and duty cycle with four levels was used to comprehensively investigate the effects of power source parameters on the corrosion resistance of the coating on AZ91D. The corrosion resistance of anodic coatings which were immersed in 3.5% NaCl solution for 30 min before each test was evaluated by EIS and polarization curves. Fig.2 shows the Nyquist plots of various coatings formed under different conditions. The shapes of Nyquist plots are similar except for the difference in the diameter of loops. In all cases, the Nyquist diagrams contain two capacitive loops in the high and medium frequency domains which are more or less separated, and an inductive loop in the low frequency domain. The high frequency capacitive loop may originate from the anodic coating formed on the AZ91D and the medium frequency one may be attributed to the corrosion reaction[22],
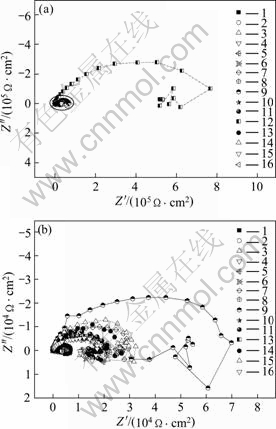
Fig.2 Nyquist diagrams for anodic coatings of AZ91D alloy obtained from orthogonal experiment in 3.5% NaCl solution (Insert is Nyquist diagram except No.12)
while the inductive component of the lower frequency domain should correspond to the porous structure of the coatings, indicating cathodic process, such as the reduction of H+, taking place through the pit channels. So the sum of the two capacitive loops strongly corresponds to the corrosion resistance of anodic coatings under various alternative square wave parameters[24].
The choice of an equivalent circuit fitting the EIS diagrams is always a compromise between a reasonable fitting of the experimental values and a sufficient description of the electrochemical system by keeping the number of circuit elements at a minimum[19]. Based on the above rule, a typical equivalent circuit is employed to fit the two capacitive loops of the EIS data, which is displayed in Fig.3, where Rs is the electrolyte resistance on electrode surface, Rsurf is the coating resistance (determined by solution concentration, thickness and porosity of the coating), Rt is the charge transfer resistance, and Csurf and Cdl are the coating capacitance and the solution/metal interface capacitance, respectively. Csurf and Cdl both are the constant phase elements (CPE), which reflect the dispersion of a capacitive element around a central value. The relationship between an ideal capacitor and a CPE is as follows[24]:
![]()
where n takes different values, CPE represents the corresponding element, such as pure capacitor and inductive element.
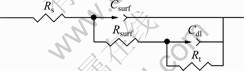
Fig.3 Equivalent circuit of EIS fitting for anodic coating of magnesium alloy in 3.5% NaCl solution
The orthogonal experimental array and experimental results are listed in Table 3. In order to systematically investigate the effects of electric parameters on the coating, the experimental data were treated by the method of intuitionistic analysis and the results are listed in Tables 4-6. The maximum difference between the average data at two levels for each factor indicates the general effect of that factor.
It is obvious that No.12 coating (140 V applied voltage, 2000 Hz frequency and 0.4 duty cycle) possesses the highest Rsurf and Rt among all the coatings listed in Table 3. The Rsurf and Rt of No. 12 coating are larger by one or two orders of magnitude than those of other coatings.
The factor response on the Rsurf and Rt is listed in
Table 3 Orthogonal experimental array and fitting results of EIS data and polarization curves
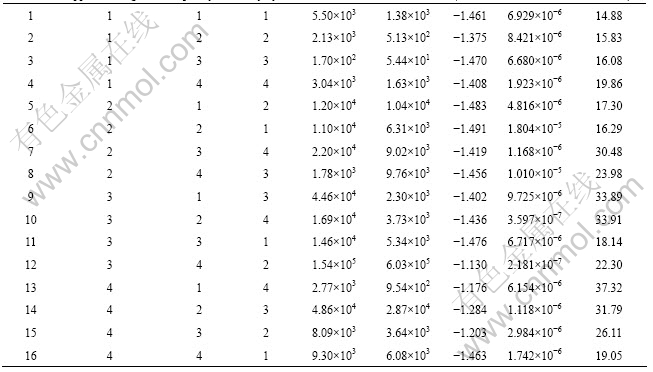
Table 4, which was synthesized by calculating the mean Rsurf and Rt of all coatings at each level for the three factors. The maximum difference between the average Rsurf and Rt at two levels of each factor indicates the general effect of that factor. Based on the value of the difference, the effect order of factors on the Rsurf and Rt of the coatings can be found. It is obvious that the applied voltage is the major factor affecting the Rsurf and Rt, which is listed in Table 4. The decreasing sequence of factors affecting the Rsurf and Rt of the coatings is duty cycle and frequency.
From Tables 3 and 4, Rsurf and Rt increase until they reach a peak value when the applied voltage is at level 3 and they decline with a further increase of applied voltage. The Rsurf and Rt of the coatings show slightly fluctuation in the frequency region between level 1 and level 3, but show a significant increase at level 4, which indicates that Rsurf and Rt are improved greatly when the frequency is higher than 1 500 Hz. The duty cycle has the same effect on the Rsurf and Rt of the coatings with applied voltage and the peak value appears when the duty cycle is 0.4 at level 2.
Typical polarization curves of anodic coating and AZ91D magnesium alloy are shown in Fig.4. All the polarization curves of the anodic coatings obtained from orthogonal experiments present similar behavior. The values of corrosion potential (��corr) and corrosion current density (Jcorr) for each polarization curve are also listed in Table 3. The fitting method of the corrosion current density (Jcorr) and corrosion potential (��corr) was suggested by SANDENBERGH et al[25]. It is obvious that the No.12 coating has the most positive corrosion potential and the smallest corrosion current density, which is in accordance with EIS results.
The factor response for ��corr and Jcorr are listed in Table 5. Based on the value of the difference, the rank of influencing factors on ��corr of anodic coatings is voltage>duty cycle>frequency, while the rank of influencing factors on Jcorr of anodic coatings is duty cycle > applied voltage > frequency.
The ��corr decreases until it gets a minimum value when the applied voltage is at level 2 and it increases with a further increase of voltage, while Jcorr takes on reverse trend with the increase of applied voltage. The ��corr of the coatings only slightly increases with the increase of frequency, but Jcorr has a significant decrease when the frequency is over 1 000 Hz. The effect of duty cycle on ��corr and Jcorr of the coatings is complicated. In general, the ��corr increases with the increase of duty cycle, whereas, Jcorr shows an opposite trend.
The thicknesses of anodic coatings are also listed in Table 3, and the factor response for thickness is shown in Table 6, which indicates that the rank of influencing factors on thickness of anodic coatings is duty cycle> applied voltage>frequency. It is evident that the thickness of coatings increases with increasing applied voltage and duty cycle, but decreases with increasing frequency. However, corrosion resistance parameters, Rsurf, Rt, ��corr and Jcorr are independent on the thickness, which indicates that the corrosion resistance is mainly
Table 4 Factor response for Rsurf and Rt
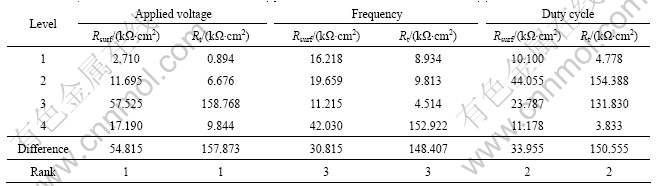
Table 5 Factor response for ��corr and Jcorr

Table 6 Factor response for thickness of coatings.
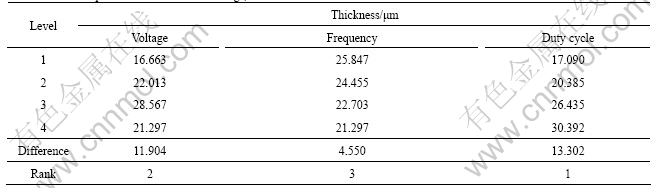
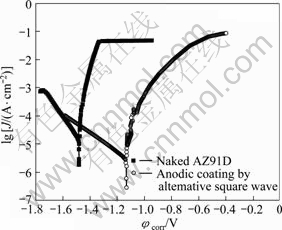
Fig.4 Polarization curves for AZ91D and typical anodic coating in 3.5% NaCl solution
relevant to the structure and composition of anodic coating, not the thickness, under different experimental conditions.
Based on the data of Rsurf, Rt, ��corr and Jcorr, the optimum electric parameters for the corrosion resistance are applied voltage of 140 V, frequency of 2 000 Hz and duty cycle of 0.4. And the values of Rsurf, Rt, ��corr and Jcorr of the coating obtained under the optimum electric parameters are 1.54��105 ����cm2, 6.03��105 ����cm2, -1.13 V and 2.18��10-7 A/cm2, respectively, which takes on a relatively high corrosion resistance of anodization of magnesium alloy.
3.2 Composition
X-ray diffraction (XRD) analysis was used to investigate the composition of anodic coatings obtained from the orthogonal experiment. The typical XRD pattern, as shown in Fig.5, indicates that the anodic coatings under alternative square wave are mainly composed of MgO, MgAl2O4, MgSiO3, and Al2O3. The intensity of the crystalline peak of the XRD patterns at the same 2�� degree is different, which indicates that the content for the same composition of anodic coatings obtained under different parameters is different. It is difficult to differentiate compositions from each other because one peak of the XRD patterns may correspond to several different compositions.
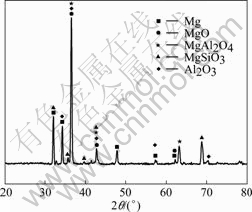
Fig.5 XRD patterns of anodic coatings obtained from orthogonal experiment (Order is No.1 to No.16 from bottom to top)
3.3 Surface and cross section morphology
The corrosion resistance of anodic coatings is related to microstructure of anodic coatings formed
under various parameters. How do these electric parameters affect the coating morphologies? It is essential to investigate the correlation between them because the microstructure of anodic coating plays an important role in corrosion resistance.
3.3.1 Effect of applied voltage
Fig.6 shows the SEM images of the anodic coating fabricated on AZ91D magnesium alloy under various applied voltages, while the frequency and duty cycle are 2 000 Hz and 0.4, respectively. When the applied voltage is 100 V, there is no marked sparking discharge on the surface of the substrate. At the end of anodization, the substrate is covered by a thin transparent passive film, as shown in Fig.6(a). The anodic coating is smooth and uniform with some grinding traces owing to the pretreatment and its pore size is very small. When the applied voltage is more than 100 V, sparking appears on the whole electrode surfaces in the first 10 s accompanied with formation of bubbles. Then, sparking discharge decreases slowly and only takes place on some weak sites of oxide film. At the end of anodic process, sparking discharge stops[24]. As shown in Fig.6(b), the anodic coating is thicker and the pore size is larger than that shown in Fig.6(a), while several cracks appear on the surface of the anodic coating. The number of pores and cracks increases with increasing applied voltage, and the size becomes larger and larger, too, which means the porosity of anodic coating increases with increasing applied voltage. The anodic coating is smooth and uniform but thin when applied voltage is lower than 120 V, and is thick but rough when applied voltage is higher than 140 V.
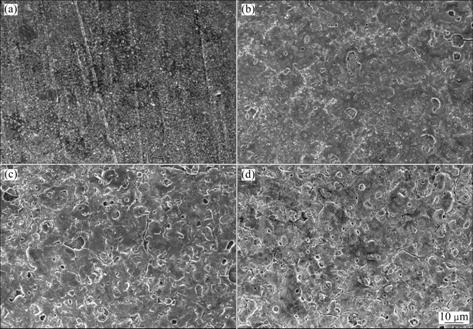
Fig.6 Surface morphologies of AZ91D anodized at frequency of 2 000 Hz, duty cycle of 0.4 under different applied voltages: (a) 100 V; (b) 120 V; (c) 140 V; (d) 160 V
3.3.2 Effect of frequency
Frequency also plays an important role in the corrosion resistance based on the above data. Surface morphologies of anodic coatings obtained at frequencies of 500, 1 000, 1 500, 2 000 Hz are shown in Fig.7. The pore size of the anodic coating obtained at 500 Hz is larger than that at 1 000 Hz, which is almost the same as that at 1 500 Hz and 2 000 Hz. It is evident that the anodic coating becomes rough when the frequency is lower than 1 000 Hz.
3.3.3 Effect of duty cycle
Under the same applied voltage and frequency, the surface morphologies at different duty cycles are shown in Fig.8. The anodic coatings become even and uniform
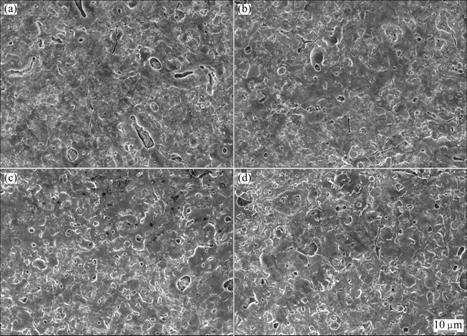
Fig.7 Surface morphologies of AZ91D anodized at voltage of 140 V, duty cycle of 0.4 under different frequencies: (a) 500 Hz; (b) 1 000 Hz; (c) 1 500 Hz; (d) 2 000 Hz
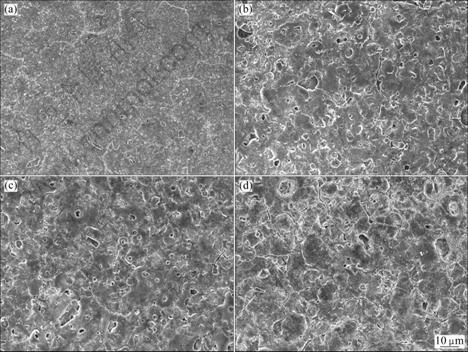
Fig.8 Surface morphologies of AZ91D anodized at applied voltage of 140 V, frequency of 2 000 Hz under different duty cycles: (a) 0.1; (b) 0.4; (c) 0.6; (d) 0.9
when there is a breaking off time in the anodic process[26]. It is obvious that duty cycle has the same influence trend with increasing applied voltage. When the duty cycle is 0.1, the anodic coating is smooth and uniform but thin, and when it is 0.9, the anodic coating is much rough with many large pores and creaks. When the duty cycle is 0.4 or 0.6, the coating morphologies are similar with each other, which are less smooth and uniform than that is 0.1, but less large pores and creaks than that is 0.9.
3.3.4 Cross section morphology
Fig.9 shows the cross section morphologies of the anodic oxide films formed under different alternative square-wave applied voltages. Although some micro-pores and micro-cracks can be seen in the cross-section, no pit transfixes the whole coating from the surface to the substrate, which means that there is an inner barrier layer between the substrate and the outer porous layer, but there is no precise boundary between the inner barrier layer and the outer porous layer. The coatings show good bonding strength to the substrate. Since the internal substrate is covered by a relatively intact barrier layer, which is composed of relatively stable thermodynamic compounds and it can provide effective protection. DUAN et al[12] and CAO et al[24] have also reported that the anodic coating of AZ91 magnesium alloy has a two-layer structure[12, 24] under DC and AC anodization.
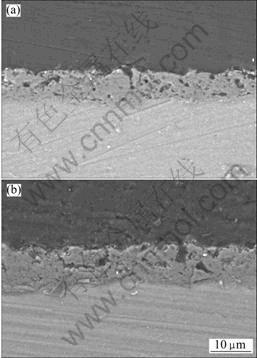
Fig.9 Cross-section morphologies of anodic oxide films formed under different anodizing parameters: (a) Voltage 140 V, frequency 2 000 Hz, duty cycle 0.4; (b) Voltage 160 V, duty cycle 0.4, frequency 2 000 Hz
As shown in Fig. 9 and Table 3, the thickness of anodic coating (dT) measured by TT240 is larger than its real thickness (dR) by cross section image, which can be attributed to pores and cracks of anodic coating showing great influence on eddy-current coating thickness measurement with TT240. From our large number of experiments, the relationship between dT and dR can be described as the following equation from lots of cross section images: dR=0.4dT, which indicates that the real thickness of coating can be detected easily by TT240 under the experimental condition.
The anodic coating obtained under 160 V is thicker than that obtained under 140 V. The increase of thickness is benefit to corrosion resistance of anodic coatings, but as mentioned above, the corrosion resistance of anodic coatings decreases with the increase of applied voltage when the voltage is higher than 140 V. The main reason is that the porosity of the outer porous layer of anodic coating also increases with the increase of applied voltage. The electrolyte including aggressive ions will be much easier to penetrate into the coating with higher porosity and contact with inner barrier layer and substrate, which indicates that the thickness and structure of anodic coating will be changed with power source parameters, but the variance of thickness and microstructure (pores and cracks) presents an opposite effect on the corrosion resistance of anodic coatings. It is well shown that the corrosion resistance of the anodic coating is mainly determined by the thickness and structure simultaneously.
4 Discussion
4.1 Effect of applied voltage
The effect of applied voltage on coating corrosion resistance is various with its thickness and porosity[17]. When the applied voltage is increased, the anodic reaction becomes more intense and more magnesium alloys are oxidized into various oxidations, which will make the thickness increase. But much more energy will be released from the anodic reaction and much more gas, which can make the anodic coating more porous, will be released with increase of the applied voltage because of the vaporization of water and the secondary reaction (the water electrolysis). According to the above result, the applied voltage is a main factor on the coating thickness. The thickness of coating will increase with increasing applied voltage. If the porosity keeps constant with thickening coating, the corrosion resistance of anodic coatings can be improved with increasing coating thickness. However, the micro-porer and cracks become larger with the increase of applied voltage, which indicates that the porosity (micro-pores and cracks) also increases with increasing applied voltage and the corrosion resistance of anodic coating decreases. The two opposite effects on the corrosion resistance of anodization magnesium alloy determine that the applied voltage possesses an optimum value, not too high or too low. In our experimental system, 120-140 V applied voltage is the optimal range.
4.2 Effect of frequency
In one cycle, there are four segments, such as one anodic process, one cathodic process and two periods of breaking off for one working electrode. Frequency is defined as the pulse number per second, namely, the reciprocal of the total time (t) for one cycle: t=1/f. The higher the frequency, the shorter the time of one cycle. For a given duty cycle, the continually anodizing time in one cycle decreases with the increase of frequency, which results in a good restoration of anodic coatings by electrolyte and a decrease of gas evolution. The energy released from the anodic reaction in one cycle will decrease with the increase of frequency, which can decrease the vaporization and electrolysis of water. And the cathodic process numbers increase with increasing frequency, which can reduce the concentration polarization caused by the anodic process. As stated the porosity decreases and the corrosion resistance of anodic coatings improves with the increase of frequency.
4.3 Effect of duty cycle
Duty cycle is the ratio of working time to total time in one cycle. The higher the duty cycle, the longer the working time, and the higher the energy in one cycle. The influence of duty cycle is similar with that of the applied voltage. For a given voltage and frequency, the anodic reaction and vaporization and electrolysis of water will simultaneously intensify with the increase of duty cycle, which makes the thickness and porosity of anodic coating increase at the same time. When the duty cycle is lower than 0.4, the thickness of anodic coating is too thin to provide effective protection to the substrate of magnesium alloy. But the anodic coating also cannot provide effective protection to the substrate of magnesium alloy when the duty cycle is higher than 0.6 because the porosity of anodic coating is too high. Anodic coatings possess better corrosion resistance when duty cycle is between 0.4 and 0.6, while applied voltage and frequency keep constant.
5 Conclusions
1) The alternative power source parameters including applied voltage, frequency and duty cycle exert a remarkable influence on thickness, surface morphologies and structure of anodic coatings. With the increase of applied voltage and duty cycle, anodic coatings gradually thicken and the porosity becomes larger. The thickness and porosity show opposite effects on the corrosion resistance, resulting in an optimal value for applied voltage and duty cycle. The porosity and thickness of anodic coating decrease with increasing frequency, but the change of thickness is slight. Therefore, the increase of frequency further improves the corrosion resistance of anodic coating.
2) The effect order of factors on the corrosion resistance of the anodic coatings of AZ91D is applied voltage> duty cycle> frequency. The optimum corrosion resistance of anodic coating could be obtained when the process parameters are applied voltage 140 V, frequency 2 000 Hz and duty cycle 0.4.
References
[1] COLE G S, SHERMAN A M. Light weight materials for automotive applications [J]. Materials Characterization, 1995, 35: 3-9.
[2] MORDIKE B L, EBERT T. Magnesium properties- applications-potential [J]. Materials Science and Engineering A, 2001, 302: 37-45.
[3] KHASELEV O, YAHALOM J. Constant voltage anodizing of Mg-Al alloys in KOH-aluminate solutions under sparking [J]. J Electrochem Soc, 1998, 145: 190-193.
[4] KHASELEV O, WEISS D. YAHALOM J. Structure and composition of anodic films formed on binary Mg-Al alloys in KOH�Caluminate solutions under continuous sparking [J]. Corros Sci, 2001, 43: 1295-1307.
[5] ZHANG Y J, YAN C W, WANG F H, LOU H Y, CAO C N. Study on the environmentally friendly anodizing of AZ91D magnesium alloy [J]. Surf Coat Technol, 2002, 161: 36-43.
[6] SHI Z M, SONG G L, ATRENS A. Corrosion resistance of anodised single-phase Mg alloys [J]. Surf Coat Technol, 2006, 201: 492-503.
[7] SHI Z M, SONG G L, ATRENS A. Influence of the �� phase on the corrosion performance of anodised coatings on magnesium�Caluminium alloys [J]. Corros Sci, 2005, 47: 2760-2777.
[8] QIAN Jian-gang, WANG Chun, LI Di, GUO Bao-lan, SONG Guang-ling. Formation mechanism of pulse current anodized film on AZ91D Mg alloy [J]. Transactions of Nonferrous Metals Society of China, 2008, 18: 19-23.
[9] TIMOSHENKO A V, MAGUROVA Y V. Investigation of plasma electrolytic oxidation processes of magnesium alloy MA2-1 under pulse polarisation modes [J]. Surf Coat Technol, 2005, 199: 135-140.
[10] GUO H F, AN M Z, XU S, HUO H B. Formation of oxygen bubbles and its influence on current efficiency in micro-arc oxidation process of AZ91D magnesium alloy [J]. Thin Solid Films, 2005, 485: 53-58.
[11] LIANG J, GUO B G, TIAN J, LIU H W, ZHOU J F, LIU W M, XU T. Effects of NaAlO2 on structure and corrosion resistance of microarc oxidation coatings formed on AM60B magnesium alloy in phosphate-KOH electrolyte [J]. Surf Coat Technol, 2005, 199: 121-126.
[12] DUAN H P, YAN C W, WANG F H. Effect of electrolyte additives on performance of plasma electrolytic oxidation films formed on magnesium alloy AZ91D [J]. Electrochim Acta, 2007, 52: 3785-3793.
[13] FUKUDA H, MATSUMOTO Y. Effects of Na2SiO3 on anodization of Mg-Al-Zn alloy in 3 M KOH solution [J]. Corros Sci, 2004, 46: 2135-2142.
[14] VERDIER S, BOINET M, MAXIMOVITCH S, DALARD F. Formation, structure and composition of anodic films on AM60 magnesium alloy obtained by DC plasma anodising [J]. Corros Sci, 2005, 47: 1429-1444.
[15] BAI A, CHEN Z J. Effect of electrolyte additives on anti-corrosion ability of micro-arc oxide coatings formed on magnesium alloy AZ91D [J]. Surf Coat Technol, 2009, 203: 1956-1963.
[16] HSIAO H Y, CHUNG P, TSAI W T. Baking treatment effect on materials characteristics and electrochemical behavior of anodic film formed on AZ91D magnesium alloy [J]. Corros Sci, 2007, 49: 781-793.
[17] ZHANG R F, SHAN D Y, CHEN R S, HAN E H. Effects of electric parameters on properties of anodic coatings formed on magnesium alloys [J]. Mater Chem Phys, 2008, 107: 356-363.
[18] SRINIVASAN P B, LIANG J, BLAWERT C, STORMER M, DIETZEL W. Effect of current density on the microstructure and corrosion behaviour of plasma electrolytic oxidation treated AM50 magnesium alloy [J]. Appl Surf Sci, 2009, 255: 4212-4218.
[19] BARCHICHE C E, ROCCA E, HAZAN J. Corrosion behaviour of Sn-containing oxide layer on AZ91D alloy formed by plasma electrolytic oxidation [J]. Surf Coat Technol, 2008, 202: 4145-4152.
[20] GHASEMI A, RAJA V S, BLAWERT C, DIETZEL W, KAINER K U. Study of the structure and corrosion behavior of PEO coatings on AM50 magnesium alloy by electrochemical impedance spectroscopy [J]. Surf Coat Technol, 2008, 202: 3513-3518.
[21] SRINIVASAN S B, NARASIMHAN N L, ILANGO S V. Development of rapid-set high-strength cement using statistical experimental design [J]. Ceme Conc Res, 2003, 33: 1287-1292.
[22] WU C S, ZHANG Z, CAO F H, ZHANG L J, ZHANG J Q, CAO C N. Study on the anodizing of AZ31 magnesium alloys in alkaline borate solutions [J]. Appl Surf Sci, 2007, 253: 3893-3898.
[23] UDHAYAN R, BHATT D P. On the corrosion behaviour of magnesium and its alloys using electrochemical techniques [J]. J Power Sources, 1996, 63: 103-107.
[24] CAO F H, CAO J L , ZHANG Z, ZHANG J Q, CAO C N. Plasma electrolytic oxidation of AZ91D magnesium alloy with different additives and its corrosion behavior [J]. Mater Corros, 2007, 58: 676-703.
[25] SANDENBERGH R F, van der LINGEN E. The use of Tafel back extrapolation to clarify the influence of ruthenium and palladium alloying on the corrosion behaviour of titanium in concentrated hydrochloric acid [J]. Corros Sci, 2005, 47: 3300-3311.
[26] WANG X M, ZHU L Q, LI W P, LIU H C, LI Y H. Effects of half-wave and full-wave power source on the anodic oxidation process on AZ91D magnesium alloy [J]. Appl Surf Sci, 2009, 255: 5721-5728.
������1, �ܷ���1, �̾�˳1, ���ľ�1, �� ��1, �ż���1, 2
1. �㽭��ѧ ��ѧϵ, ���� 310027;
2. �й���ѧԺ �����о��� ��ʴ����������ص�ʵ����, ���� 110016
ժ Ҫ���ڼ�����������ϵ�У�ʹ�����͵Ľ��䷽����Դ��þ�Ͻ�AZ91D���Ʊ�������Ĥ��������ʵ�鷨�о���ѹ��Ƶ�ʺ�ռ�ձȵȵ�Դ������������Ĥ���ܵ�Ӱ�졣���������������Ĥ�ĺ�����ѹ��ռ�ձȵ����߶�������Ƶ�ʵ����߶�����������Ĥ�Ľṹ����ò���Դ�����ı仯���仯������Ĥ�ϵĿ�϶���ѷ�����ŵ�ѹ��ռ�ձȵ����߶����ࡣ����ѹ����120 Vʱ��ֻ�ܵõ�������������Ĥ������Ĥ����Ҫ�ɷ�ΪMgO, Al2O3, MgAl2O4 ��MgSiO3����3.5%�Ȼ�����Һ�У����õ绯ѧ�迹�ͼ��������������Ĥ����ʴ�ԡ��������������ѹ��Ƶ�ʺ�ռ�ձȷֱ�Ϊ140 V, 2 000 Hz ��0.4ʱ��������Ĥ����ʴ����á�
�ؼ��ʣ�AZ91D�������������䷽����ռ�ձȣ���ѹ��Ƶ��
(Edited by LI Xiang-qun)
Foundation item: Project (50801056) supported by the National Natural Science Foundation of China; Project (2005DKA10400-Z20) supported by the National R&D Infrastructure and Facility Development Program of China; Project supported by the Zijin Project of Zhejiang University, China
Corresponding author: CAO Fa-he; Tel: +86-571-87952318; Fax: +86-571-87951895; E-mail: nelson_cao@zju.edu.cn
DOI: 10.1016/S1003-6326(11)60714-0

