A novel coordinated control strategy considering power smoothing for a hybrid photovoltaic/battery energy storage system
��Դ�ڿ������ϴ�ѧѧ��(Ӣ�İ�)2016���2��
�������ߣ�DAUD Muhamad Zalani MOHAMED Azah HANNAN M A
����ҳ�룺394 - 404
Key words��photovoltaic power smoothing; battery energy storage; state-of-charge control; islanded microgrid
Abstract: This work presents a novel coordinated control strategy of a hybrid photovoltaic/battery energy storage (PV/BES) system. Different controller operation modes are simulated considering normal, high fluctuation and emergency conditions. When the system is grid-connected, BES regulates the fluctuated power output which ensures smooth net injected power from the PV/BES system. In islanded operation, BES system is transferred to single master operation during which the frequency and voltage of the islanded microgrid are regulated at the desired level. PSCAD/EMTDC simulation validates the proposed method and obtained favorable results on power set-point tracking strategies with very small deviations of net output power compared to the power set-point. The state-of-charge regulation scheme also very effective with SOC has been regulated between 32% and 79% range.
J. Cent. South Univ. (2016) 23: 394-404
DOI: 10.1007/s11771-016-3084-2

DAUD Muhamad Zalani1, MOHAMED Azah2, HANNAN M A2
1. School of Ocean Engineering, Universiti Malaysia Terengganu, 21030 Kuala Terengganu, Terengganu, Malaysia;
2. Department of Electrical, Electronic, and Systems Engineering, Universiti Kebangsaan Malaysia, 43600 Bangi, Selangor, Malaysia
 Central South University Press and Springer-Verlag Berlin Heidelberg 2016
Abstract: This work presents a novel coordinated control strategy of a hybrid photovoltaic/battery energy storage (PV/BES) system. Different controller operation modes are simulated considering normal, high fluctuation and emergency conditions. When the system is grid-connected, BES regulates the fluctuated power output which ensures smooth net injected power from the PV/BES system. In islanded operation, BES system is transferred to single master operation during which the frequency and voltage of the islanded microgrid are regulated at the desired level. PSCAD/EMTDC simulation validates the proposed method and obtained favorable results on power set-point tracking strategies with very small deviations of net output power compared to the power set-point. The state-of-charge regulation scheme also very effective with SOC has been regulated between 32% and 79% range.
Key words: photovoltaic power smoothing; battery energy storage; state-of-charge control; islanded microgrid
1 Introduction
In Malaysia, the use of photovoltaic (PV)-based renewable energy (RE) generation has recently increased. Some contributing factors to PV investment include attractive feed-in tariff rates, government incentives, and subsidies [1]. However, increased PV penetration adversely affects power networks; such effects include output power fluctuation [2-7]. This issue is critical when it comes to integrating a large PV farm in weak, remote, or island power networks [5-7]. The case of a large-scale residential PV project in Japan suggests that a special controller needs to be activated for the battery energy storage (BES) system to mitigate intermittency impacts between 11 a.m. and 3 p.m. when high PV power fluctuation typically occurs [4]. Furthermore, new regulations may be imposed on distributed generation (DG) operators in the near future. One regulation states that every fluctuated power injected to the utility grid at a certain level would be penalized or the DG owners would be forced to curtail power generation. DG owners may receive extra payment from the utility grid operator for every smoothed power delivered to the utility grid [2].
Recently, the use of BES to smooth out output power fluctuation of RE sources has been a promising solution. However, adopting a large-scale BES for such purpose would be challenging because BES is expensive. The control strategies developed for BES in mitigating RE integration issues are related to the problems, such as 1) intermittency impacts in which the output should be regulated at the desired smoothing or dispatching level for a PV farm to be dispatchable like conventional generators [3, 5-6], 2) output power ramps such that both positive and negative large power ramps should be limited to integrate a large amount of RE generation to the utility grid [5-6], and 3) excessive generation in which in some situations, the output power needs to be curtailed to avoid congestion of transmission lines [2, 8].
Aside from the above mentioned issues [2-3, 5-6, 8], other crucial problems need to be addressed to minimize the impacts of fluctuated power injected to the utility grid. Such problems include operation safety and optimal use of BES during grid-connected operation [9] and emergency operation during system islanding [10]. EGHTEDARPOUR and FARJAH [8], XU and chen [11] proposed the control of a DC microgrid to enable power balance between sources and loads during grid-connected and islanded operations. The BES is connected at the DC bus and controlled via a DC�CDC power converter to regulate DC power networks. BES is also dominant in an AC microgrid where it is interfaced to the AC bus via a voltage-sourced converter (VSC) [10, 12-13]. The control system allows the hybrid system to operate under variable generation and load conditions.However, previous studies predominantly focus on the control and operation of BES in islanded conditions in which BES is assumed inactive in grid-connected operations. As suggested by DAUD et al [9], to increase the value of BES, single installation should consider more than one application which facilitates control flexibilities, such as power or voltage regulation, reactive support, capacity factor improvement and many more. Recently, LIU et al [14] and TAN et al [15] proposed a coordinated control strategy for a hybrid PV/BES system with consideration of state-of-charge (SOC) constraints in managing local loads within a microgrid. However, detailed modeling of BES was not discussed. This modeling is essential to address more non-linear effects when BES operates in continuous charging/discharging. Thus, the accuracy of the proposed SOC regulation scheme remains questionable. The efficiency of power conversion of the BES system requires accurate SOC estimation because SOC is one of the input parameters for the BES controller. This paper proposes a coordinated control strategy for a PV/BES system, which mitigates output power fluctuation during grid-connected operations and frequency/voltage control when the system forms a microgrid. Power fluctuation mitigation requires continuous operation of BES. Thus, the existing BES model is modified. BES model improvement permits accurate estimation of BES SOC and efficient performance of the developed SOC feedback (SOC-FB) control scheme for safety purposes. The proposed coordinated control strategy allows switching between operation modes and considers normal or high fluctuations and emergency conditions.
2 System configuration and control
The system configuration of the PV/BES system that is considered for simulation is a portion of the power network adopted from a standard medium voltage distribution system [16]. Relevant information for the hybrid sub-system is available in Section 2.1, and detailed parameters of the upstream network are available in Ref. [16].
2.1 Structure of PV/BES sub-system and its operation
Figure 1 shows the configuration of hybrid PV/BES. VSC is used as the interface for 1 MWp PV and 0.3 MWh BES systems in which the outputs of VSC1 and VSC2, respectively, are connected to the point of common connection (PCC). The PV system achieved its maximum power point tracking (MPPT) operation through a buck converter, which is controlled based on the incremental conductance MPPT algorithm [17�C18]. System loads PL1 (0.15 MW), PL2 (0.2 MW), and PL3 (0.1 MW), which represent three different load characteristics, are connected along downstream feeders from the PCC. The loads may be shed depending on the priority during islanded operations [11]. The grid represents the upstream network, which is connected to the 110 kV system bus (not shown in Fig. 1) of the standard power network [16].

Fig. 1 Configuration of PV/BES sub-system
Figure 2 shows the system operation of the hybrid PV/BES system based on the proposed coordinated control algorithm. Different operation modes are devised over one day of operation, as illustrated in the upper right corner of Fig. 2. These modes are generally divided into normal operation (mode I), which takes place during hours of less impact of PV output power fluctuation, power fluctuation mitigation (mode II), which takes place during hours with high PV fluctuation, and emergency operation modes (modes III and IV). The emergency operation considers power curtailment (off-MPPT�Cmode III) and islanding (mode IV) of the hybrid system. By referring to Figs. 1 and 2, a detailed explanation of each mode is given as below.
2.1.1 Mode I
PV farm delivers its available power (PPV) to the PCC that feeds local loads in this mode. The access or deficit of power against system local loads (PL) will be compensated by the power from the grid (PG) as
PG,ref=PPV-PL (1)
where PG,ref denotes the required or reference power to be delivered or absorbed by the utility grid to satisfy local loads. At this stage, BES is idle and step charging/ discharging may be required depending on the SOC of BES. Standby SOC for next-day regulation service may be specified at a medium value, such as 0.6 p.u. Deactivating the BES in the morning and late afternoon is essential because the PPV injected to the PCC fluctuates less during these hours. Therefore, the microgrid protection system is less susceptible to the negative impact of PV power intermittency. Furthermore, unnecessary BES charge/discharge cycles may be avoided to further extend the life of the system.
2.1.2 Mode II
In this mode, power smoothing is activated during hours of high fluctuation, that is, the mode switching time (modes I to II, and vice versa), H, defined as 10��H��16 in hours. BES power will compensate for deviation between PPV and the power smoothing set-point, PSET in this mode. PSET originates from the microgrid management system (MMS) to ensure that smoothed power can be delivered to the PCC or the grid and is presented as
PBES,ref=PSET�CPPV (2)
where PBES,ref denotes the required or reference power to be charged/discharged by the BES.
In practice, PSET is a moving average of the PPV signal which may be obtained by using a low-pass filter [7]. The bottom right portion of Fig. 1 illustrates the operating principle. The SOC needs to be regulated at an appropriate level to ensure the safe and efficient operation of the BES. Thus, an SOC-FB control strategy of BES for smoothing is proposed, as will be further explained in Section 2.2.
2.1.3 Mode III
A hybrid system should always be on standby for emergencies while the system operates in modes I or II during operating hours. For example, to account for the possibility of access power generation from a PV farm, which typically occurs at low loads, PPV penetration to the utility grid needs to be limited, which can be achieved by activating mode III, in which the MPPT controller will be deactivated at any time when total power PG injected to the utility grid exceeds the maximum power, PG,max (i.e. PG��PG,max). This PG,max is assumed as the maximum capacity of the transmission lines to prevent congestion during hours of high generation from PV sources [2, 8].
2.1.4 Mode IV
This operation mode also belongs to the emergency condition in which the system forms an islanded microgrid because of faults. Fault current may trigger the protection switch (BG) depending on the severity of transient disturbances. In practice, the system should take about at least 0.2 s to completely form an island when transient disturbance is detected [19]. In some situations, the PV/BES network is intentionally disconnected for maintenance purposes. For such cases, allocating some amount of BES capacity or reserve during regulation service of mode II is critical. For example, a minimum of 10% of BES capacity for emergency cases is equivalent to 0.030 MWh, which is enough to feed loads of 0.12 MW in around 15 min when the system accidentally changes to mode IV. In mode IV, BES works in single master operation (SMO) [10] to regulate the frequency/ voltage at the required level. Based on the SMO operating concept, VSC2 is used as a voltage reference when the system isolates (disconnect BG) from the utility grid so that VSC1 can continuously operate in the conventional PQ mode. Therefore, control mode transition between grid-connected mode to islanded mode and vice versa at the outer control loop of VSC2 allows the BES system to either work in PQ or frequency/voltage control modes depending on operational states. During islanded operation, BES contributes to power sharing between sources and loads to sustain the microgrid frequency as
PBES,ref=PL-PPV (3)
The PQ mode control scheme for VSCs is well described in Refs. [17-18]. Therefore, it is not shown in Fig. 1 (for VSC1).
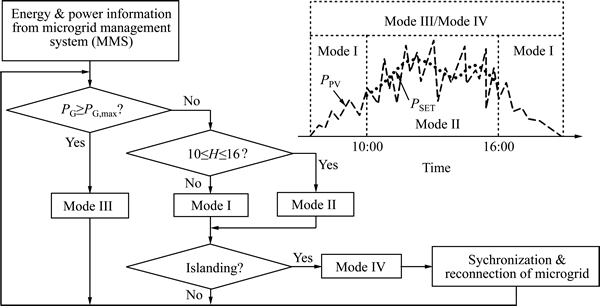
Fig. 2 Coordinated control algorithm with an illustration of area of operation modes
2.2 Control of voltage-sourced converter
VSC2 operates in PQ mode with SOC-FB control in grid-connected conditions. The BES d-axis current component is derived from PBES,ref , which is the output of the SOC-FB controller. Figure 3 shows the control block diagram of the SOC-FB control scheme included in the outer control loop of the VSC2 [3].
The SOC-FB controller regulates the SOC at an appropriate level while ensuring that operational constraints such as charge/discharge current and BESterminal voltage do not exceed their specified range [9]. Figure 3 shows that the remaining energy level (REL) is the feedback signal in p.u., which is defined as
LREL=CBES-��PBESdt (4)
where CBES is the BES capacity. The SOC is controlled while LREL variation is maintained at the desired range. LREL variation depends on the control parameters, namely, the SOC time constant, TSOC, and the SOC margin rate denoted by M. The ����TSOC-fold waveform is applied to the PSET signal so that the BES output can be adjusted to the discharging direction when REL is at its high level and vice versa when REL is at its lower level. �� is the coefficient, which is defined as follows:
��=CBES(1-2M)/(TSOC��PPV,rated) (5)
where PPV,rated is the rated capacity of the PV farm.
The offset signal specifies the percentage of BES energy in p.u. to be used for regulation. The output from the SOC-FB controller provides the BES reference power in which the current reference component of the d-axis can be derived as
Id,ref1=2PBES,ref/3Vsd (6)
where Vsd is the d-axis component of BES terminal voltage at the PCC.
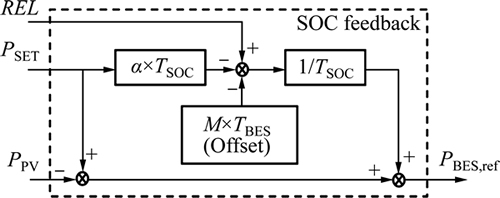
Fig. 3 SOC-FB control scheme for BES
For the q-axis current component, the outer control loop regulates the PCC voltage VPCC. A low-pass filter is used to generate the reference signal VPCC,ref, which is then compared with VPCC. Afterwards, the PI controller processes the error, which generates the q-axis reference current component Iq,ref1. Figure 4 shows the control block diagram for generating Id,ref1 and Iq,ref1, respectively, at the outer control loop during grid-connected operation.
During emergency conditions or forced islanding for maintenance purposes, the system transfers to microgrid islanded operation or, in this case, mode IV. The control objective of VSC2 is to regulate the microgrid PCC frequency/voltage at the desired level. Power sharing at PCC is achieved in this state because VSC2 operates at a four-quadrant frame in which powers P or Q are exported or imported depending on the needs of the system. Figure 5 shows the controller operation mode switching strategy within the outer control loop of Fig. 1.
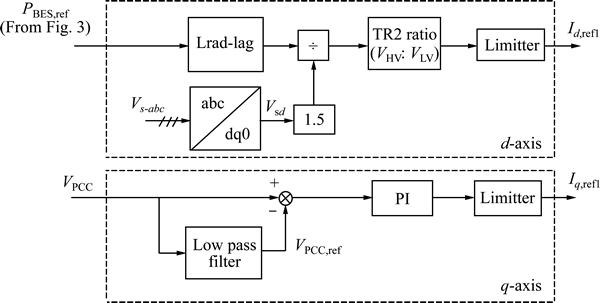
Fig. 4 Reference current generation during power smoothing
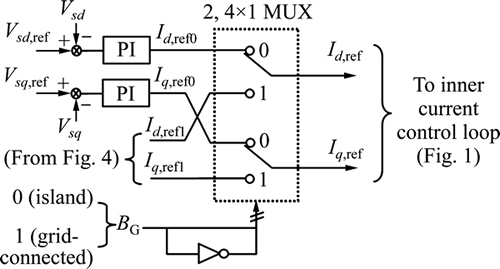
Fig. 5 VSC2 mode switching between grid-connected to islanded operation and vice versa
Figure 5 shows the switching of the system between grid-connected to islanded mode and vice versa by using the two 4��1 multiplexers. The multiplexer receives BG activation/deactivation signals from the MMS when the islanding detection scheme detects an abnormal condition. At this instant, BG signal subsequently switches the system operating frequency from phase-locked loop tracking to the nominal frequency (��0=50 Hz), which is achieved through the voltage-controlled oscillator (see Fig. 1). When the system is completely islanded, the angle ��=��0 is used for the abc-to-dq (or dq-to-abc) frame transformation. During autonomous operation, SMO operation of BES VSC2 ensures regulation of the voltage magnitude of Vs-abc in which the Vsd component is controlled by using the frequency regulation scheme [10, 12]. For a single- unit microgrid, Vsd,ref can be assigned a value equivalent to VSC2 terminal voltage (230 V) while Vsq,ref equals zero [12].
3 Modeling of BES
Several equivalent circuit models for battery storage that represent its non-linear behavior have been introduced in the literature. However, none of these models are completely accurate and applicable for a particular application [20]. Therefore, the existing model needs to be improved to account for more performance affecting factors depending on the application and availability of the test data from the manufacturer [21]. The model discussed in Ref. [22] is used, in which other necessary non-linear parameters are included to account for continuous charge/discharge performance of BES.
3.1 Dynamic model of BES
PV modeling is well described in the literature and can be found in Refs. [17-18]. Based on [22], a model of a valve-regulated lead-acid cell by Yuasa NP4-12 (12 V 4 Ah) [21] that is suitable for cyclic operations was developed. The terminal voltage Vbat of an individual 12 V cell and SOC can be calculated as functions of battery current Ibat by using the following equation:
Vbat=Ebat�CRintIbat (7)
CSOC=100[1-(��Ibatdt/Q)] (8)
where Rint is the battery internal resistance, Q is the capacity, and Ebat is the battery electromotive force defined as a function of SOC as follows:
Ebat=E0-K[(1-CSOC)/CSOC]Q+Aexp[-B(1-CSOC)Q] (9)
where E0 is the battery open circuit voltage, K is the polarization voltage, A is the exponential voltage, and B is the exponential capacity. The model parameters represented in Eq. (9) may be approximated by using the manufacturer��s data following the procedures in Ref. [22].
3.2 Improved dynamic BES model
Power smoothing by using BES requires continuous operation of VSC2 with dynamic charge/discharge characteristics of the BES model throughout a number of hours. Therefore, the BES model [22] is modified accordingly to account for non-linear effects such as terminal voltage variation, self-discharge, and battery internal impedance [9]. Investigation of the manufacturer��s test data showed that the open circuit voltage and the remaining capacity have an approximately linear relationship that is given by the following equation:
Ebat=0.01375CSOC+11.5 (10)
Rearranging Eqs. (9) and (10), the terminal voltage behavior can be described as follows:
Ebat=0.5{(E0+11.5)+[0.01375CSOC-K((1-CSOC)/CSOC)Q]+Aexp[-B(1-CSOC)Q]} (11)
The effects of self-discharge can be considered by using a variable resistance Rsd in parallel with a controlled voltage source Ebat. This resistance is given by
Rsd=- 0.039(CSOC)2+4.27CSOC-19.23 (12)
The Rsd curve parameter in Eq. (12) is obtained from the manufacturer��s data sheet by investigating the remaining battery capacity against storage time. The battery impedance value suggested by the manufacturer needs to be modified to work well with the battery model under consideration. As suggested in Ref. [22], Rint can be established by using the relationship among the nominal voltage (Vnom), nominal capacity (Qnom), and efficiency (��) as
Rint=Vnom[(1-��)/(0.2Qnom)] (13)
From the cell model, the BES may be constructed by the series, ns, and parallel, np, combinations of an individual cell, where power is assumed to be uniformly distributed among cells as
PBES=VBES��IBES=nsVbat��npIbat (14)
where ns determines the total output terminal voltage, and np characterizes the capacity or total size of a battery bank in kilowatt hours. Figure 6 shows the BES model implemented in the PSCAD/EMTDC software package. Table 1 shows the parameters for a single-cell model. Idbes is the total current command through the VSC2 terminal when considering a long-running simulation over hours of operation as in the case of SOC time constant of Eq. (8) at 3600 s (1 h) [9].
4 Simulation results and discussion
Simulation results are demonstrated for each operation mode. PPV output injected to the PCC only considers step changes in solar radiation (G) while T=25 ��C with the assumption that Malaysia has less significant temperature variations. The BES SOC time constant is set at 2700 s to demonstrate the SOC changes clearly during step charging/discharging or BES power regulation. In addition, the actual data of PPV injection from a PV system was used for mode II. Figure 7 shows 5 days of measurement data of PPV output for a 3 kWp rooftop PV system at 5 min sampling time [23]. For simulation purposes, the data was scaled to represent the impact similar to a 1 MWp PV farm.
figure 7 indicates that high output power fluctuation was observed in the afternoon. Such impact is less significant because the actual PV system capacity is small and connected to a relatively stiff electricity grid. However, fluctuations need to be smoothed out when high PV penetration, which is an MW level PV farm, is imposed on weaker power networks to make PV more dispatchable and to minimize its impacts [4, 9]. Figure 7(b) shows a zoom view of the third day measurement in which the power regulation using BES for this output data will be further discussed in Section 4.2.
4.1 Mode I
BES investment for a large-scale system entails high costs. Thus, the BES should be activated only when necessary [4] because BES lifetime depends strongly on its charge/discharge cycle. Figure 8 shows normal system operation; PPV fluctuation is less significant (i.e. H��10 a.m., H��16 p.m.) in this mode. Figure 8(a) shows the power variations from generation and loads. The figure indicates that VSC1 operates in PQ mode, where every kWh of generated energy will be fed to the local loads. Any power deviation from PV (PPV) and loads (PL) will be compensated by the grid power (PG). Hence, any surplus of PPV after feeding local loads will be delivered (sold) to the utility grid. On the other hand, when PPV generation is lower than the load demand, power from the utility grid (PG) will be consumed. In Malaysia, the energy sold by DG owners to the utility grid will receive approximately RM 1.13 (approximately $0.38 USD) per kWh [1] compared with the energy purchased at RM 0.28 (0.09 USD) per kWh. This rate is 75% cheaper. Therefore, the use of grid power to feed the local loads owned by DG owners during low renewable RE is considered economical.
Figures 8(b) and (c) show the simulation results of BES power and SOC, respectively, that result from step discharging (at 0.5 s) and charging (from 2 s) at 1��C ampere rate. For a 0.3 MWh BES (VBES=0.6 kV), this rate is equivalent to a maximum of ��500 A current charged/discharged through the power converter (VSC2). The current is limited to protect BES from breakdown and to comply with VSC2 ratings. Figure 8(b) shows that PBES tracks the PBES,ref command from the MMS depending on the SOC states. BES is then allowed to put its capacity (SOC) on standby before mode II is activated at 10 a.m. Figure 8(c) clearly shows that the battery capacity decreases as charging and discharging proceeds because more losses are accounted for in the BES model.
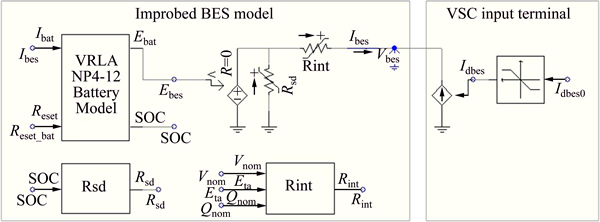
Fig. 6 BES model developed in PSCAD/EMTDC
Table 1 12 V 4 Ah battery model parameters
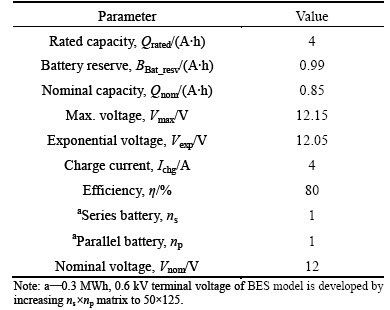
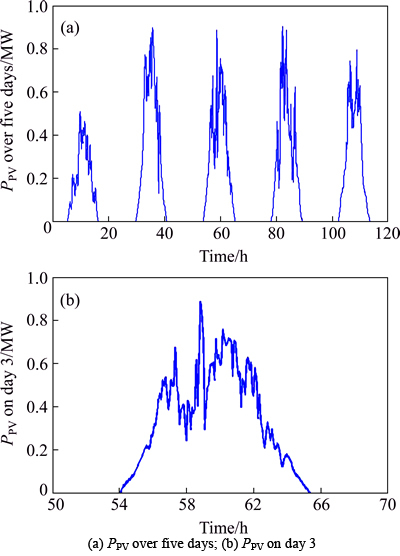
Fig. 7 Measured data of PPV injected to utility grid for case of 1 MWp system:
4.2 Mode II
Figure 9 demonstrates BES controller mode transition from mode I to mode II, and vice versa. Figure 9(a) shows that PSET signal is obtained by using a low-pass filter applied to PPV during mode II, which means that it takes the average value of moving PPV signal [3]. System loads are all switched off to clearly demonstrate PSET tracking by the PV/BES system. Figure 9(b) shows PSET tracking results of the PV/BES system during mode II, which injects a smoothed total output power to the PCC or grid (PG).
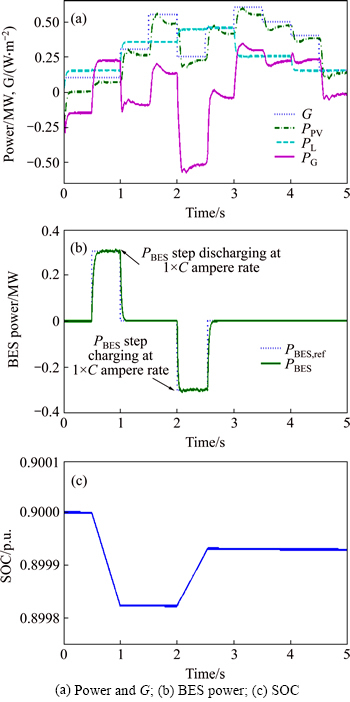
Fig. 8 Mode I simulation results under PPV and PL variations:
Figure 9(b) shows that at 0.5 s, step discharging of BES is applied to VSC2, which then sets the BES at standby SOC at 0.8 s. Subsequently, at 1 s (assumed H=10 a.m.) mode II is activated in which the BES outer loop controller tracks changes in PBES,ref that comes from the SOC-FB control scheme. PBES,ref tracking results in BES power charging/discharging according to power deviation between PSET and PPV, which results in a total smoothed output power (PG) delivered to the utility grid. At 4 s (assumed H=4 p.m.), transition from mode II to mode I occurred, which deactivated the PSET tracking and reset the system to normal operation. Figure 9(c) shows SOC variation during BES regulation service over 4 s of simulation in mode II.
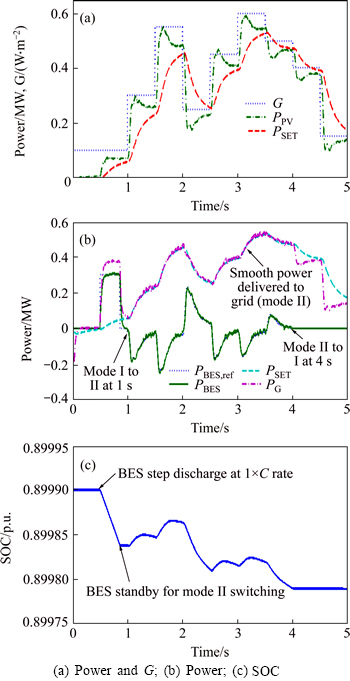
Fig. 9 Mode II simulation results that demonstrate PSET tracking of PV/BES system:
The BES model shown in Fig. 6 is used to validate the SOC-FB control scheme during BES regulation service. Idbes in Figure 6 is the d-axis active current component, which is derived from the commanded PBES,ref . VSC switching is neglected to consider the slow time constant of the BES model (at 3600 s). Thus, Idbes is assumed as the VSC2 terminal current, which is passed to a gain block of 0.97 to represent 3% VCS converter loss [9]. The current signal is also limited to charge/discharge the BES at ��1��C rate to ensure safe operation of BES and VSC2 ratings. Figure 10 shows simulation results carried out over one day (from 7 a.m. to 7 p.m.) by using actual PPV data of day 3, as shown in Fig. 7. Figure 10(a) shows that PSET is activated at 10 a.m. (mode switching from I to II), in which BES compensates for power deviation from PPV to PSET so that smoothed power [PG in Fig. 10(b)] is delivered tothe utility grid. Power regulation ends at 4 p.m.. when PSET is deactivated to transfer the operation into mode I.
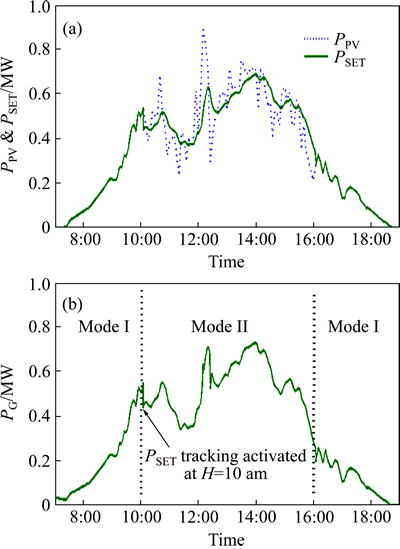
Fig. 10 Power smoothing results by using actual PPV data of day 3 in Fig. 7
Figure 11 shows the BES power, voltage, and SOC measured over one day of regulation service, as shown in Fig. 10. Meanwhile, Fig. 11(a) shows that the PBES charge/discharge cycle per day is measured around 12 cycles. This value is useful when estimating BES cyclic service life or when a microcycle analysis is conducted to further calculate the BES investment cost [9]. Figure 11(b) shows that the SOC and VBES are regulated without violating operational constraints. SOC regulation at approximately 50% of its capacity with a minimum value that does not exceed 0.3 p.u. is an example. This capacity is optimum to ensure that at least 10% of BES capacity is reserved for emergency purposes (mode IV). When considering discharge rate at 1��C amperes, the minimum allowable voltage (cut-off) for nominal voltage of 0.6 kV BES is approximately 0.465 kV to prevent the battery from breaking down [21].
4.3 Mode III
Congestion of transmission lines, instability of the interconnected system, and increased voltage are negative impacts of high-penetration PV sources. The increased voltage subsequently triggers protection switches [19]. In this case, PG should not exceed the specified PG,max, especially in the morning when high PV generation occurs during low loads. Figure 12 shows the simulation results when the PV/BES system switches tomode III. From the figure, PPV injected to the PCC is assumed to be the same as the cases in modes I and II, while PL is set to low where only 0.1 MW load is switched in over 5 s of simulation. Figure 12(a) compares the cases with and without mode III, while Fig. 12(b) shows the signal sent to the MPPT controller. In the two cases, the access power is delivered to the utility grid at 1.6 s and 3.05 s, respectively, without congestion management. However, when mode III is in effect, off-MPPT operation minimizes the impact, with peak values of PG being kept below 0.45 MW (PG,max).
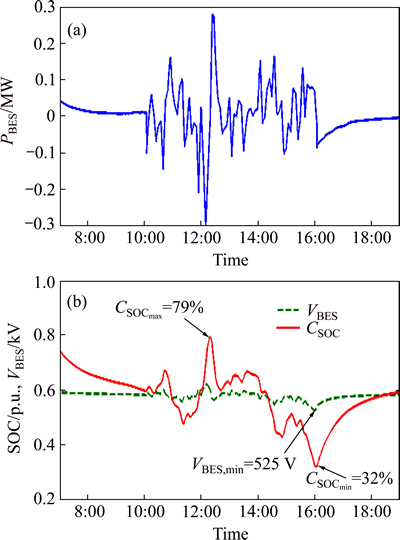
Fig. 11 BES power, terminal voltage, and SOC during regulation service of mode II
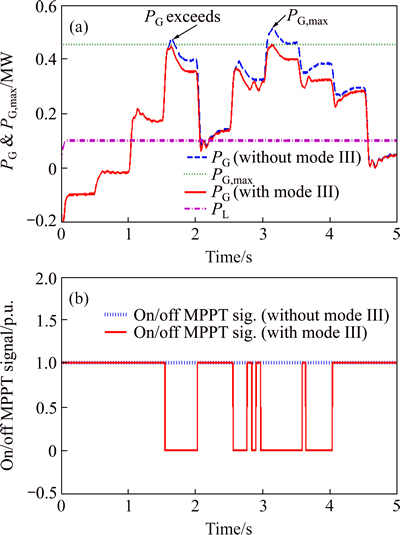
Fig. 12 Mode III simulation results that demonstrate on/off MPPT during high generation (PG��PG,max)
4.4 Mode IV
Figure 13 shows the simulation results of islanded operation, in which the islanding model detects an abnormal condition and the system forms a microgrid. When the system is isolated from the upstream grid, power sharing among PPV, PBES, and PL enables frequency/voltage regulation at the desired level.
Figure 13(a) shows that at 0.5 s, step discharging of BES demonstrated PBES,ref tracking, which represents the situation of modes I and II. At 1.5 s, the PV/BES system switches to mode IV by isolating BG. Thus, the system is no longer supported by the external grid. At this instant, BES absorbed the access power because PPV is greater than PL. In contrast, PPV suddenly drops lower than PL at 2 s where BES discharges to support loads. At 2.5 s, the system synchronizes with the utility grid, and reconnection of BG occurs. The system then switches back to the pre-islanded operation (either mode I or II).
Figure 14 shows the PCC voltage during islanding and prior to microgrid reconnection. During islanded operation, the frequency is maintained at approximately 50.3 Hz post-islanding and 49.6 Hz prior to reconnection to the external grid. The voltage is also maintained at the desired level (11 kV rms) with a deviation of around 0.45% when PPV exceeds the load level and approximately -2.7% (drop) when PPV is below the system loads.
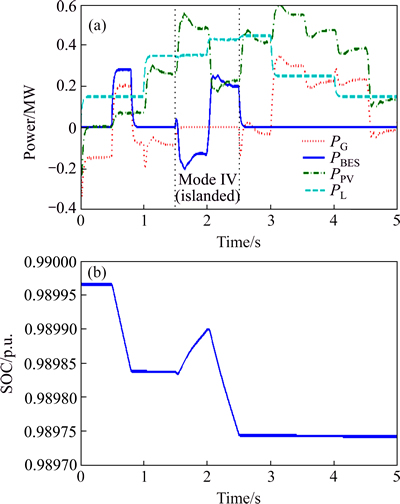
Fig. 13 Mode IV simulation results demonstrating islanded operation and power sharing among sources, loads, and storage
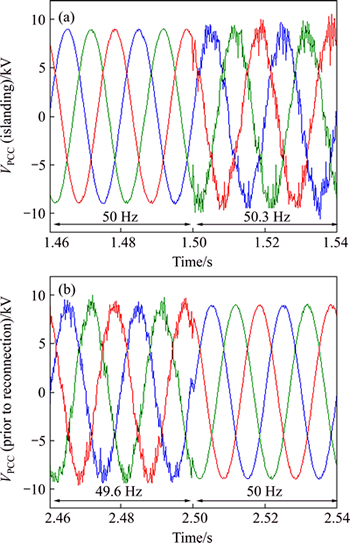
Fig. 14 PCC voltage and frequency during post-islanding (a) and prior to microgrid reconnection (b)
5 Conclusions
1) Different operation modes that consider normal or high-power fluctuations and emergency cases provide multi-functional benefits of BES installation without compromising the safety and efficient performance of the BES, thereby making large-scale BES investment more economically feasible.
2) During grid-connected conditions, the fluctuated output of PV farm is mitigated by charging/discharging the BES according to power deviations between the smoothed power set point and the PV output power.
3) During islanded operation, BES contributes to power sharing between PV source and loads within a microgrid, which regulates the frequency and voltage at the desired level.
4) The SOC-FB control scheme works effectively, as it ensures that the BES capacity is regulated at the appropriate level between 32% and 79% for safety purposes.
References
[1] SEDA. Sustainable Energy Development Authority (SEDA) Malaysia [EB/OL]. [2013-02-08]. http://www.seda.gov.my.
[2] WALID A O, KAZERANI M, SALAMA M M A. Investigation of methods for reducing of power fluctuations generated from large grid-connected photovoltaic systems [J]. IEEE Transactions on Energy Conversion, 2011, 26(1): 318-327.
[3] KATSUHISA Y, TOSHIYA N, GENTARO K, YOSHIHISA U. New control method for regulating state-of-charge of a battery in hybrid wind power/battery energy storage system [C]// IEEE Power Engineering Conference and Exposition. 2006, 1244-51.
[4] RYOICHI H, HIROYUKI K, TAKAYUKI T, HIROYUKI S, AKIRA K, SHUYA M. Testing the technologies-demonstration grid connected photovoltac projects in japan [J]. IEEE Power and Energy Magazine, 2009, 7(3): 77-85.
[5] TELEKE S, BARAN M E, HUANG A Q, BHATTACHARYA S, ANDERSON L. Control strategies for battery energy storage for wind farm dispatching [J]. IEEE Transactions on Energy Conversion, 2009, 24(3): 725-732.
[6] TELEKE S, BARAN M E, BATTACHARYA S, HUANG A Q. Rule-based control of battery energy storage for dispatching intermittent renewable sources [J]. IEEE Transactions on Sustainable Energy, 2010, 1(3): 117-124.
[7] HAN C, HUANG A Q, BARAN M E, BATTACHARYA S, WAYNE L, LOREN A. STATCOM impact study on the integration of a large wind farm into a weak loop power system [J]. IEEE Transactions on Energy Conversion, 2008, 23(1): 226-233.
[8] EGHTEDARPOUR N, FARJAH E. Control strategy for distributed integration of photovoltaic and energy storage systems in DC microgrid [J]. Renewable Energy, 2012, 45(1): 96-110.
[9] DAUD M Z, MOHAMED A, HANNAN M A. An improved control method of battery energy storage system for hourly dispatch of photovoltaic power sources [J]. Energy Conversion and Management, 2013, 73(1): 256-270.
[10] LOPES J A P, MOREIRA C L, MADUREIRA A G. Defining control strategies for microgrid islanded operation [J]. IEEE Transactions on Power Delivery, 2006, 21(2): 916-924.
[11] XU Lie, CHEN Dong. Control and operation of a DC microgrid with variable generation and energy storage [J]. IEEE Transactions on Power Delivery, 2011, 26(4): 2513-2522.
[12] ZAMANI M A, YAZDANI A, TARLOCHAN A S. A control strategy for enhanced operation of inverter-based microgrids under transient disturbances and network faults [J]. IEEE Transactions on Power Delivery, 2012, 27(4): 1737-1747.
[13] KIM Jong-yul, JEON Jin-hong, KIM Seul-ki, CHO Chang-hee, PARK June-ho, KIM Hak-man. Cooperative control strategy of energy storage system and microsources for stabilizing the microgrid during islanded operation [J]. IEEE Transactions on Power Delivery, 2010, 25(12): 3037-3048.
[14] LIU Xiong, WANG Peng, LOH Poh-chiang. A hybrid AC/DC microgrid and its coordination control [J]. IEEE Transactions on Smart Grid, 2011, 2(2): 278-286.
[15] TAN K T, SO P L, CHU Y C, CHEN M Z Q. Coordinated control and energy management of distributed generation inverters in a microgrid [J]. IEEE Transactions on Power Delivery, 2013, 28(2): 704-713.
[16] STRUNZ K. Benchmark systems for network integration of renewable and distributed energy resources [R]. Cigre Task Force C60402, 2009.
[17] YAZDANI A, DI FAZIO A R, GHODDAMI H, RUSSO M, KAZERANI M, JATSKEVICH J, STRUNZ K, LEVA S, MARTINEZ J A. Modeling guidelines and a benchmark for power system simulation studies of three phase single stage photovoltaic systems [J]. IEEE Transactions on Power Delivery, 2011, 26(2): 1247-1264.
[18] DAUD M Z, MOHAMED A, CHE WANIK M Z, HANNAN M A. Performance evaluation of grid-connected photovoltaic system with battery energy storage [C]// IEEE International Conference on Power and Energy (PECon). Kota Kinabalu, Malaysia: IEEE, 2012: 396-401.
[19] AZIT A H, SULAIMAN S, HUSSEIN Z F, BALAKHRISNAN M, BUSRAH A M, DEVARAJU P, MOHAMED A A S, KUMARAN R V, RAMASAMI A, ISMAIL M S, PATMAN M R, MOHAN K. TNB technical guidebook on grid-interconnection of photovoltaic power generation system to LV and MV networks [R]. Tenaga Nasional Berhad, 2013.
[20] DAUD M Z, MOHAMED A, HANNAN M A. A review of the integration of Energy Storage Systems (ESS) for utility grid support [J].  Elektrotechniczny (Electrical Review), 2012, 10a/2012: 185-191.
[21] Yuasa. Yuasa NP valve regulated lead-acid battery manual [EB/OL]. [2012-02-29]. http://www.yuasaeurope.com/en-gb/industrial/ products/np/.
[22] TREMBLAY O, DESSAINT L A, DEKKICHE A I. A generic battery model for the dynamic simulation of hybrid electric vehicles [C]// Proceedings IEEE Vehicle Power and Propulsion Conference (VPPC 2007). Arlington, TX: IEEE, 2007: 284-289.
[23] GHANI Z A, HANNAN M A, MOHAMED A. Simulation model linked PV inverter implementation utilizing dSPACE DS1104 controller [J]. Energy and Buildings, 2013, 57: 65-73.
(Edited by DENG L��-xiang)
Received date: 2015-03-10; Accepted date: 2015-06-11
Corresponding author: DAUD Muhamad Zalani, PhD; Tel: +60-96683414; E-mail: zalani@umt.edu.my

