J. Cent. South Univ. Technol. (2010) 17: 1049-1057
DOI: 10.1007/s11771-010-0597-y

Clustering-driven watershed adaptive segmentation of bubble image
ZHOU Kai-jun(周开军)1, 2, YANG Chun-hua(阳春华)1, GUI Wei-hua(桂卫华)1, XU Can-hui(许灿辉)1
1. School of Information Science and Engineering, Central South University, Changsha 410083, China;
2. School of Computer and Electronic Engineering, Hunan University of Commerce, Changsha 401201, China
? Central South University Press and Springer-Verlag Berlin Heidelberg 2010
Abstract: In order to extract froth morphological feature, a bubble image adaptive segmentation method was proposed. Considering the image’s low contrast and weak froth edges, froth image was coarsely segmented by using fuzzy c means (FCM) algorithm. Through the attributes of size and shape pattern spectrum, the optimal morphological structuring element was determined. According to the optimal parameters, some image noises were removed with an improved area opening and closing by reconstruction operation, which consist of image regional markers, and the bubbles were finely separated from each other by watershed transform. The experimental results show that the structural element can be determined adaptively by shape and size pattern spectrum, and the froth image is segmented accurately. Compared with other froth image segmentation method, the proposed method achieves much high accuracy, based on which, the bubble size and shape features are extracted effectively.
Key words: flotation; froth image; adaptive segmentation; pattern spectrum; morphological feature
1 Introduction
Flotation froth appearance characters are strongly related to product performance in mineral flotation process, which provides important information for flotation process control. Generally, plant operators inspect the state of the froth visually, taking into account such parameters as bubble size and shape. Based on the state of the froth, the operator might make changes to one or more the operating conditions in order to achieve optimal performance. However, these subjective inspections are dependent on human operator’s various interpretation of the process performance at certain time. In principle these parameters can be extracted by a computer vision approach.
Froth image segmentation is the most critical step to achieve a robust high throughput system that is able to segment thousands of froth images without manual interaction [1-2]. Errors in segmentation process may propagate to the feature extraction. Unfortunately, in most actual industry cases the froth images are difficult to segment. The reasons lie in that there are thousands of bubbles in an image and the bubbles often touch each other with no void space between them. Moreover, the illumination on the bubble surface is uneven, and the edges among bubbles are normally weak, whereas obvious edges are found on the border of high light regions (referred to here as white spots) on the top of almost every bubble, and the whole image is low contrast [3]. All of these characteristics complicated the development of segmentation algorithm. Most of white spots can be detected by some traditional edge detection algorithms, but they failed to identify froth images properly. BONIFAZI et al [4] and LIN et al [5] proposed a froth segmentation method based on classical watershed algorithm, however, the result depends on extracting an appropriate marker and morphological parameters. In order to overcome these problems, WANG et al [6] presented a new froth segmentation algorithm based on valley edge tracking. In this method, the result is affected by froth type and light condition. YANG et al [7] proposed a bubble size estimation method using interfacial morphological information for mineral flotation process monitoring. In this method, bubble image is segmented by valley edge algorithm, however, this algorithm is affected by the evil illumination, and some parameters are determined by manual beforehand. Due to the hostile field environment, flotation process and light condition make the selection of optimal structural element (SE) difficult. LIN et al [8] proposed a texture spectrum method to estimate bubble size directly, however, the result will be unsatisfactory when bubble is large. Thus, most of classical methods are not able to work well in flotation froth image segmentation.
Morphological algorithms, particularly watershed algorithm, are non-linear image processing techniques that are proven to be a very powerful tool in image analysis [9], but some appropriate parameters must be set by manual operation. Especially, opening operation and connected filters [10-11] with large structural element may remove image component. Unfortunately, morphological algorithm such as watershed transform [12] cannot select structural element adaptively. Usually, the structural element can be determined through the bubble size and shape distribution by manual experience. Fuzzy c means (FCM) is a fuzzy decision clustering method and is capable of segmenting some fuzzy boundary regions [13]. Thus, froth image can be extracted roughly with FCM, on the basis of which, the bubble size can be stated. In order to segment froth image adaptively in different bubble sizes, FCM algorithm, a flexible morphological methodology based on pattern spectrum [14], connected filters, and watershed transform were combined to adaptively segment bubbles with different sizes and shapes. The number of image processing parameters to be set was also minimized in the algorithm.
2 Froth image coarse segmentation
Fig.1 shows the typical histogram of a gray scale froth image. From Fig.1, it can be seen that the pixel distribution is centralized, which means that the image is low contrast between bubble and edge. Moreover, flotation bubbles are adherent, and each bubble is not distinct from others. According to human vision and different gray levels, forth image pixel can be divided into three classes such as froth superficial, vertex and edges.

Fig.1 Gray level distribution
It is an effective means to coarsely segment froth image using FCM. The pixel among froth superficial, bubble vertex and bubble edges are classified by using FCM algorithm, which makes it convenient to separate froth pixel from edge pixel.
Since Lab space is even color reference system, and the color difference of two spots is the same as human being’s perspective. Consequently, it is necessary to transform RGB into Lab space. Supposing sample set X={x1, x2, …, xn}?Rs in Lab space, the membership matrix u={uik}c×n, 2≤c≤n, class centers C={c1, c2, …, cn}, cj?Rs, FCM divides n vectors xk (k=1, 2, …, n) into c classes, and calculates class center, which makes objective function value minimal.
Fig.2(a) shows an original image captured by an industrial camera, and the size is 1 024×768 pixel. In the clustering process, c was set as 3. Fig.2(b) shows the cluster image. From Fig.2, it can be seen that the bubble regions are segmented coarsely.

Fig.2 Froth image clustering: (a) Original froth image; (b) Coarse segmentation result
3 Parameters selection and image preprocessing
3.1 Size-shape pattern spectrum for optimal morphological parameter selection
For the sake of making bubble contour smooth and removing image noise, an area opening operation was put forward. However, selecting an optimal structuring element was necessary. The opening operation eliminated the portion that is smaller than the SE while preserving the other portion of the objects. The ability that the opening quantifies the distribution of objects is important for the definition of the pattern spectrum [14].
The notion of a connected filter in mathematical morphology describes a mapping φ:p(E)→p(E) that is increasing and idempotent. The connectivity opening operation is a single opening example and then on this basis, a number of other connected filters are defined, which work by imposing constraints on the connected components returned. Constraints are commonly expressed in the form of attribute criteria to accept or reject connected components based on some attribute measures. Attribute criteria L are put in place by means of a single opening GL. The later is defined as an operator GA:C→C, which is applied to a connected component C?C will yield C if L(C) is true, and otherwise. Obviously, GL()=. Attribute criteria are often expressed as L(C)=S(C)≥l with S(C) some real-valued attributes of C, and l an attributes of threshold.
Definition 1 A binary size granulometry is a set of operators Γr with r from the totally ordered set Λ, with the following three properties:
 (1)
(1)
for all r, s?A.
The first two properties state that Γr is of anti-extention and increasing, and the third implies idempotence. This summarizes essentially the definition of a size granulometry to a set of openings. The pattern spectrum PΓ(X) obtained by applying the size granulometry {Γr} to a binary image X is defined as
 (2)
(2)
where ξ denotes the Lebesgue measure in Rm for m=2 when area A(X) is adopted.
Definition 2 Binary attribute opening ΓΛ of a set X has an increasing criterion Λ and the shape criterion is the non-compactness criterion.
 (3)
(3)
where I(C) denotes the moment of inertia and A(C) denotes the area of component C.
Attribute connected operators may also be based on shape criteria. They are generally non-increasing operators that are scale, rotation and translation invariant. A shape operator that is also idempotent defines a shape filter. Shape operators that are insensitive to size information are also used to define granulometries. This requires omitting the second property of definition 1 and instead includes a condition ensuring scale invariance as follows:
 >0 (4)
Thus, a shape granulometry consists of operators Φ that are anti-extensive, idempotent and scale-invariant. Furthermore, shape pattern spectra can be defined analogously in a way to size pattern spectra.
Increasing connected filters extends to gray-scale mainly by threshold superposition [15]. Given a gray-scale image f:E→R, threshold f in an increasing order from hmin+1 to hmax yields a stack of nested binary sets. Each binary image at level h is given by
 ≥h} (5)
and for any two levels such that h<h′:
 (6)
(6)
Given a threshold decomposition of f, the response of the gray-scale counterpart of a binary increasing filter Ψ Λ on each point x of f is given by
 (7)
(7)
Operator Ψ Λ assigns each x to the highest threshold at which it still belongs to a connected component of attribute measure that is equal to or larger than λ.
Given a gray-scale image f, a peak component Ph is a connected component of the threshold set at level h:
 ≥h}) (8)
Flat zone Fh is a connected component of the set of pixels with level equal to h:
 (9)
(9)
If peak component Ph at level h has no neighbors of intensity that are greater than h, it will be called a regional maximum.
Since the opening removes the portion smaller than the SE, the difference of the images opened by the SE of size n and size n+1 contains the portion whose size is exactly equal to n. The original image is decomposed into sets of the SE of various sizes and shapes. The normalized pattern spectrum, which is defined as the ratio of the original pattern spectrum to the sum of the pixel values over the whole original image, is often used. The spectral values of the normalized one indicate the ratio of the portions of a size to the whole image. Fig.3 shows the result of opening operation with different shape structuring elements that are ellipsoid, linear, square, and rectangular. In the experiment, the maximal size of SE is 50. From Fig.3, it can be seen that the ellipsoid is optimal shape SE. In the following, the normalized pattern spectrum is called the size and shape distribution because of the analogy between the normalized pattern spectrum and the probability distribution function, and the pattern spectrum value means the value of the size and shape distribution at each scale.
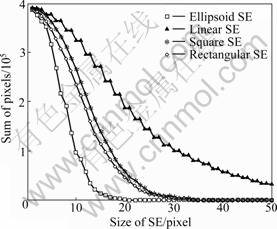
Fig.3 Opening operation with different SEs
Definition 3 For any 
 , and real number
  the size and shape distribution F(X, B, n) is defined as follows:
 (10)
(10)
Then, the average M[F(X)] and variance V[F(X)] of the size and shape distribution are defined as follows:
 (11)
(11)
 (12)
(12)
where k denotes the upper limit of sizes for the calculation of average and variance.
From this fact, the following idea can be inspired: the SE which resembles the particle best is obtained by seeking the SE that produces the pattern spectrum values whose variance is the smallest. This is achieved by repeating a slight modification of the SE and the evaluation of the size distribution. Such a procedure is equivalent to the optimization process of the SE under the criterion of the smallest variance of size distribution, and can be realized by the method known as the simulated annealing or genetic algorithm (GA). In this experiment, GA was used to yield the optimal parameter, and k=20, i. e., the range of sizes in which this value is calculated to be 0, 1, …, 20. The evaluation function is defined by the variance. Fig.4 shows the ellipsoid SE pattern spectrum of Fig.2(a), from which, the optimal size of SE is 4.
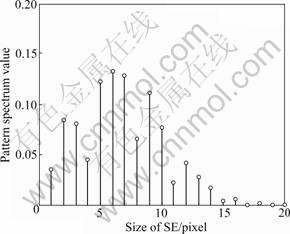
Fig.4 Ellipsoid SE pattern spectrum of Fig.2(a)
3.2 Area opening and closing by reconstruction
In most industrial cases, the froth images are captured in dust illumination environment, so all kinds of noises make image worse. Morphological opening filter can remove the noises efficiently [16], however, morphological operation cannot depend on shape characteristics, but only the size, so the boundaries are shifted. Here, “boundary” means “boundary between zones with different gray levels.” In order to remove noises and retain the boundaries and shapes, an area opening and closing operation is applied to image denoising, which can preserve the shape and size feature.
Area opening operation is an improved area filter algorithm. The operator belongs to connectivity operator category, and was provided with monotonically increasing and idempotent (ψ2=ψ) character [11]. It reconstructs the image with the filter criterion [10]. It can remove noise, whist preserve shape character. In h opening by reconstruction the marker image g: , g(p)=f(p)-h, where h is a constant; area opening by reconstruction transform: m(p)=f(p)-r(p), where r(p) is the result of reconstruction. Area closing by reconstruction can be obtained by dual operation.
Fig.5 illustrates the diagrams of gray scale reconstruction on one-dimensional signal. In Fig.5(a), input signal f denotes mask and the marker g=f-h. In Figs.5(b) and (c), the solid line represents the result. From Fig.5(c), it can be observed that area opening by reconstruction overcomes some drawbacks that morphological reconstruction (Fig.5(b)) cannot remove peak noise. Compared with area filter, area opening by

Fig.5 Gray-scale reconstruction filters on one-dimensional signal: (a) Mask f and marker g; (b) Result using morphological reconstruction; (c) Result using area opening and closing by reconstruction operation
reconstruction has an advantage that it can eliminate low gray level region.
Fig.6 shows that the noises of f are removed, and the bubble regions are smoother than clustering image, whilst the shape characters are retained.
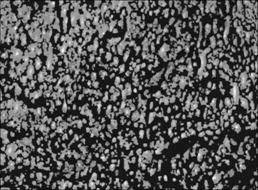
Fig.6 Area opening and closing by reconstruction
3.3 Binary segmentation
OSTU algorithm was applied to transforming gray scale image into binary image, which is based on the principle of maximum variance among clusters and selects an optimal threshold to divide a gray-scale histogram into two parts [17]. Fig.7 shows the binary image and the bubble contour is delineated. However, the segmentation result is coarse, because the adherence bubbles are not disjoint. Consequently, watershed transform is applied to finely segmenting the image.
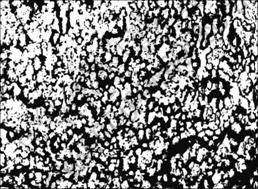
Fig.7 Binary image
4 Image fine segmentation and feature extraction
The concept of watersheds is well known in topography, which is increasingly recognized as a powerful segmentation process due to its many advantages. VINCENT and SOILLE gave simulated immersion algorithm definition [12]. In this definition, the set of the catchments basins of the gray scale image function f (with values in [hmin, hmax]) is equal to set 
Given a marker image, the watershed line can be obtained. In order to illustrate the segmentation performance, the comparison was conducted between ground truth and segmentation result. Fig.8(a) shows the marker image, and Fig.8(b) shows the segmentation result, and the ground truth image produced by an expert manual segmenting is shown in Fig.9. Comparing Fig.8(b) with Fig.9, it is observed that most of bubbles are delineated except the collapse bubble and several accumulations. The reasons lie in that the black hole generated by broken bubble cannot provide the segmentation algorithm with appropriate information, the same for accumulations. However, the quality of the segmentation results can thus be acceptable.

Fig.8 Watershed transform: (a) Marker image; (b) Segmentation result

Fig.9 Ground truth images produced by expert manual segmenting
For studying the global similarity processing, some experiments such as the simple morphological segmentation and valley edge detection algorithm with different parameters were conducted by using image in Fig.10. Images (a), (c) and (e) in Fig.10 are segmentation results by using morphological and watershed algorithm. Over segmentation will be aroused when the threshold is 1 and disk SE is selected, however, under segmentation will occur when the threshold is set to 3 or 7. The threshold was selected in terms of bubble size and shape by human experience. However, unpredictable flotation operation condition makes bubble too large or small. So, the trial threshold value will result in unreliable segmentation. Images (b), (d) and (f) in Fig.10 are segmentation results with valley edge detection, in which the result is not satisfactory, and the smaller the threshold is, the less the bubble edge can be detected. The reason lies in that some bubbles edges are high light under the effect of uneven illumination, so they are not the valley.
The reasons are: (1) the gray values vary in the interior of a bubble; and (2) the average gray values of the bubbles vary from one part to another in an image.
Instead of the similarity segmentation, when the standard edge detection algorithms are applied to froth images, the following six experimental results for Fig.2(a) will give the answer. Fig.11 shows edge detection results by using the algorithms (operators): Sobel, Robert, Laplacian, Prewitt, Canny and threshold Canny edge detection using a threshold value of 0.2. From Fig.11, it can be seen that Laplacian edge detection results are poor, and few clear edges are detected. Results of applying Sobel, Robert, Prewitt, and Canny edge detection give some part of the edges of some bubbles, but the edges are much weaker than the truth edges. Fig.11(f) shows that, when uses Canny edge detection with a threshold value of 0.2, most bubble edges will be lost. The conclusion is that these algorithms cannot be applied successfully to further bubble image segmentation, since white spots on the interior of bubbles strongly affect edge detection results, and gray levels of bubble edges are various.
Based on the segmentation image, some froth
features can be extracted. Fig.12(a) shows the bubble area distribution. From Fig.12(a), it can be seen that the froth sizes are distributed in 12 mm, and the result is accordant with human visual evaluation, however, the classic method has some errors on statistical bubble size. The bubble shape distribution is shown in Fig.12(b). The shape is defined by average aspect ratio of bubble major length to minor width. The aspect is defined as the ratio between the major axis and the minor axis of the ellipse
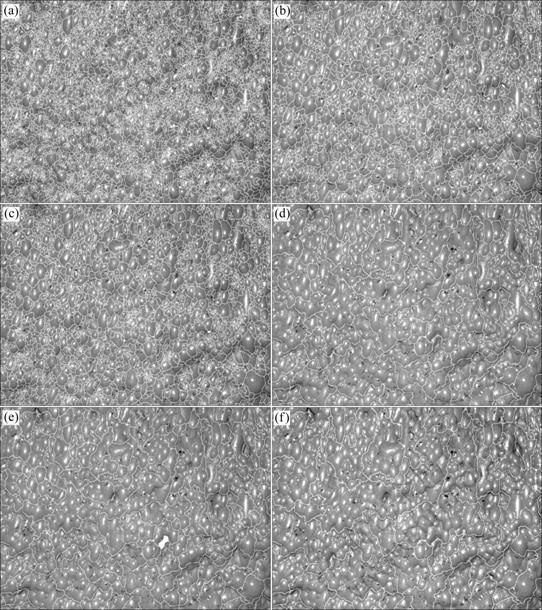
Fig.10 Segmentation results using watershed with threshold of 1(a); 3 (c); 7 (e) and valley edge with threshold of 1 (b); 2 (d); 5 (f)
equivalent to the bubble (rounded bubbles have an aspect equal to 1, while elliptical bubbles have aspect larger than 1).
The froth morphological features can serve flotation process with a degree of comparable accuracy in qualitative terms, and even higher in quantitative terms, by human expert experience.
5 Conclusions
(1) A new image segmentation method of flotation forth based on FCM and morphology is proposed. This method is robust and accurate. Bubble morphological parameters can be extracted. The problem that the foreground is difficult to extract from background of froth image is solved by using FCM algorithm, which yields some prior information for watershed. Through some morphologic definitions, the shape and size pattern spectra are obtained, furthermore, an optimal structuring element is determined.
(2) Based on morphological reconstruction, an area opening by reconstruction is applied to providing marker for watershed algorithm, which solves the over segmentation or under segmentation problems. The experiments show that the proposed method is robust for image segmentation and can overcome some drawbacks of classical algorithm.
(3) The adopted segmentation approach can be profitably used to characterize flotation froth and provide quantitative data support for floatation process control.
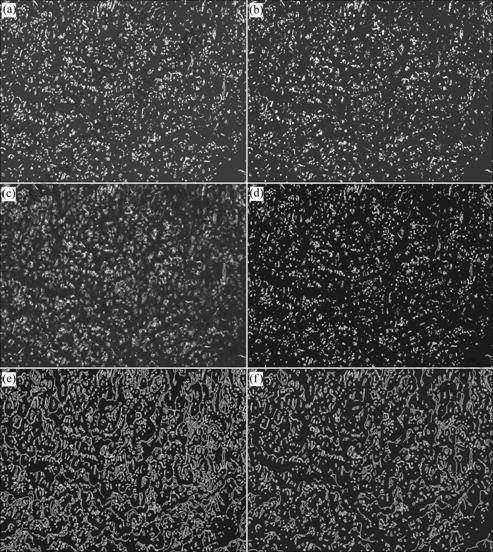
Fig.11 Edge detection results with classical methods: (a) Sobel; (b) Robert; (c) Laplacian; (d) Prewitt; (e) Canny and (f) threshold Canny edge detection with threshold value of 0.2
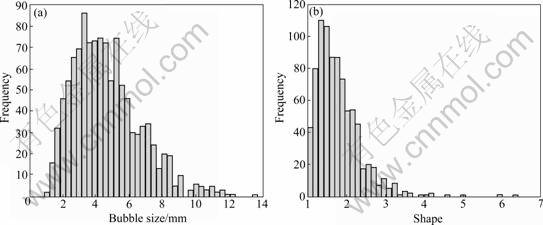
Fig.12 Feature extraction results: (a) Froth size distribution; (b) Shape distribution
References
[1] KAARTINEN J, HATONEN J. Machine vision based control of zinc flotation―A case study [J]. Control Engineering Practice, 2006, 14(12): 1455-1466.
[2] YANG Chun-hua, YANG Jin-ying, MU Xue-min, ZHOU Kai-jun, GUI Wei-hua. A segmentation method based on clustering pre-segmentation and high-low scale distance reconstruction for colour froth image [J]. Journal of Electronics & Information Technology, 2008, 30(6): 1286-1290. (in Chinese)
[3] YANG Chun-hua, XU Can-hui, GUI Wei-hua, ZHOU Kai-jun. Application of highlight removal and multivariate image analysis to color measurement of flotation bubble images [J]. International Journal of Imaging Systems and Technology, 2009, 19(4): 316-322.
[4] BONIFAZI G, SERRANTI S, VOLPE F, ZUCO R. Characterisation of flotation froth colour and structure by machine vision [J]. Computers & Geosciences, 2001, 27(9): 1111-1117.
[5] LIN Xiao-zu, GU Ying-ying, ZHAO Guo-qing. Feature extraction based on image segmentation of coal flotation froth [J]. Journal of the China Coal Society, 2007, 32(3): 304-308. (in Chinese)
[6] WANG W X, BERGHOLM F, YANG B. Froth delineation based on image classification [J]. Mineral Engineering, 2003, 16(11): 1183- 1192.
[7] YANG Chun-hua, XU Can-hui, MU Xue-min, ZHOU Kai-jun. Bubble size estimation using interfacial morphological information for mineral flotation process monitoring [J]. Transactions of Nonferrous Metals Society of China, 2009, 19(3): 694-699.
[8] LIN B, RECKE B, KNUDSEN J K H, JORGENSEN S B. Bubble size estimation for flotation processes [J]. Minerals Engineering, 2008, 21(7): 539-548.
[9] MEIJSTER A, WILKINSON M H F. A comparison of algorithms for connected set openings and closings [J]. IEEE Transactions on Pattern Analysis and Machine Intelligence, 2002, 24(4): 484-494.
[10] WILKINSON M H F, WESTENBERG M A. Shape preserving filament enhancement filtering [C]// Proceedings of the 4th International Conference on Medical Image Computing and Computer Aided Intervention. Utrecht: IEEE Press, 2001: 770-777.
[11] BRAGA-NETO U, GOUTSIAS J. Object-based image analysis using multiscale connectivity [J]. IEEE Transactions on Pattern Analysis and Machine Intelligence, 2005, 27(6): 892-907.
[12] HAMARNEH G, LI X X. Watershed segmentation using prior shape and appearance knowledge [J]. Image and Vision Computing, 2009, 27(1/2): 59-68.
[13] ZHOU Xian-cheng, SHEN Qun-tai, LIU Li-mei. New two-dimensional fuzzy C-means clustering algorithm for image segmentation [J]. Journal of Central South University of Technology, 2008, 15(6): 882-887.
[14] URBACH E R, ROERDINK J B T M, WILKINSON M H F. Connected shape-size pattern spectra for rotation and scale invariant classification of gray scale images [J]. IEEE Transactions on Pattern Analysis and Machine Intelligence, 2007, 29(2): 272-285.
[15] SERRA J. A lattice approach to image segmentation [J]. Journal of Mathematical Imaging and Vision, 2006, 24(1): 83-130.
[16] SALEMBIER P, SERRA J. Flat zones filtering connected operators and filters by reconstruction [J]. IEEE Transactions on Image Processing, 1995, 4(8): 1153-1160.
[17] NG H F. Automatic thresholding for defect detection [J]. Pattern Recognition Letters, 2006, 27(14): 1644-1649.
(Edited by LIU Hua-sen)
Foundation item: Projects(60634020, 60874069) supported by the National Natural Science Foundation of China; Project(2009AA04Z137) supported by the National High-Tech Research and Development Program of China
Received date: 2009-12-16; Accepted date: 2010-03-29
Corresponding author: YANG Chun-hua, Professor; Tel: +86-731-88836876; E-mail: ychh@mail.csu.edu.cn

