Numerical simulation research on response characteristics of surrounding rock for deep super-large section chamber under dynamic and static combined loading condition
��Դ�ڿ������ϴ�ѧѧ��(Ӣ�İ�)2020���12��
�������ߣ���ѧ�� ����Դ ̷���� ������ ������ ����
����ҳ�룺3544 - 3566
Key words��deep mining; super-larger section chamber; static load; dynamic load frequency; dynamic load amplitude; dynamic load source distance
Abstract: The stability control of surrounding rock for large or super-large section chamber is a difficult technical problem in deep mining condition. Based on the in-site geological conditions of Longgu coal mine, this paper used the dynamic module of FLAC3D to study the response characteristics of deep super-large section chamber under dynamic and static combined loading condition. Results showed that under the static loading condition, the maximum vertical stress, deformation and failure range are large, where the stress concentration coefficient is 1.64. The maximum roof-to-floor and two-sides deformations are 54.6 mm and 53.1 mm, respectively. Then, under the dynamic and static combined loading condition: (1) The influence of dynamic load frequency on the two-sides is more obvious; (2) The dynamic load amplitude has the greatest influence on the stress concentration degree, and the plastic failure tends to develop to the deeper; (3) With the dynamic load source distance increase, the response of surrounding rock is gradually attenuated. On this basis, empirical equations for each dynamic load conditions were obtained by using regression analysis method, and all correlation coefficients are greater than 0.99. This research provided reference for the supporting design of deep super-large section chamber under same or similar conditions.
Cite this article as: FAN De-yuan, LIU Xue-sheng, TAN Yun-liang, SONG Shi-lin, NING Jian-guo, MA Qing. Numerical simulation research on response characteristics of surrounding rock for deep super-large section chamber under dynamic and static combined loading condition [J]. Journal of Central South University, 2020, 27(12): 3544-3566. DOI: https://doi.org/10.1007/s11771-020-4509-5.

J. Cent. South Univ. (2020) 27: 3544-3566
DOI: https://doi.org/10.1007/s11771-020-4509-5

FAN De-yuan(����Դ)1, LIU Xue-sheng(��ѧ��)1, 2, 3, TAN Yun-liang(̷����)1, 2,
SONG Shi-lin(������)1, NING Jian-guo(������)1, 2, MA Qing(����)1
1. School of Energy and Mining Engineering, Shandong University of Science and Technology, Qingdao 266590, China;
2. State Key Laboratory of Mining Disaster Prevention and Control, Shandong University of Science and Technology, Qingdao 266590, China;
3. State Key Laboratory of Water Resource Protection and Utilization in Coal Mining, China Energy Group Co., Ltd., Beijing 100011, China
 Central South University Press and Springer-Verlag GmbH Germany, part of Springer Nature 2020
Abstract: The stability control of surrounding rock for large or super-large section chamber is a difficult technical problem in deep mining condition. Based on the in-site geological conditions of Longgu coal mine, this paper used the dynamic module of FLAC3D to study the response characteristics of deep super-large section chamber under dynamic and static combined loading condition. Results showed that under the static loading condition, the maximum vertical stress, deformation and failure range are large, where the stress concentration coefficient is 1.64. The maximum roof-to-floor and two-sides deformations are 54.6 mm and 53.1 mm, respectively. Then, under the dynamic and static combined loading condition: (1) The influence of dynamic load frequency on the two-sides is more obvious; (2) The dynamic load amplitude has the greatest influence on the stress concentration degree, and the plastic failure tends to develop to the deeper; (3) With the dynamic load source distance increase, the response of surrounding rock is gradually attenuated. On this basis, empirical equations for each dynamic load conditions were obtained by using regression analysis method, and all correlation coefficients are greater than 0.99. This research provided reference for the supporting design of deep super-large section chamber under same or similar conditions.
Key words: deep mining; super-larger section chamber; static load; dynamic load frequency; dynamic load amplitude; dynamic load source distance
Cite this article as: FAN De-yuan, LIU Xue-sheng, TAN Yun-liang, SONG Shi-lin, NING Jian-guo, MA Qing. Numerical simulation research on response characteristics of surrounding rock for deep super-large section chamber under dynamic and static combined loading condition [J]. Journal of Central South University, 2020, 27(12): 3544-3566. DOI: https://doi.org/10.1007/s11771-020-4509-5.
1 Introduction
In China, the coal resources are in high- intensity mining for a long time, the shallow coal resources are gradually exhausted, and the coal mining is gradually transferred to the deep [1-5]. In recent years, more and more large and super-large section chambers or chambers groups appear with the development of domestic coal mining to the direction of large-scale, mechanization and intelligence [6-10]. Under the condition of high stress and super-large section, the deformation and failure of the surrounding rock are particularly serious, roof falling, floor heaving, rib spalling, and other accidents occur frequently, which is significantly difficult to control. The reasons are mainly from the following three aspects: 1) The frequency, intensity and complexity of dynamic disturbance and failure phenomena such as blasting and rockburst increase significantly in deep mining [11, 12]; 2) The mechanical and engineering properties of coal and rock have changed greatly in the complex environment of ��three highs and one disturbance�� [13-18]; 3) The super-large section chamber is greatly affected by its own size effect [19], the deformation and failure process of surrounding rock usually takes a long time to converge and stabilize, and it is very easy to be affected by the surrounding stress environment [20, 21]. Therefore, as a major technical problem, the stability control of the surrounding rock for deep super-large section chamber under the dynamic load disturbance seriously restricts the safe and efficient mining of coal resources.
In recent years, domestic and foreign scholars have carried out some researches on the deformation and failure evolution of surrounding rock under the deep dynamic load condition. In the aspect of theoretical analysis, based on the elasticity theory, LIU et al [22] deduced the calculation formula of surrounding rock stress for circular chamber under the static and dynamic loading conditions. LI et al [23] established the mechanics model for deep-buried roadway under dynamic loading condition, revealed the influence of different lateral pressure coefficients and deduced the mechanical criterion of induced rockburst. Based on the material mechanics theory, XIAO et al [24] established the mechanical model of impact instability for roadway floor, and deduced the mechanical criterion of impact instability. Based on the energy theory, LIU et al [25-27] established the mechanical model to discuss the occurrence process of rockburst induced by dynamic load, put forward its mechanism, and deduced the energy criterion for impact instability. In terms of indoor rock mechanical test, Hopkinson test device is widely used as a common means to obtain the mechanical properties of coal and rock mass under dynamic load [28, 29]. GONG et al [30] carried out one- dimensional and three-dimensional dynamic-static combined loading tests, and obtained the dynamic characteristics of sandstone under high stress and dynamic load disturbance conditions. On this basis, LIU et al [31] studied the dynamic strength, energy dissipation and fracture characteristics of coal-rock combination under dynamic and static loads, and established a catastrophe model of its failure and instability. In addition, CAI et al [32] found that fault ultra-low friction effect caused by dynamic load disturbance is the mechanical essence of fault activation dominated by mining vibration. HUO et al [33] revealed the mining pressure mechanism of the lower coal seam in the room-type goaf, and found that the instability of double-cantilever beam structure is the main reason for dynamic pressure. By using numerical simulation method, XIE et al [34] studied the dynamic response and manifestation process of roadway floor in extra thick coal seam under different lateral pressure coefficients. HAN et al [35] obtained the stress distribution of two-sides of roadway under the influence of dynamic and static loads. In view of supporting problem of roadway under dynamic load, YANG et al [36] put forward the support and pressure relief scheme on the basis of obtaining the distribution of the maximum principal stress and elastic strain energy of the surrounding rock for deep roadway. JIAO et al [37] analyzed the failure characteristics and causes of roadway surrounding rock under dynamic disturbance, and proposed multi-level control technology. WANG et al [38] studied the dynamic response for deep roadway under P wave, and determined the key supporting position of surrounding rock.
The above researches are based on a specific geological and mining conditions, revealed the deformation and failure evolution of surrounding rock for deep chamber, and obtained some valuable results. However, there is no consensus about the response of deep super-large chamber under the dynamic and static loading conditions, especially the distribution and evolution of new fracture in surrounding rock under different dynamic loading conditions. Therefore, this paper takes screening product transfer chamber of Longgu Coal Mine as research object, uses FLAC3D numerical simulation software to study its surrounding rock failure characteristics. Then, we applies different frequencies, amplitudes and distances of dynamic load to obtain the response characteristics of surrounding rock, which provides the reference for chamber stability control with similar condition.
2 Engineering overview
Longgu coal mine is located in the middle south region of Juye coalfield, Heze city, Shandong province, China. In order to meet the requirements of coal-gangue replacement and green mining, a large-scale coal gangue separation system and equipments are arranged, which can not only reduce the engineering quantity and production cost caused by gangue lifting, but also effectively protect the ecological environment of the mining field. The coal gangue separation system is mainly located in four super-large section chambers with dense distribution, which are named as: screening crushing (SC) chamber, screening product transferring (SPT) chamber, dense-medium shallow-groove separation (DSS) chamber and slime water and medium (SWM) chamber. In this paper, SPT chamber is chosen as the research object, which is arranged at 90�� horizontal crossing with SC chamber and DSS chamber respectively. The chamber is located at 3# coal seam, with an average thickness of 5.0 m and an average buried depth of 813.6 m. The roof and floor are hard rock strata such as siltstone and fine sandstone. The stratigraphic sequence of coal seam and its roof and floor strata is shown in Figure 1. The chamber length is 80.0 m, the section shape is straight wall semicircle arch, and the section width��height is 8000 mm��9000 mm. The chamber supporting method is ��bolt-mesh-cable-shotcreting��, in which the bolt is ��22 mm��2500 mm ribbed steel resin bolt, with a row spacing of 1000 mm��1000 mm. Five cables are arranged on the roof with a spacing of 1850 m; two cables are arranged on each side, the first one is 1300 mm away from the roof, the second one is 3000 mm below the first one, and the specification is ��22 mm��6300 mm. The SPT chamber location and its supporting scheme are shown in Figure 2.
During the mining and excavation of the upper coal seam, blasting, roof-cutting, and overburden fractures will affect the mining of the lower working face and the surrounding rock of chamber.
The KJ551 microseismic monitoring system was used to monitor the dynamic load near the SPT chamber. It was found that the dynamic load energy range was 1��102 J to 1��104 J, the dynamic load amplitude range was 2.21 to 15.44 MPa, and the dynamic load frequency monitoring range was 10 to 160 Hz. As shown in Figure 3, the surrounding rock of super-large section chamber has a large roof subsidence under the dynamic disturbance, and the roof falling occurred in some locations. The convergence of the two-sides is obvious, and the supporting structure is distorted or even broken, which has a serious impact on the safety and efficient of coal mining.
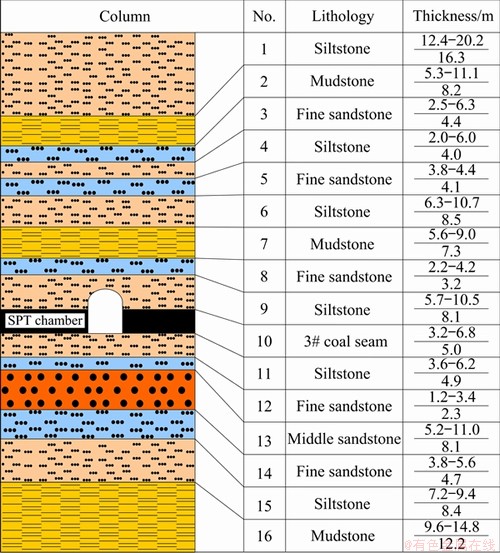
Figure 1 Stratigraphic sequence of coal seam and its roof and floor strata
3 Numerical simulation method and schemes
3.1 Rock mass properties
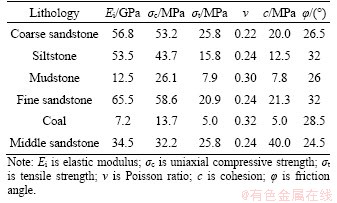
To better understand the mechanical properties of the rock mass surrounding the chamber, laboratory tests were carried out on the coal and rock samples collected from the in-site SPT chamber. According to International Society for Rock Mechanics and Rock Engineering (ISRM) [39, 40] suggested method, the tests were conducted on the RLJW-2000 microcomputer-controlled rock servo test machine, which adopts German DOLI full digital servo controller. In the test, three standard rock specimens with 50 mm��100 mm for each specific geological unit were tested. The axial load of the test machine was controlled by displacement loading, and the loading rate was 0.25 mm/min. The uniaxial compressive strength, elastic modulus and Poisson ratio were obtained by conducting uniaxial compression tests, while the cohesion and friction angle were estimated by conducting triaxial compression tests. Based on the results of these tests, the laboratory testing machine and test result of rock specimens are shown in Table 1.
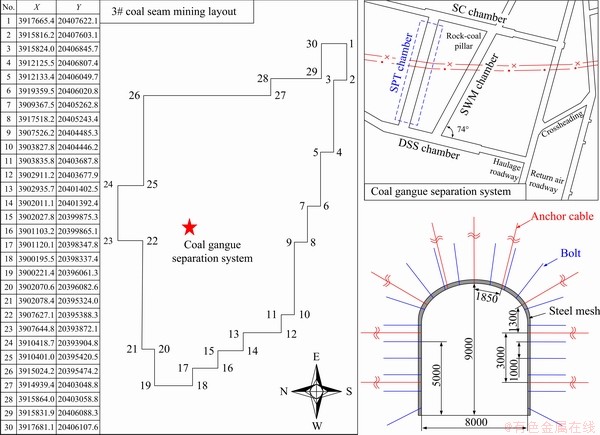
Figure 2 SPT chamber location and its supporting scheme (Unit: m)
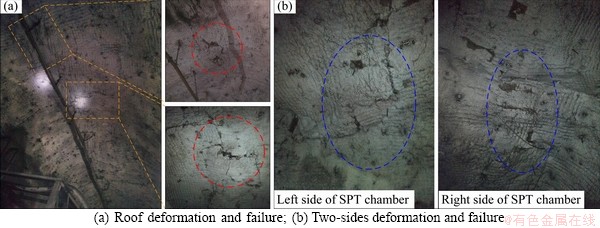
Figure 3 In-site deformation and failure of SPT chamber under dynamic load:
Table 1 Laboratory test result of rock specimens
However, the macroscopic strength of rock mass is far less than that of rock samples due to the joints, cracks and different mineral compositions in engineering rock mass. A reliable estimation of the mechanical properties of the rock masses was essential for obtaining an acceptable result from the numerical study. MOHAMMAD et al [41] suggested that numerical model stiffness is on average 0.469 of the laboratory stiffness and model uniaxial compressive strength is on average 0.284 of the laboratory strength. CAI et al [42] suggested that the elastic modulus, cohesion and tensile of coal and rock masses can be estimated at 0.1-0.25 of the laboratory testing results and the Poisson ratio can be assumed to be 1.2-1.4 of the laboratory testing results. Therefore, the mechanical properties used in the numerical simulation model have been estimated that the elastic modulus, cohesion and tensile strength is 0.2 of the laboratory testing results and the Poisson ratio is 1.2 of the laboratory testing results as shown in Table 2.
3.2 Model development
In order to study the failure evolution of surrounding rock for deep super-large section chamber under different dynamic loading conditions, based on the in-site geological conditions of the coal gangue separation system in Longgu Coal Mine, the dynamic module of FLAC3D software is used to establish the numerical model. Then the influence of dynamic load frequency, amplitude and dynamic load source distance on the stress and deformation evolution of the surrounding rock are simulated respectively. The numerical model specification is length�� width�� m��160 m��166 m, the section shape is vertical wall semi-circular arch, the chamber dimension is width��.0 m��9.0 m, which is divided into 1587584 zones and 1637910 gridpoints. Moreover, Mohr-Coulomb was selected as the constitutive model. Numerical simulation model is shown in Figure 4.
The model boundary conditions and monitoring point layout are shown in Figure 5. It can be seen from Figure 5(a) that in the static calculation process, horizontal hinge constraints are imposed on the front, rear, left, and right boundaries of the model, and the bottom boundary is fixed, the top boundary is free and bears the vertical stress corresponding to the overburden thickness. The overburden load is calculated as q=��H, which is 16.83 MPa. �� is the average bulk density, taking 2.5��104 N/m3, and H is the overburden thickness, m. It can be seen from Figure 5(b) that in the dynamic calculation process, the bottom and top boundaries adopt static field boundaries, and the free field boundaries are applied at the rest boundaries. In this way, it is beneficial to absorb incident wave energy, reduce the waves reflection on the boundary, and achieve the effect of an infinite field model. In addition, the dynamic multi-step method is used to classify the zones and gridpoints to effectively reduce the time required for dynamic calculation [43, 44].
Table 2 Mechanical properties used in numerical simulation model
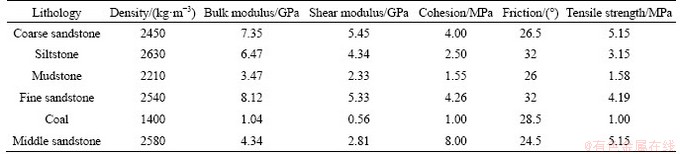
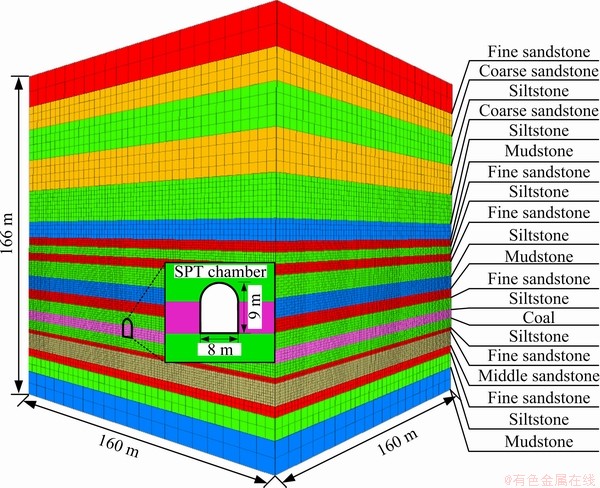
Figure 4 Numerical simulation model
Monitoring points layout: after the SPT chamber excavation, a stress measuring line is arranged at a height of 4 m above the chamber floor, in which one monitoring point is set at each 2 m interval to record the stress change during the calculation. Meanwhile, the displacement monitoring points are arranged at the center roof and floor (4 m from two-sides) and the two-sides (4 m from floor), which are used to monitor the change of surrounding rock deformation during the simulation process.
Damping setting: when FLAC3D is used for dynamic calculation, Rayleigh damping function must be introduced to reduce the natural vibration state of the system. Through the trial calculation, the minimum critical damping ratio and the minimum center frequency in this simulation are determined to be 0.4% and 250 Hz, respectively.
Dynamic load application: because there are many dynamic load sources in the coal mine, the stress wave that actually propagates to the chamber is often a complex stress wave after many times of interference and reflection, which cannot obtain its analytical expression by theoretical derivation.
According to the elastic wave theory, any complex stress wave can be obtained from several sine waves by Fourier transform, that is, sine wave is the basic form of complex stress wave in the coal mine[45-47]. Therefore, we can study the failure evolution of surrounding rock under the simple sine wave, and lay a foundation for the research to the chamber instability under the complex stress wave. Therefore, it can be assumed that the waveform function of the stress wave is shown as Eq.(1):
 (1)
(1)
where A is stress wave amplitude, MPa; f is stress wave frequency, Hz; T is stress wave action time, s.
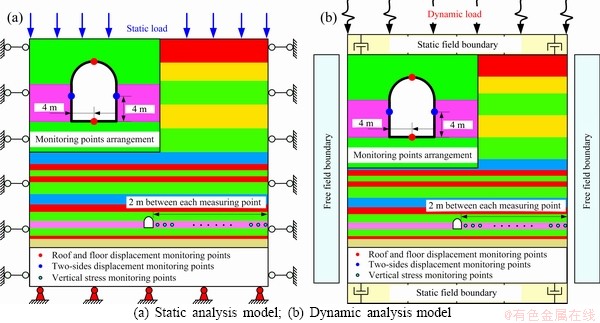
Figure 5 Model boundary conditions and monitoring point layout:
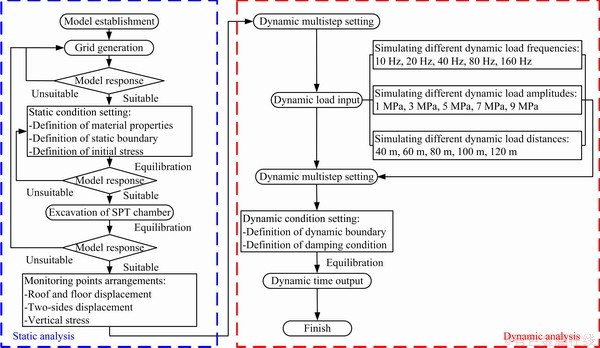
Figure 6 Numerical simulation procedure
3.3 Simulation schemes and procedure
3.3.1 Simulation schemes
(1) Dynamic load frequency
In order to study the influence of dynamic load frequency on the deformation and failure evolution of surrounding rock, five simulation calculation schemes with different dynamic load frequencies f are arranged, which are respectively: f=10 Hz, f=20 Hz, f=40 Hz, f=80 Hz, f=160 Hz. And the dynamic load amplitude A is set to 4 MPa, the dynamic load action time is fixed to 0.1 s, and the dynamic load source is located in the overlying strata at the vertical distance J=70 m from the chamber roof to control the research variables.
(2) Dynamic loading amplitude
In order to study the influence of dynamic load amplitude on the deformation and failure evolution of surrounding rock, five simulation calculation schemes with different dynamic load amplitudes A are arranged, which are respectively: A=1 MPa, A=3 MPa, A=5 MPa, A=7 MPa, A=9 MPa. And the dynamic load frequency f is set as 20 Hz, the dynamic load action time is one cycle (0.05 s). The dynamic load source is located in the overlying strata at the vertical distance J=70 m from the chamber roof to control the research variables.
(3) Dynamic load source distance
In order to study the influence of different dynamic load source distances on the deformation and failure evolution of surrounding rock, five simulation calculation schemes of different dynamic load source distances are arranged, which are respectively: J=40 m, J=60 m, J=80 m, J=100 m, J=120 m. And the dynamic load amplitude A is set to 4 MPa, the dynamic load frequency f is set to 20 Hz, and the dynamic load action time is one cycle (0.05 s). At the same time, the stress and deformation of the surrounding rock are monitored respectively.
3.3.2 Simulation procedure
The detailed simulation procedure can be divided into two parts: static loading and dynamic loading, as shown in Figure 6. In the static loading procedure: (1) The overburden weight is applied to the top boundary to make the model reach equilibrium under the self weight stress; (2) The SPT chamber is excavated at the predetermined position, and monitoring points are arranged to realize the real-time monitoring of the stress and deformation; (3) Calculated to static equilibrium. In the dynamic loading procedure: (1) Set up dynamic multi-step to classify the zones and gridpoints; (2) Dynamic load is applied, and the dynamic load frequency, amplitude and distances from chamber are changed according to the scheme; (3) Dynamic boundary and damping setting; (4) Calculate to the equilibrium state, record the dynamic time and monitor the stress and displacement measuring points.
4 Results and analysis
4.1 Response characteristics under static loading condition
Under the static loading condition, the stress and displacement of SPT chamber surrounding rock are changed in varying degrees. The vertical stress monitoring curve and distribution are shown in Figure 7, the deformation monitoring curve and distribution are shown in Figure 8 and the plastic area is shown in Figure 9.
As shown in Figure 7, the stress is redistributed due to the chamber excavation. The stress in roof and floor are both significantly reduced, and the closer to the chamber, the more obvious the stress is decreased. At the same time, the significant stress concentration occurs in the two-sides. By comparing the data from 1#-7# stress monitoring points, it can be found that the stress in the two-side increases slowly and finally tends to be stable after the chamber excavation. The maximum stress is located at the 3# measuring point, which is about 6 m away from the chamber. The maximum vertical stress measured is 32.7 MPa, and the stress concentration factor is 1.64. As shown in Figure 8, the roof and two-side are deformed in different degrees, and the maximum deformation is located in the inner wall of chamber. According to the displacement monitoring curve, as shown in Figure 8(a), the roof subsidence gradually increases after excavation and finally stabilizes at 32.0 mm; the increase range of the floor is smaller than that of the roof, and the maximum floor heave gradually increases and finally stabilizes at 22.6 mm. And the maximum roof-to-floor convergence is 54.6 mm. As shown in Figure 8(b), the two-side deformation increases slowly with the same growth rate, and basically distributes in a symmetrical distribution. Among them, the maximum deformation of the left side is 26.5 mm, that of the right side is 26.6 mm, and that of the two-sides is 53.1 mm. As shown in Figure 9, the plastic zone is relatively developed due to the influence of high ground stress and strong mining stress. The failure mode of the roof and the two-side is mainly shear failure, while the floor is also affected by tensile stress. The maximum failure depth of the two-sides and the roof-to-floor is 8 m, and the plastic failure area is about 202 m2.
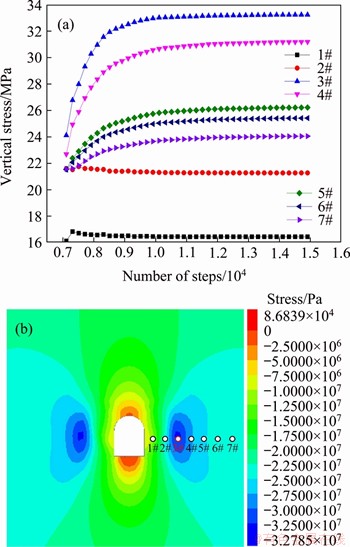
Figure 7 Stress monitoring curve and distribution under static loading condition
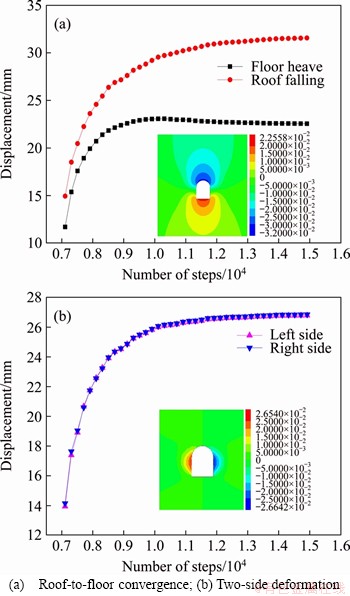
Figure 8 Deformation monitoring curve and distribution under static loading condition:
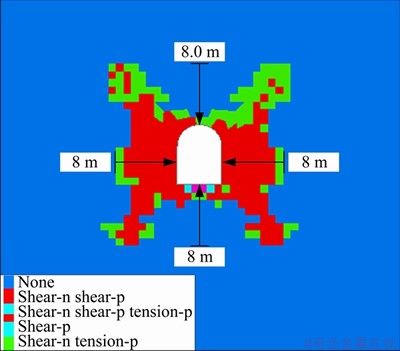
Figure 9 Plastic area under static loading condition
4.2 Response characteristics under different dynamic loading conditions
4.2.1 Different dynamic load frequencies
The deformation and failure evolution of surrounding rock under different dynamic load frequencies are studied. The maximum vertical stress monitoring curve and distribution characteristics are shown in Figure 10, the deformation monitoring curve of the roof-to-floor and two-sides are shown in Figure 11, and the plastic failure zone is shown in Figure 12.
According to Figures 10-12, the dynamic load causes further responses to the chamber surrounding rock. When the dynamic load frequency is 10 Hz, the chamber is disturbed by dynamic load once in the fixed dynamic time, and the maximum vertical stress increases slightly compared with that of the static load. By comparing the stress monitoring data, it is found that the stress concentration area is located at 3# measuring points, which is about 6 m away from the chamber, and the peak stress value is 32.8 MPa. The chamber deformation fluctuating increases. The maximum roof-to-floor convergence is 54.8 mm, and the maximum two-sides deformation is 53.3 mm. The plastic failure area is basically unchanged, the maximum failure depth is 8.0 m, and the plastic failure area of the surrounding rock is about 210 m2. When the dynamic load frequency is 20 Hz, the chamber is disturbed two times by dynamic load in the fixed dynamic load time, and the stress concentration area is still located at 3# measuring points. The maximum vertical stress is increased compared with that of 10 Hz, which reaches 34.1 MPa. What is more, the deformation of the surrounding rock is slightly increased. The maximum roof-to-floor convergence is 57.5 mm, and the maximum two-sides deformation is 55.7 mm. The plastic failure depth in the two-sides is basically unchanged, while those of the roof and floor are both 9.0 m. The range of plastic zone increases slightly, and the maximum plastic failure area is 224 m2. When the dynamic load frequency is 40 Hz, the chamber is disturbed four times by dynamic load in the fixed dynamic load time. The stress concentration area is about 6 m away from the chamber. The maximum vertical stress continues to increase compared with that of 20 Hz, which reaches 34.5 MPa. The deformation of the surrounding rock is further increased, the maximum roof-to-floor convergence is 59.9 mm, and the maximum two-sides deformation is 64.7 mm. The maximum plastic failure area is expanded to 252 m2.
When the dynamic load frequency is 80 Hz, the chamber is disturbed eight times by dynamic load in the fixed dynamic load time. Through the comparison of stress monitoring data, it is found that the stress concentration area is located at 4# measuring points, which is about 8 m away from chamber. The maximum vertical stress increases significantly compared with that of 40 Hz, which reaches 35.7 MPa. The deformation of the surrounding rock increases obviously, among which the maximum roof-to-floor convergence is 63.3 mm, and the maximum two-sides deformation is 75.1 mm. Moreover, the degree of plastic failure increased sharply, the maximum plastic failure depth of roof increased to 11.0 m, that of floor continued to increase to 10.0 m, and that of two-sides increased to 9.0 m. The maximum plastic failure area increased to 278 m2. When the dynamic load frequency is 160 Hz, the chamber is disturbed sixteen times by dynamic load in the fixed dynamic load time. The stress concentration area is still located at 4# measuring point, and the maximum vertical stress increases sharply compared with 80 Hz, which reaches 37.5 MPa. The deformation of chamber is significantly increased and the difference is more obvious. The maximum roof-to- floor convergence is 66.6 mm, and the maximum two-sides deformation is 75.1 mm. The degree of plastic failure is further intensified, in which the maximum plastic failure depth of roof and floor increases to 12.0 m, that of two-sides increases to 10.0 m. And the maximum plastic failure area increases to 350 m2.
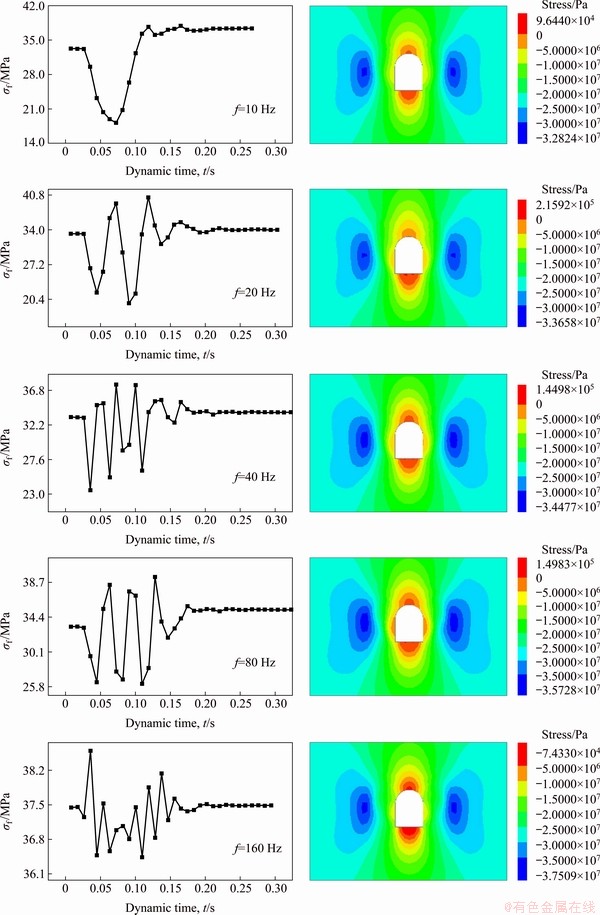
Figure 10 Maximum vertical stress (��f) distribution and monitoring curve under different dynamic load frequencies
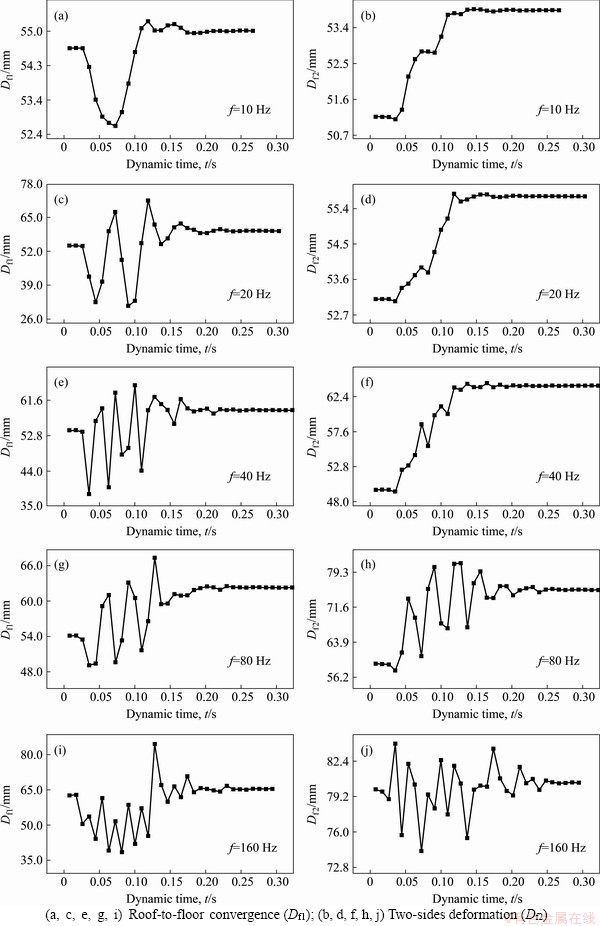
Figure 11 Deformation of surrounding rock under different dynamic load frequencies:
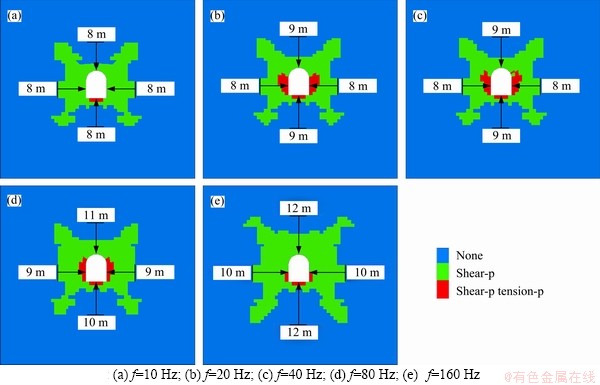
Figure 12 Plastic zone under different dynamic load frequencies:
The relationship between the maximum vertical stress, the maximum roof-to-floor convergence, the maximum two-side deformation, the plastic area and the dynamic load frequencies are calculated, as shown in Figure 13. With the increase of dynamic load frequency, the number of disturbances also increases correspondingly in the fixed time, which makes the stress, deformation and failure range of the surrounding rock increase in different degrees.
Besides, the wave growth pattern is roughly consistent with the waveform curve of the applied dynamic load. When the dynamic load frequency is 10 Hz, the stress and deformation of the surrounding rock are basically the same as that of the static loading condition, which shows that the influence of dynamic disturbance on the chamber is very small, and the surrounding rock is basically intact and stable. With the increase of the dynamic load frequency, the response of the surrounding rock is getting more and more severe, and the deformation and failure degree increases significantly. When the dynamic load frequency is 40 Hz, compared with the static loading condition, the maximum vertical stress increases by 5.5%, the roof-to-floor convergence increases by 9.7%, the two-sides deformation increases by 21.4%, and the plastic failure area increases by 24.8%. It can be seen that the deformation and failure range of surrounding rock at the two-sides is large, which shows that the dynamic load frequency has a more obvious impact on the two-sides. As the dynamic load frequency continues to increase, the number of disturbances increases exponentially, which makes the deformation and failure degree worse. When the dynamic load frequency is increased to 160 Hz, compared with the static loading condition, the maximum vertical stress is increased by 14.7%, roof-to-floor convergence increased by 22.0%, two-sides deformation increased by 50.1%, and the plastic failure area increased by 73.3%. At this time, the stress concentration increases sharply, and the plastic failure area increases dramatically. The surrounding rock, especially the two-side, has significant plastic failure, which causes the whole chamber instability.
The empirical Eq. (2) can be obtained for describing the relationship between the dynamic load frequency f and maximum vertical stress  , roof-to-floor convergence Df1, two-side deformation Df2, maximum plastic area Pf of surrounding rock. According to the fitting relation, with the increase of the dynamic load frequency, the maximum vertical stress, the maximum two- sides deformation and the plastic failure area increase approximately in a cubic polynomial function relationship, and the maximum roof-to-floor convergence increases approximately in a parabola, which conforms to the quadratic polynomial function relationship. And the correlation coefficient (R2) are all greater than 0.99.
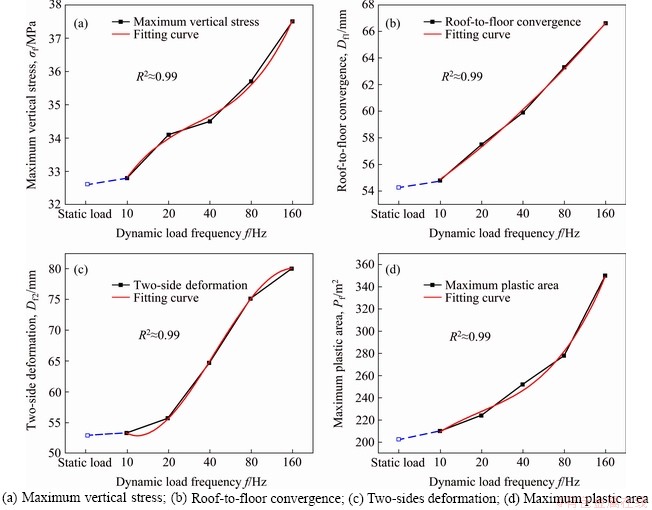
Figure 13 Simulation results statistical curve for different dynamic load frequencies:
 (2)
(2)
4.2.2 Different dynamic load amplitudes
The deformation and failure evolution of surrounding rock under different dynamic load amplitudes are studied. The maximum vertical stress monitoring curve and distribution characteristics are shown in Figure 14, the deformation monitoring curves of the roof-to-floor and two-sides are shown in Figure 15, and the plastic failure zone is shown in Figure 16.
It can be seen from Figures 14-16 that when the dynamic load amplitude is 1 MPa, the stress concentration area is about 6 m away from the chamber (3# measuring point), and the maximum vertical stress slightly increases compared with the static loading condition, which is 32.8 MPa. The maximum roof-to-floor convergence is 54.6 mm, and the maximum two-side deformation is 53.3 mm. The plastic failure area is basically unchanged, which is about 209 m2. And the maximum failure depth is 8.0 m. When the dynamic load amplitude is 3 MPa, the stress concentration area is located about 6 m away from the chamber (3# measuring point), and the maximum vertical stress increases slightly compared with that of 1 MPa, which reaches 33.0 MPa. The deformation of the surrounding rock is increased compared with that of 1 MPa. The maximum roof-to-floor convergence is 55.4 mm, and the maximum two-side deformation is 55.7 mm. The plastic failure depth of the two-side and floor are basically unchanged, while that of the roof increased to 9.0 m, and the maximum plastic failure area is 220 m2. When the dynamic load amplitude is 5 MPa, the distance between the stress concentration area and chamber has increased, which is located about 8 m away from the chamber (4# measuring point), and the maximum vertical stress increases significantly compared with that of 3 MPa, which reaches 35.7 MPa. The deformation of the surrounding rock is further increased. The maximum roof-to-floor convergence is 62.3 mm, and the maximum two-side deformation is 65.0 mm. The plastic failure degree is further enhanced, in which the maximum plastic failure depth of roof is increased to 10.0 m, that of floor is increased to 9.0 m, and the maximum plastic failure area is increased to 234 m2.
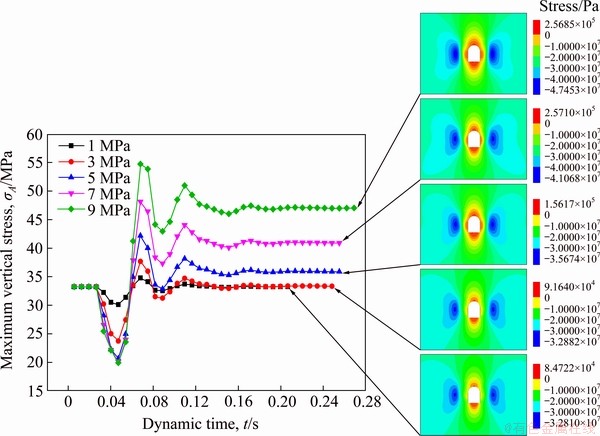
Figure 14 Maximum vertical stress distribution and monitoring curve under different dynamic load amplitudes
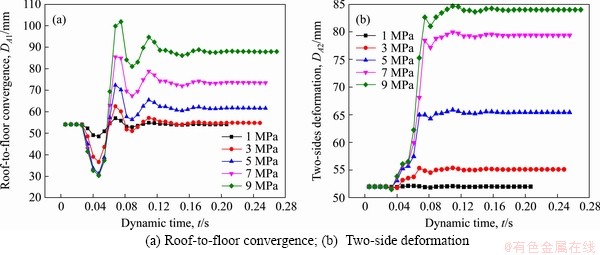
Figure 15 Deformation of surrounding rock under different dynamic load amplitudes:
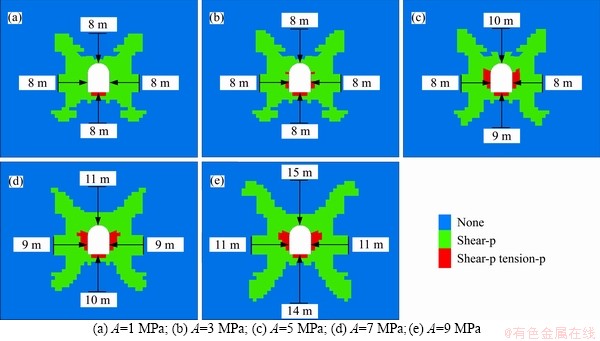
Figure 16 Plastic zone under different dynamic load amplitudes:
When the dynamic load amplitude is 7 MPa, the stress concentration area is located about 8 m away from the chamber (4# measuring point), and the maximum vertical stress continues to increase compared with that of 5 MPa, which reaches 40.1 MPa. The deformation of the surrounding rock is further increased. The maximum roof-to-floor convergence is 74.3 mm, and the maximum two-side deformation is 78.4 mm. The plastic failure degree is intensified, in which the maximum failure depth of the roof increases to 11.0 m, and that of the floor increases to 10.0 m. The maximum failure depth of two-side increased by the same range, both of which are 9.0 m, and the maximum plastic failure area increased to 250 m2. When the dynamic load amplitude is 9 MPa, the stress concentration area is located about 10 m away from the chamber (5# measuring point), and the maximum vertical stress increases sharply compared with that of 7 MPa, which reaches 47.5 MPa. And the maximum roof-to-floor convergence is 89.0 mm, and the maximum two-side deformation is 84.2 mm. The plastic failure degree is further intensified, in which the maximum plastic failure depth of roof and floor increases significantly, to 15.0 m and 14.0 m respectively, that of two-sides increases to 11.0 m, and the maximum plastic failure area increases to 298 m2.
The relationship between the maximum vertical stress, the maximum roof-to-floor convergence, the maximum two-side deformation, the plastic area and the dynamic load amplitudes are calculated, as shown in Figure 17. With increase of the dynamic load amplitude, the stress, deformation and failure range of the surrounding rock have increased to varying degrees. When the dynamic load amplitude is 1 MPa, compared with the static loading condition, the maximum vertical stress increases by 0.3%, the deformation of roof, floor and two-sides remain unchanged, and the plastic failure area increases by 3.5%.
At this time, the stress and deformation of the surrounding rock are not affected by the dynamic load. When the dynamic load amplitude increases to 5 MPa, compared with the static loading condition, the maximum vertical stress increases by 9.2%, the roof-to-floor convergence increases by 14.1%, the two-side deformation increases by 22.0%, and the plastic failure area increases by 15.8%. At this time, the stress concentration speed is gradually accelerated, and the deformation and failure of the surrounding rock are obvious and further intensified with the increase of the dynamic load amplitude. When the dynamic load amplitude increases to 9 MPa, compared with the static loading condition, the maximum vertical stress continues to increase by 45.3%, the roof-to-floor convergence increases by 63.0%, the two-side deformation increases by 57.6%, and the plastic failure area increases by 47.5%. It can be seen that the dynamic load amplitude has a great influence on the stress concentration, the deformation of the roof and the two-sides are greatly increased, and the plastic failure mostly develops to the deep rather than the shallow.
The following empirical Eq. (3) can be obtained for describing the relationship between the dynamic load amplitude A and maximum vertical stress  , roof-to-floor convergence DA1, two-side deformation DA2, maximum plastic area PA of surrounding rock. According to the fitting relation, with the dynamic load amplitude increase, the maximum vertical stress, the maximum roof-to- floor convergence increases approximately in a parabola, which conforms to the quadratic polynomial function relationship. Meanwhile, the maximum two-sides deformation and plastic failure area increase approximately in a cubic polynomial function relationship, and the correlation coefficient (R2) are all greater than 0.99.
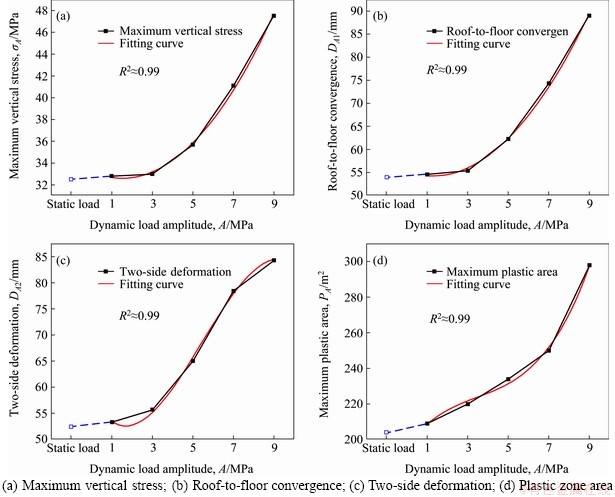
Figure 17 Simulation results statistical curve for different dynamic load amplitudes:
 (3)
(3)
4.2.3 Different dynamic load source distances
The deformation and failure evolution of surrounding rock under different dynamic load source distances are studied. The maximum vertical stress monitoring curve and distribution characteristics are shown in Figure 18, the deformation monitoring curve of the roof-to-floor and two-sides are shown in Figure 19, and the plastic failure zone is shown in Figure 20.
It can be seen from Figures 18-20 that when the dynamic load source distance is 40 m, the stress concentration area is about 10 m away from the chamber (5# measuring point), and the maximum vertical stress increases sharply, which reaches 36.2 MPa. The chamber surrounding rock suffers the severe deformation, the maximum roof-to-floor convergence is 63.1 mm, and the maximum two-sides deformation is 73.0 mm. The plastic failure of surrounding rock is serious, in which the maximum plastic failure depth of roof and floor is 12.0 m and 11.0 m, respectively, that of two-side is 10.0 m, and the maximum plastic failure area is 314 m2. When the dynamic load source distance is 60 m, the stress concentration area is about 10 m away from the chamber (5# measuring point), and the maximum vertical stress is 34.3 MPa less than that of 40 m. The deformation of the surrounding rock also shows a decreasing trend. The maximum roof- to-floor convergence is 58.4 mm, and the maximum two-sides deformation is 59.3 mm. The plastic failure degree has been decreased, the maximum failure depth of roof and floor decreased to 10.0 m, that of two-side decreased to 9.0 m, and the maximum plastic failure area reduced to 247 m2. When the dynamic load source distance is 80 m, the distance between the stress concentration area and the chamber is reduced, which is located at about 6 m (3# measuring point). The maximum vertical stress continues to decrease compared with that of 40 m, which is 33.9 MPa. The deformation of the surrounding rock continues to decrease, the maximum roof-to-floor convergence is 56.9 mm, and the maximum two-side deformation is 55.1 mm. The range of the plastic failure area has been narrowed, which is about 218 m2. The maximum failure depth of the roof and two-sides is 8.0 m, and that of the floor is 9.0 m.
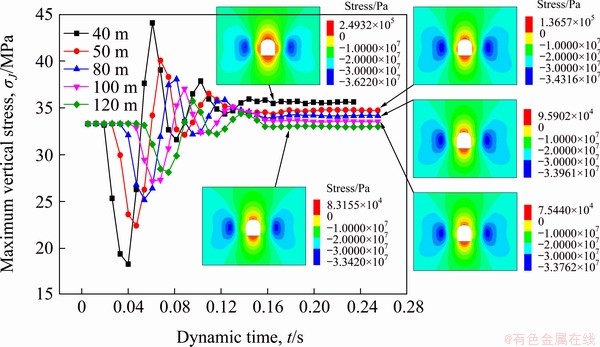
Figure 18 Maximum vertical stress distribution and monitoring curve under different dynamic load source distances
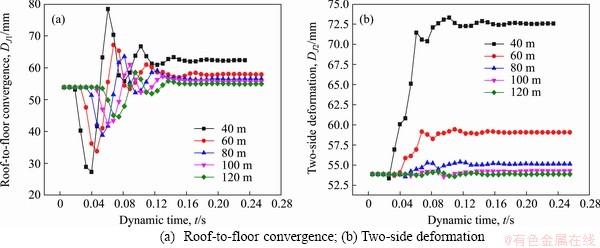
Figure 19 Deformation of surrounding rock under different dynamic load source distances:
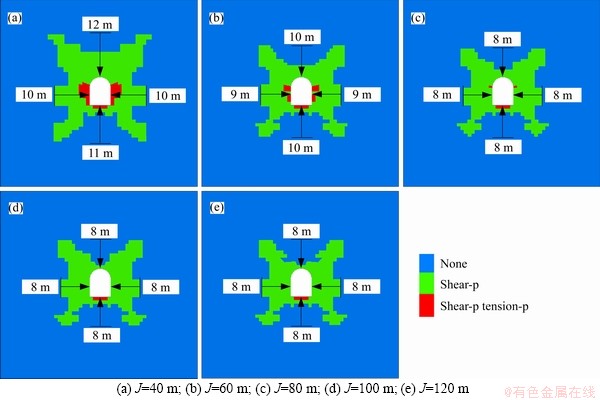
Figure 20 Plastic zone under different dynamic load source distances:
When the dynamic load source distance is 100 m, the stress concentration area is about 6 m away from the chamber (3# measuring point), and the maximum vertical stress is slightly smaller than that of 80 m, which is 33.7 MPa. The maximum roof-to-floor convergence is reduced to 56.1 mm, and the maximum two-sides deformation is reduced to 54.3 mm. The range of the plastic failure area is slightly narrowed, among which the maximum failure depth of the roof and two-side is basically unchanged compared with 80 m, that of the floor is reduced to 8.0 m, and the plastic failure area is about 210 m2. When the dynamic load source distance is 120 m, the stress concentration area is about 6 m away from the chamber (3# measuring point). The maximum vertical stress continues to decrease slightly compared with 100 m, which reaches 33.4 MPa. The maximum roof-to-floor convergence is reduced to 55.3 mm, and the maximum two-sides deformation is 53.3 mm. The plastic failure depth and range are further reduced. The maximum failure depth of the roof, floor and two-side is 8.0 m, and the maximum plastic failure area is 206 m2.
The relationship between the maximum vertical stress, the maximum roof-to-floor convergence, the maximum two-side deformation, the plastic area and the load source distances are calculated, as shown in Figure 21. When the dynamic load source distance is 40 m, compared with the static loading condition, the maximum vertical stress increases by 10.7%, the roof-to-floor convergence increases by 15.6%, the two-side deformation increases by 37.0%, and the plastic failure area increases by 55.4%. At this time, the stress and deformation of surrounding rock are greatly affected by the dynamic load for small distance, and the shallow surrounding rock is seriously destabilized and damaged, and has a tendency to continue to develop deeper. With the increase of the distance between the dynamic load source and the chamber, the stress, deformation and failure range of the surrounding rock decrease in varying degrees. When the dynamic load source distance increases to 80 m, compared with 40 m, the maximum vertical stress decreases by 6.8%, the roof-to-floor convergence decreases by 11.1%, the two-side deformation decreases by 32.5%, and the plastic failure area decreases by 44.0%. At this time, the influence of dynamic load disturbance on the chamber is weakened, the stress concentration degree, deformation and plastic failure area of surrounding rock are greatly reduced, among which the two-side have the most obvious reduction. When the dynamic load source distance is increased to 120 m, compared with 40 m, the maximum vertical stress is reduced by 8.4%, the roof-to-floor convergence is reduced by 13.9%, the two-side deformation is reduced by 37.0%, and the plastic failure area reduced by 52.4%.
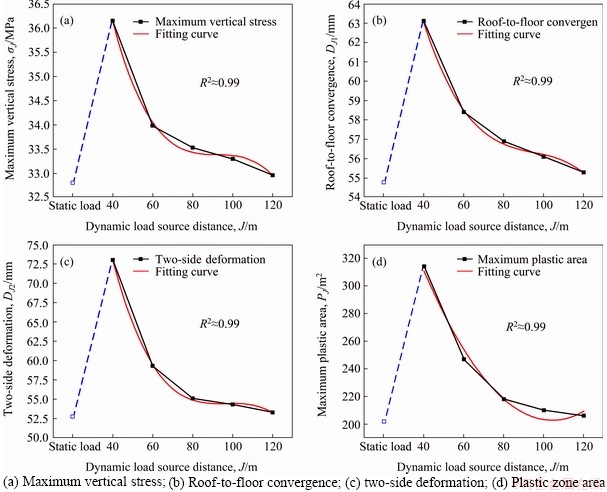
Figure 21 Simulation results statistical curve for different dynamic load source distances:
With the further increase of the dynamic load source distance, the stress, deformation and failure degree of the surrounding rock further decrease and the rate gradually slows down. Meanwhile, the influence of dynamic load on the chamber gradually attenuates due to the damping effect and eventually disappears, which is gradually approaching the static loading condition.
The following empirical Eq. (4) can be obtained for describing the relationship between the dynamic load source distance J and maximum vertical stress  , roof-to-floor convergence DJ1, two-side deformation DJ2, maximum plastic area PJ of surrounding rock. According to the fitting relation, with the dynamic load distance increases, the maximum vertical stress, the maximum roof-to-floor convergence and the maximum two-side deformation decrease approximately in a cubic polynomial function relation, and the plastic failure area decreases approximately in a parabola, which conforms to the quadratic polynomial function relation. And the correlation coefficients (R2) were all greater than 0.99.
 (4)
(4)
5 Discussion
In this paper, the authors revealed the failure evolution of surrounding rock for deep super-large section chamber in static load condition. On this basis, the response characteristics of surrounding rock under different dynamic loading conditions are obtained by applying different dynamic loads respectively.
Currently, some scholars mainly targeted on small or medium section chamber [22-38], and obtained the failure evolution and influencing factors of chamber surrounding rock under a specific geological and mining condition, which provides some support for the stability control. However, the evolution characteristics of the surrounding rock deformation and new fracture in surrounding rock under different dynamic loading conditions for the deep super-large section chambers are not clear. In this paper, the authors obtained the response characteristics of the surrounding rock for super-large section chamber under different dynamic load frequencies, amplitudes and source distances. The results show that with the increase of the dynamic load frequency and amplitude, the stress, deformation and failure range of the surrounding rock increase fluctuately, while with the increase of the distance between the dynamic load source and the chamber, the response of the surrounding rock gradually decreases and tends to disappear under the action of damping. Meanwhile, DU et al [48] found that as the number of dynamic load disturbances increases, the vibration wave can excite the maximum response of the model. LI et al [49] found that the closer the dynamic disturbance to the chamber, the greater that change of stress, the more the energy release in the rock mass, and the more serious the impact damage to the surrounding rock. The above conclusions have verified the simulation results of this paper to a certain extent. However, the above research objects are all medium section roadways/chambers, and the response degree and form of the surrounding rock are different from those of the super-large section chambers. Through the research in this paper, it is found that for the super-large section chambers, the deformation and failure of the two-side are more obvious under different dynamic load frequencies, which is due to the high chamber sides and the multi-layer arrangement. Besides, the dynamic load amplitude has a great influence on the stress concentration, and the plastic failure tends to develop to the deeper of surrounding rock.
It should be noted that in the study of different dynamic load conditions, we use the control variables method, which can make the simulation scheme more targeted. But this paper fails to obtain quantitative analytical solutions and failure criteria from the theoretical point of view. In future work, we will further establish the chamber mechanical model, and study the instability mechanism of surrounding rock for deep super-large section chamber under dynamic and static loads.
6 Conclusions
1) In this paper, we take the SPT chamber of Longgu Coal Mine as the research object, and obtain the response characteristics of the surrounding rock under static loading condition. The results show: the response degree of super-large section chamber is severer than that of the small and medium section chambers, in which the maximum stress concentration coefficient is 1.64, the maximum displacements of the roof-to-floor and the two-side are 54.6 mm and 53.1 mm, respectively. The plastic zone is relatively developed, and the maximum plastic failure depth is 8 m.
2) With the increase of dynamic load frequency, the stress, deformation and failure range of the surrounding rock have increased to varying degrees, of which the two-side are most affected. The two-side deformation at 160 Hz is 50.1% higher than that of 10 Hz. The fitting calculation shows that the maximum vertical stress, the maximum two-side deformation and the plastic failure area increase approximately in cubic polynomial, and the maximum roof-to-floor convergence increase approximately by quadratic polynomial.
3) The dynamic load strength has a great influence on the stress concentration of surrounding rock. The stress concentration coefficient is 2.38 when the dynamic load strength is 9 MPa. With the dynamic load amplitude increases, the deformation of the roof and the two-side increases greatly, and the plastic failure has developed more deeply. The fitting calculation shows that the maximum vertical stress and the maximum roof-to-floor convergence are approximately increased by a quadratic polynomial function, while the maximum two-side deformation and the plastic failure area are approximately increased by a cubic polynomial function.
4) With the dynamic load sources increase, the response degree of the surrounding rock gradually decreases under the damping effect, the reduction rate gradually slows down, and eventually tends to the static loading condition. The fitting calculation shows that the maximum vertical stress, the maximum roof-to-floor convergence and the two-side deformation decrease approximately in cubic polynomials, and the plastic failure area decreases approximately in quadratic polynomials.
5) This research provides reference and guidance for surrounding rock supporting and stability control of deep super-large section chamber. It should be noted that we have not obtained the mechanical properties of the surrounding rock for deep super-large section chamber under the dynamic and static loads quantitatively, which needs to be further improved in the future.
Contributors
The overarching research goals were developed by FAN De-yuan, LIU Xue-sheng and TAN Yun-liang. FAN De-yuan established the calculation model. SONG Shi-lin and MA Qing analyzed the calculated results. NING Jian-guo conducted the literature review. The initial draft of the manuscript was written by FAN De-yuan and LIU Xue-sheng. All authors replied to reviewers�� comments and revised the final version.
Conflict of interest
FAN De-yuan, LIU Xue-sheng, TAN Yun- liang, SONG Shi-lin, NING Jian-guo and MA Qing declare that they have no conflict of interest.
References
[1] ZHANG Guang-chao, HE Fu-lian, LAI Yong-hui, JIA Hong-guo. Ground stability of underground gateroad with 1 km burial depth: A case study from Xingdong coal mine, China [J]. Journal of Central South University, 2018, 25(6): 1386-1398. DOI: 10.1007/s11771-018-3834-4.
[2] RANJITH P G, ZHAO Jian, JU Ming-he, DE SILVA R V S, RATHNAWEERA T D, BANDARA A K M S. Opportunities and challenges in deep mining: A brief review [J]. Engineering, 2017, 3: 546-551. DOI: 10.1016/J.ENG.2017. 04.024.
[3] FAN De-yuan, LIU Xue-sheng, TAN Yun-liang, YAN Lei, SONG Shi-lin, NING Jian-guo. An innovative approach for gob-side entry retaining in deep coal mines: A case study [J]. Energy Science and Engineering, 2019, 7: 2321-2335. DOI: 10.1002/ese3.431.
[4] KONICEK P, SOUCEK K, STAS L, SINGH R. Long-hole destress blasting for rockburst control during deep underground coal mining [J]. International Journal of Rock Mechanics and Mining Sciences, 2013, 61: 141-153. DOI: 10.1016/j.ijrmms.2013.02.001.
[5] KONG Biao, WANG En-yuan, LU Wei, LI Zeng-hua. Application of electromagnetic radiation detection in high-temperature anomalous areas experiencing coalfield fires [J]. Energy, 2019, 189: 1-13. DOI: 10.1016/j.energy. 2019.116144.
[6] KNAPPSTEIN R, KUENNE G, BECKER L G, DI M F, SADIKI A, DREIZLER A, JANICKA J. Large eddy simulation of a novel gas-assisted coal combustion chamber [J]. Flow, Turbulence and Combustion, 2018, 101(3): 895-926. DOI: 10.1007/s10494-018-9910-x.
[7] MA Qing, TAN Yun-liang, LIU Xue-sheng, GU Qing-heng, LI Xue-bin. Effect of coal thicknesses on energy evolutioncharacteristics of roof rock-coal-floor rock sandwich composite structure and its damage constitutivemodel [J]. Composites Part B, 2020, 198: 108086. DOI: 10.1016/j.compositesb.2020.108086.
[8] ZHAO Zeng-hui, ZHANG Ming-zhong, MA Qing, CHEN Bao-sen. Deviation effect of coaxiality on the rock brazilian split [J]. Advances in Mathematical Physics, 2020: 5782457. DOI: 10.1155/2020/5782457.
[9] TAN Yun-liang, FAN De-yuan, LIU Xue-sheng, SONG Shi-lin, LI Xian-feng, WANG Hong-lei. Numerical investigation on failure evolution of surrounding rock for super-large section chamber group in deep coal mine [J]. Energy Science and Engineering, 2019, 7: 3124-3146. DOI: 10.1002/ese3.484.
[10] ZHOU Wen-long, ZHANG Ping-song, WU Rong-xin, HU Xiang-yun. Dynamic monitoring the deformation and failure of extra-thick coal seam floor in deep mining [J]. Journal of Applied Geophysics, 2019, 163: 132-138. DOI: 10.1016/j. jappgeo.2019.02.007.
[11] JIA Peng, ZHU Wan-cheng. Dynamic-static coupling analysis on rockburst mechanism in jointed rock mass [J]. Journal of Central South University, 2012, 19(11): 3285-3290. DOI: 10.1007/s11771-012-1405-7.
[12] YIN Tu-bing, WANG Pin, LI Xi-bing, SHU Rong-hua, YE Zhou-yuan. Effects of thermal treatment on physical and mechanical characteristics of coal rock [J]. Journal of Central South University, 2016, 23(9): 2336-2345. DOI: 10.1007/ s11771-016-3292-9.
[13] HU Shan-chao, TAN Yun-liang, ZHOU Hui, RU Wen-kai, NING Jian-guo, WANG Jun, HUANG Dong-mei, LI Zhen. Anisotropic modeling of layered rocks incorporating planes of weakness and volumetric stress [J]. Energy Science and Engineering, 2019, 8(3): 789-803. DOI: 10.1002/ese3.551.
[14] SONG Shi-lin, LIU Xue-sheng, TAN Yun-liang, FAN De-yuan, MA Qing, WANG Hong-lei. Study on failure modes and energy evolution of coal-rock combination under cyclic loading [J]. Shock and Vibration, 2020: 5731721. DOI: 10.1155/2020/5731721.
[15] ZHAO Tong-bin, ZHANG Wei, GUO Wei-yao. Digital image correlation analysis of displacement based on corrected three surface fitting algorithm [J]. Complexity, 2019: 4620858. DOI: 10.1155/2019/4620858.
[16] WANG Jun, NING Jian-guo, JIANG Jin-quan, BU Teng-teng. Structural characteristics of strata overlying of a fully mechanized longwall face: a case study [J]. Journal of the Southern African Institute of Mining and Metallurgy, 2018, 118: 1195-1204. DOI: 10.17159/2411-9717/2018/v118n11a10.
[17] TAN Yun-liang, LIU Xue-sheng, SHEN Bao-tang, GU Qing-heng, NING Jian-guo. New approaches to testing and evaluating the rockburst risk of coal seam with hard roof and/or floor in coal mines [J]. Geomechanics and Engineering, 2018, 14(4): 367-376. DOI: 10.12989/gae.2018.14.4.367.
[18] FAN De-yuan, LIU Xue-sheng, TAN Yun-liang, SONG Shi-lin, GU Qing-heng, YAN Lei, XU Qiang. Roof cutting parameters design for gob-side entry in deep coal mine: A case study [J]. Energies, 2019, 12, 2032. DOI: 10.3390/ en12102032.
[19] LI Meng, ZHANG Ji-xiong, ZHOU Nan, HUANG Yan-li. Effect of particle size on energy evolution of crushed waste rock in coal mines [J]. Rock Mechanics and Rock Engineering, 2017, 50(5): 1347-1354. DOI: 10.1007/ s00603-016-1151-5.
[20] WANG Meng, ZHENG Dong-jie, NIU Shuang-jian, LI Wen-feng. Large deformation of tunnels in longwall coal mines [J]. Environmental Earth Sciences, 2019, 78(2): 45. DOI: 10.1007/s12665-019-8044-3.
[21] LI Ming, AMINOSSADATI S M, WU Chao. Numerical simulation of air ventilation in super-large underground developments [J]. Tunnelling and Underground Space Technology, 2016, 52: 38-43. DOI: 10.1016/j.tust.2015.11. 009.
[22] LIU Dong-qiao, WANG Yang, HU Xiang-xing, REN Fu-qiang. Calculation and test analysis on stress of surrounding rock in mine roadway with mine pressure bump occurred by dynamic load [J]. Coal Science and Technology, 2015, 43(9): 42-46, 116. DOI: 10.13199/j.cnki.cst.2015.09. 008. (in Chinese)
[23] LI Ke, ZHANG Jin-hong, ZHANG Kai-zhi, XIAO Li-ping, XU You-lin, DUAN Yu. Study on mechanism of deep roadway rock burst induced by dynamic load in high ground stress region [J]. Safety in Coal Mines, 2017, 48(7): 52-56. DOI: 10.13347/j.cnki.mkaq.2017.07.014. (in Chinese)
[24] XIAO Tong-qiang, BAI Jian-biao, WANG Xiang-yu, CHEN Yong, YU Yang. Stability principle and control of surrounding rock in deep coal roadway with large section and thick top-coal [J]. Rock and Soil Mechanics, 2011, 32(6): 1874-1880. DOI: 10.16285/j.rsm.2011.06.032.
[25] LIU Xue-sheng, NING Jian-guo, TAN Yun-liang, GU Qing-heng. Damage constitutive model based on energy dissipation for intact rock subjected to cyclic loading [J]. International Journal of Rock Mechanics and Mining Sciences, 2016, 85: 27-32. DOI: 10.1016/j.ijrmms.2016. 03.003.
[26] LIU Xue-sheng, TAN Yun-liang, NING Jian-guo, LU Yan-wei, GU Qing-heng. Mechanical properties and damage constitutive model of coal in coal-rock combined body [J]. International Journal of Rock Mechanics and Mining Sciences, 2018, 110: 140-150. DOI: 10.1016/j.ijrmms.2018. 07.020.
[27] LIU Xue-sheng, GU Qing-heng, TAN Yun-liang, NING Jian-guo, JIA Zhi-chuang. Mechanical characteristics and failure prediction of cement mortar with a sandwich structure [J]. Minerals, 2019, 9, 143. DOI: 10.3390/ min9030143.
[28] KONG Biao, WANG En-yuan, LI Zeng-hua, LU Wei. Study on the feature of electromagnetic radiation under coal oxidation and temperature rise based on multi-fractal theory [J]. Fractals, 2019, 27, 19500385. DOI: 10.1142/ S0218348X19500385.
[29] CHAKRABORTY T, MISHRA S, LOUKUS J, HALONEN B, BEKKALA B. Characterization of three Himalayan rocks using a split Hopkinson pressure bar [J]. International Journal of Rock Mechanics and Mining Sciences, 2016, 85: 112-118. DOI: 10.1016/j.ijrmms.2016.03.005.
[30] GONG Feng-qiang, LI Xi-bing, LIU Xi-ling, ZHAO J. Energy Dissipation characteristic of red sandstone in the dynamic brazilian disc test with SHPB setup [J]. Advances in Civil Engineering, 2020: 7160937. DOI: 10.1155/2020/ 7160937.
[31] LIU Shao-hong, PAN Jun-feng, MAO De-bing, WANG Shu-wen, PAN Li-ming. Experiment research on axial force quantitative loss law of anchor bolt in blasting in high impact danger roadway [J]. Journal of China Coal Society, 2016, 41(5): 1120-1128. DOI: 10.13225/j.cnki.jccs.2015.1099.
[32] CAI Wu, DOU Lin-ming, WANG Gui-feng, HU Ya-wei. Mechanism of fault reactivation and its induced coal burst caused by coal mining activities [J]. Journal of Mining and Safety Engineering, 2019, 36(6): 1193-1202. DOI: 10.13545/j.cnki.jmse.2019.06.016.
[33] HUO Bing-jie, JING Xue-dong, FAN Zhang-lei, XIE Wei, DUAN Zhi-hua, XIE Zhen-hua. Mechanism of dynamic load of longwall mining under shallow room mining goaf [J]. Chinese Journal of Geotechnical Engineering, 2019, 41(6): 1116-1123. DOI: 10.11779/CJGE201906016.
[34] XIE Long, DOU Lin-ming, LV Chang-guo, YU Gui-liang, WANG Yi. Study on the effect of floor burst induced by dynamic disturbance at different lateral pressure coefficients [J]. Journal of Mining and Safety Engineering, 2013, 30(2): 251-255. DOI: 1673-3363-(2013)02-0251-05.
[35] HAN Ze-peng, DOU Lin-ming, WANG Zheng-yi, QIAO Zhong-dong. Research on stress distribution law of two ribs in large dip angle working face under influence of dynamic and static loads [J]. Coal Science and Technology, 2019, 47(9): 183-188. DOI: 10.13199/j.cnki.cst.2019.09.022.
[36] YANG Zhu-long, ZANG Chuan-wei, TAN Yun-liang, LI Jian-zheng. Numerical simulation of static and dynamic load variation characteristics of surrounding rock in deep roadway [J]. Coal Mining Technology, 2015, 20(4): 62-65. DOI: 10.13532/j.cnki.cn11-3677/td.2015.04.018.
[37] JIAO Jian-kang, JU Wen-jun, WU Yong-zheng, HE Jie. Multi-layer control technologies for surrounding rock stability of dynamic-loading rock burst roadway [J]. Coal Science and Technology, 2019, 47(12): 10-17. DOI: 10.13199/j.cnki.cst.2019.12.002
[38] WANG Zheng-yi, DOU Lin-ming, WANG Gui-feng. Failure mechanism of anchored bolt supporting structure of circular roadway under dynamic load [J]. Chinese Journal of Geotechnical Engineering, 2019, 37(10): 1901-1909. DOI: 10.11779/CJGE201510019.
[39] FAIRHURST C E, HUDSON J A. Draft ISRM suggested method for the complete stress-strain curve for intact rock in uniaxial compression [J]. International Journal of Rock Mechanics & Mining Science, 1999, 36(3): 281-289. DOI: 10.1016/S0148-9062(99)00006-6.
[40] ZHENG Hong, FENG Xia-ting, CHEN Zu-yu, HUDSON J A, WANG Yu-jie. ISRM suggested method for reporting rock laboratory test data in electronic format [J]. Rock Mechanics and Rock Engineering, 2014, 47(1): 221-254. DOI: 10.1007/s00603-013-0440-5.
[41] MOHAMMAD N, REDDISH D J, STACE L R. The relation between in situ, and laboratory rock properties used in numerical modelling [J]. International Journal of Rock Mechanics and Mining Science, 1997, 34: 289-297. DOI: 10.1016/S0148-9062(96)00060-5.
[42] CAI Mei-feng, HE Man-chao, LIU Dong-yan. Rock mechanics and engineering [M]. Beijing: Science Press, 2013. (in Chinese)
[43] CHEN Xiang-jun, LI Li-yang, WANG Lin, QI Ling-ling. The current situation and prevention and control countermeasures for typical dynamic disasters in kilometer-deep mines in China [J]. Safety Science, 2019, 115: 229-236. DOI: 10.1016/j.ssci.2019.02.010.
[44] LIU Xue-sheng, Ning Jian-guo, TAN Yun-liang, GU Qing-heng. Coordinated supporting method of gob-side entry retaining in coal mines and a case study with hard roof [J]. Geomechanics and Engineering, 2018, 15(6): 1173-1182. DOI: 10.12989/gae.2018.15.6.1173.
[45] YUAN Zong-hao, CAO Zhi-gang, CAI Yuan-qiang, GENG Xue-yu, WANG Xiao-qiang. An analytical solution to investigate the dynamic impact of a moving surface load on a shallowly-buried tunnel [J]. Soil Dynamics and Earthquake Engineering, 2019, 126: 105816. DOI: 10.1016/j.soildyn. 2019.105816.
[46] LI Di-yuan, XIAO Peng, HAN Zhen-yu, ZHU Quan-qi. Mechanical and failure properties of rocks with a cavity under coupled static and dynamic loads [J]. Engineering Fracture Mechanics, 2020, 225: 106195. DOI: 10.1016/ j.engfracmech.2018.10.021.
[47] XU Jian-kun, ZHOU Rui, SONG Da-zhao, LI Nan, ZHANG Kai, XI Dan-yang. Deformation and damage dynamic characteristics of coal-rock materials in deep coal mines [J]. International Journal of Damage Mechanics, 2019, 28(1): 58-78. DOI: 10.1177/1056789517741950.
[48] DU Bin-bin, WANG Shao-bo, WANG De-jian, DU Hang- hang. Study on numerical simulation of seismic wave transmission law in coal and rock mass [J]. Coal Science and Technology, 2014, 42(S1): 7-9, 12. DOI: 10.13199/j.cnki.cst. 2014.s1.049.
[49] LI Feng, BI Ming-xin, TIAN Jing, FANG Shu-hao. The dynamic damage mechanisms and failure modes of coal-rock masses under the action of high order P-waves [J]. Shock and Vibration, 2018: 5386123. DOI: 10.1155/2018/ 5386123.
(Edited by HE Yun-bin)
���ĵ���
�����غ���������������Χ����Ӧ���Ե���ֵģ���о�
ժҪ�������������Χ���ȶ��Կ���������������µĹؼ��������⡣���ĸ�������ú��ɸ�ֲ�Ʒת������ʵ�ʵ�������������FLAC3D�е�Dynamicģ��ϵͳ���о��˶����غ�Ӱ����������������Χ����Ӧ���ԡ��������������������Χ�����ֱӦ���������������ѷ�Χ���ϴ�����Ӧ������ϵ��Ϊ1.64�����װ弰�������������ֱ�Ϊ54.6 mm��53.1 mm��֮���ڶ����غɵ����Ŷ��£�����Χ����Ӧ��������һ���仯��(1)�����Ŷ�Ƶ�ʶ������Ӱ���Ϊ���ԣ�������Ƶ��Ϊ160 Hzʱ�����������10 Hzʱ������50.1%��(2)����ǿ�ȶ���Χ��Ӧ�����г̶ȵ�Ӱ�����Ӧ������ϵ�����Ϊ2.38�������ƻ��������Χ�����չ��(3)���Ŷ���Դ�����Ҿ�������ӣ�����Χ����Ӧ���������������˥�������ھ���״̬���ڴ˻����ϣ����ûع�����ķ�������˲�ͬ���������µ�Χ����Ӧ���鷽�̣������ϵ��������0.99�����о��ɹ���Ϊ��ͬ������������������������Χ���ȶ��Կ��Ƽ�֧������ṩ�ο��ͽ����
�ؼ��ʣ�����ɣ�����������ң����أ�����Ƶ�ʣ�����ǿ�ȣ�����Դ����
Foundation item: Project(2018YFC0604703) supported by the National Key R&D Program of China; Projects(51804181, 51874190) supported by the National Natural Science Foundation of China; Project(ZR2018QEE002) supported by the Shandong Province Natural Science Fund, China; Project(ZR2018ZA0603) supported by the Major Program of Shandong Province Natural Science Foundation, China; Project(2019GSF116003) supported by the Key R&D Project of Shandong Province, China; Project(SDKDYC190234) supported by the Shandong University of Science and Technology, Graduate Student Technology Innovation Project, China
Received date: 2020-04-09; Accepted date: 2020-09-02
Corresponding author: LIU Xue-sheng, PhD, Associate Professor; Tel: +86-532-86057017; E-mail: xuesheng1134@163.com; ORCID: https://orcid.org/0000-0003-0289-7264

