J. Cent. South Univ. (2016) 23: 1569-1575
DOI: 10.1007/s11771-016-3210-1

Influence of silicate anions structure on desilication in silicate-bearing sodium aluminate solution
LIU Gui-hua(刘桂华), ZHANG Wen(张闻), QI Tian-gui(齐天贵), PENG Zhi-hong(彭志宏),
ZHOU Qiu-sheng(周秋生), LI Xiao-bin(李小斌)
School of Metallurgy and Environment, Central South University, Changsha 410083, China
 Central South University Press and Springer-Verlag Berlin Heidelberg 2016
Abstract: The structural changes of silicate anions in the desilication process with the addition of calcium hydrate alumino-carbonate were studied by measuring Raman spectra, infrared spectra and corresponding second derivative spectra. The results show that the desilication ratio in the solution prepared by the addition of sodium silicate (solution-SS) is much greater than that in the solution by the addition of green liquor (solution-GL), and low alumina concentration in the sodium aluminate solutions facilitates the desilication process. It is also shown that alumino-silicate anions in the solution-GL, and Q3 polymeric silicate anions in solution-SS are predominant, respectively. In addition, increasing the concentration of silica favors respectively the formation of the alumino-silicate or the Q3 silicate anions in the solution-GL or the solution-SS. Therefore, it can be inferred that the low desilication ratio in the silicate-bearing aluminate solution is mainly attributed to the existence of alumino-silicate anions.
Key words: desilication; silicate anion; structure; sodium aluminate solution; second derivative spectrum of IR
1 Introduction
It is still difficult to remove silica from sodium aluminate solution in alumina production by either Bayer or sintering process. Most of the silica in bauxite (or clinker containing sodium aluminate) enters into the red mud in the form of sodium hydrate alumino-silicate (DSP) and hydrogarnet (or β dicalcium silicate). But there remains 1-8 g/L SiO2 in the sodium aluminate solutions, leading to much scale on the surfaces of equipments, long induction period in gibbsite precipitation, poor quality of products and so on. Thus, much attention has been paid on the desilication of the silicate-bearing sodium aluminate solution [1-6].
The structure of silicate anions in the sodium aluminate solutions highly affects the composition of the desilication residue, desilication ratio and rate. Numerous investigations about the structure of the silicate anions have been undertaken by measuring Fourier Transform Infrared spectrum (FTIR), UV spectrum, electrical conductivity, surface tension and so on. Conclusions can be summarized as follows: 1) ,
,  or polymeric silicate anions exist in sodium silicate solutions, depending on the mass ratio of SiO2/Na2O, the concentration of caustic soda and the concentration of SiO2 [7-8]; 2) Besides anions, there are alumino-silicate anions, which may be in the form of
  or other complicated forms in sodium aluminate solution [7, 9-10]. In addition, different desilication models are set up when various SiO2 sources are adopted in the preparation of silicate- bearing solutions [4]. All facts imply that the structure of silicate anions is still uncertain in sodium aluminate solution. Moreover, there are few publications on the relationship between silicate structure and the desilication ratio in sodium aluminate solutions (
 >100 g/L,
  >100 g/L).
In contrast, much work has been done on the structure of silicate anions in sodium silicate solutions by measurement of IR spectra, NMR and XPS [9, 11-15]. It is found that silicate anions exist predominantly in the forms of monomer (Q1), dimer (Q2), tripolymer (Q3), tetramer (Q4) (superscripts 1-4 stand for the number of neighboring Si atoms connected to a [SiO4]4- tetrahedron) or more complicated silicate anions in silicate solutions, and the Q0, Q1, Q2, Q3 and Q4 in IR spectrum are located at 850-875 cm-1, 815-1005 cm-1, 938-1050 cm-1, 1030-1099 cm-1 and 1140-1220 cm-1, respectively [15-19]. Although there is a significant difference in Al2O3 and Na2O concentration between sodium silicate solutions and silicate-bearing sodium aluminate solutions,these results will benefit the understanding of the silicate structure in silicate-bearing sodium aluminate solution.
In this work, the variation of desilication ratio was investigated when the desilication process was carried out in the silicate-bearing sodium aluminate solutions. And the structure of the silicate anions was then studied by measuring Raman spectra, FTIR spectra and the corresponding second derivative spectra. Finally, the relationship of the desilication ratio and the silicate anions’ structure was discussed.
2 Experimental
2.1 Chemicals and materials preparation
1) Sodium aluminate solution was made by dissolving aluminum hydroxide (CHALCO) into sodium hydroxide solution. 2) Two kinds of silicate-bearing solution were prepared. The sodium silicate solution ( of 250.10 g/L, of 28.01 g/L) was prepared by dissolving sodium metasilicate monohydrate (XILONG Chemical Industry Co., Ltd, China, AR) into sodium hydroxide (XILONG Chemical Industry Co., Ltd, AR) solution. And the green liquor
 of 205.87 g/L,of 260.33 g/L, of 13.35 g/L) was obtained by leaching clinker (CHALCO) in sodium aluminate solution at 60 °C for 2 h. 3) Solution-SS was obtained by slowly adding sodium silicate solution into sodium aluminate solution at stirring speed of 400 r/min, while solution-GL was prepared by injecting the green liquor into sodium aluminate solution at stirring speed of 400 r/min. Furthermore, all solution was held for more than 2 h at room temperature. 4) CaO was obtained by roasting calcium hydroxide (Tianjin Kemiou Chemical Reagent Co., Ltd, China, AR) at 850 °C for 2 h, the fresh lime slurry (solid concentration of 250 g/L) was conducted by CaO reacting with distilled water at room temperature. 5) Calcium hydrate alumino-carbonate (CHAC) was prepared according to the following procedures. The fresh lime slurry was reacted with the diluted sodium aluminate solution (of 95.42 g/L, of 99.67 g/L,
 of 49.75 g/L) according to the volume ratio of 1:3 at 65 °C for 50 min. The slurry was then filtered and washed with water. Lastly, wet CHAC was used for desilication. 6) Silicate-bearing aluminate solution was obtained for measurement of Raman and FTIR spectrum as follows: sodium aluminate solution was prepared by dissolving aluminum hydroxide (Tianjin Kemiou Chemical Reagent Co., Ltd, China, AR) into sodium hydroxide (XILONG Chemical Industry Co., Ltd, China, AR) solution. And then the silicate-bearing sodium aluminate solutions were obtained by mixing the sodium aluminate solution with sodium silicate solution or the green liquor, respectively.
2.2 Desilication procedure
CHAC and 100 mL silicate-bearing sodium aluminate solution were added into a 150 mL steel bomb. The bomb, bathed in glycerin (±1 °C), was then heated to a given temperature. And the desilication lasted for 2-4 h at 90-100 °C, after which the slurry was filtered. The filtrate liquors were used for detecting concentration of alumina (Al2O3), silica and caustic soda (Na2O) after diluting to 1000 mL.
2.3 Analysis and characterization
The concentration of Al2O3 and Na2O was determined by the titration method. SiO2 was measured with UV-Vis spectrophotometer (SP-752, Spectrum Shanghai China) at 625 nm.
Raman spectra was scanned to collect by Raman spectroscopy (Lab RamHR800, Horiba, JobinYvon, France) in 325 nm laser excitation at 20 °C. And the Raman spectra were processed by Labspec5 software.
The IR spectra of thin films for solution on KBr plates were collected on a FT-IR 6700 spectrometer with 4 cm-1 resolution (manufactured by Nicolet Co., USA) [20]. Based on the above FTIR spectra, the corresponding second derivative spectra were then obtained by OMNIC software. Finally, two kinds of spectra were used for distinguishing structures of silicate anions in the sodium aluminate solution.
3 Results and discussion
3.1 Influence of preparation for silicate-bearing aluminate solution on desilication
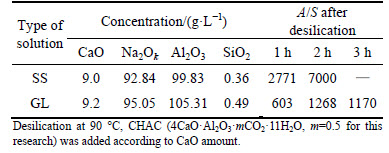
Sintering process is employed to deal with bauxite with high SiO2 content, but SiO2 concentration in the green liquor remains about 3-8 g/L due to β-2CaO・SiO2 in clinker reacting with sodium aluminate solution in leaching process. Thus, two-stage desilication process is adopted. The A/S ratio (concentration ratio of alumina to silica) varies over the range of 200-300 after DSP is formed in the first desilication stage, and the A/S ratio of solution must reach over 500 by addition of calcium-bearing compounds in the second desilication stage. CHAC was added to the second desilication stage in some Chinese alumina refineries because CHAC is more effective than fresh lime slurry. In addition, we find that the desilication ratio in laboratory is much greater than that in alumina refineries under almost of the same condition only due to the different solution. Therefore, two kinds of solutions are adopted, namely, solution-SS as many works were done in laboratory [4, 21-23], and solution-GL which is similar to the alumina refineries’ liquor. The desilication results  <110 g/L) are shown in Table1.
Table 1 shows that the A/S ratio in solution-SS and solution-GL exceeds 600 after desilication at 90 °C for 1 h. Extending desilication time significantly facilitates the desilication process. In addition, the A/S ratio in solution-SS reaches 7000 (99% desilication ratio) at 2 h, which is much greater than A/S of 1268 (83% desilication ratio) in solution-GL.
Table 1 Influence of silicate-bearing sodium aluminate solution on desilication with different duration time
The desilication process in concentrated solutions >130 g/L) is then carried out. The results are shown in Fig. 1.
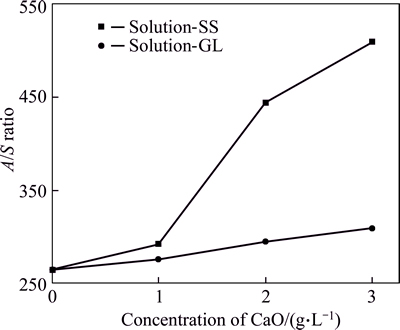
Fig. 1 Influence of CHAC addition on desilication (solution composition: of 144.72 g/L, of 166.49 g/L, of 0.64 g/L, A/S of 260; desilication condition: CHAC added according to CaO stoichiometry, temperature of 90 °C, time of 4 h)
As shown in Fig. 1, the A/S ratio increases with an increase of CHAC dosage in silicate-bearing sodium aluminate solution, and the desilication ratio in solution-SS reaches 49% for 3 h, which is also much greater than that (16%) in solution-GL. Moreover, the bigger the CHAC dosage, the greater the difference of A/S ratio between solution-GL and solution-SS. Results also indicate that increasing Al2O3 concentration hinders the desilication process as compared with the results in Table 1, mainly due to the equilibrium concentration of SiO2 increasing with the rise of Al2O3 concentration.
Therefore, there is a significant difference of A/S ratio after desilication between solution-SS and solution-GL under the same desilication conditions, which may be due to the different structure of silicate in solution. Silicate structure in silicate-bearing sodium aluminate solution is then investigated by detecting Raman spectra and FTIR spectra.
3.2 Raman spectra of silicate-bearing aluminate solution
The Raman spectra of solution-GL and solution-SS are shown in Fig. 2.
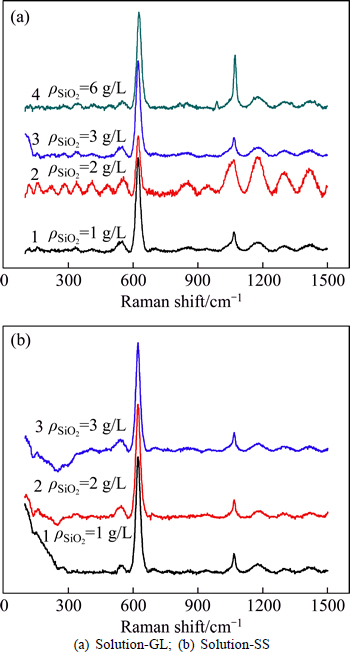
Fig. 2 Raman spectra of silicate-bearing aluminate solution:(solution composition: αk of 1.50, of 160 g/L, of 175 g/L)
As seen in Fig. 2, the strong peak at 625 cm-1 can be observed due to the symmetric Al―O stretch in  the weak peaks at 540 cm-1 may be the consequence of dimer aluminate ion (AlO(OH)62-), and the weak peak at 700 cm-1 also can be found with increasing SiO2 concentration [24-26]. Results in Fig. 2(b) is in good agreement with the reported results [8, 24-26] when solution is prepared by adding sodium silicate solution similar to solution-SS. Compared with Fig. 2(b), some new peaks appear in Fig. 2(a). Peaks at 850 cm-1 and 940 cm-1 are assigned to SiO44- bonding to four and three Al atoms, respectively. Furthermore, peak at 980 cm-1 can be found in solution-GL of of 6 g/L corresponding to SiO44- bonding to two Al atoms [27-28]. This suggests that alumino-silicate anion can be found in solution-GL rather than in solution-SS, possibly resulting in different desilication ratio in silicate-bearing sodium aluminate solution.
3.3 FTIR spectra of silicate-bearing aluminate solution
The infrared spectra of the solution-GL in the range of 500-1000 cm-1 are shown in Fig. 3.

Fig. 3 Effect of silica concentration on FTIR spectra of solution-GL: (of 0, 0.5, 1, 2 and 3 g/L from bottom to top)
There are three bands of FTIR for solution-GL, centering at 540, 630 and 720 cm-1, respectively. The shoulder peak at 880 cm-1 only appears in solution of αk= 1.5, where αk is the molar ratio of Na2O and Al2O3 in sodium aluminate solution, of 160 g/L, resulting from Al―O bond vibration of AlO6 rather than Al―O bond vibration of Al(OH)4- [8, 12, 20, 24, 29-30]. Moreover, there appears a broad weak peak at about 540 cm-1, possibly due to Al―O―Al bond vibration. With increasing SiO2 concentration, peaks at 720 cm-1 and 630 cm-1 remain almost unchanged, however, it seems that the intensity of the peak at 880 cm-1 in Fig. 3(a) becomes weak, and the peak at 540 cm-1 (Figs. 3(a) and (b)) becomes broad.
The influence of SiO2 concentration on the spectra of solution-SS is presented in Fig. 4.
Similarly, there are three separate well- characterized bands at 535, 630 and 720 cm-1 indifferent solutions 160 g/L, 220 g/L) in Fig. 4, and the shoulder peak also centers at 880 cm-1 for solution of αk 1.5. In addition, with the increase of SiO2 concentration, the shapes of the FTIR absorption peaks at 630 and 720 cm-1 bands vary very slightly, but the peak at 535 cm-1 appears to become broader.
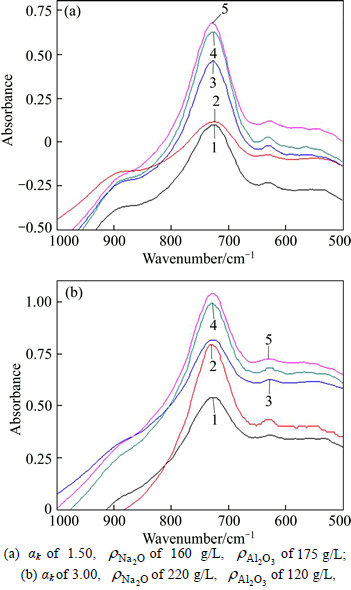
Fig. 4 Effect of silica concentration on FTIR spectra of solution-SS:(of 0, 0.5, 1, 2 and 3 g/L from bottom to top)
Therefore, the FTIR absorption peaks at 720 cm-1, 630 cm-1 and 880cm-1 are assigned to Al―O bond of aluminate anion [10]. No strong peaks corresponding to Si―O or Al―O―Si structure can be easily observed due to low concentration of SiO2.
3.4 IR second derivative spectra of silicate-bearing sodium aluminate solutions
FTIR second derivative spectra can identify the exact positions of all absorption and shoulder peaks from original IR spectra. Based on Fig. 3, the second derivative spectra of the silicate-bearing sodium aluminate solutions are shown in Figs. 5 and 6.
Compared with the peak number in Fig. 3, new peaks can be found over the range of 400-1100 cm-1 in Figs. 5-6. For silicate-free solution, more new weak peaks (466 cm-1, 492 cm-1, 526 cm-1 and 555 cm-1) overthe range of 460-590 cm-1 can be observed, confirming the overlap of the peaks centering at about 535 cm -1. For silicate-bearing solution of 225 g/L, αk=2.8, peaks at 883, 832, 721 and 625 cm-1 are always observed (in Fig. 5), while peaks at 533 cm-1, 789 cm-1 and 855 cm-1 disappear. Meanwhile, a new peak at 793-807 cm-1 appears when SiO2 concentration increases. For silicate- bearing solution of =160 g/L, αk=1.4, peaks at 891, 829, 721 and 625 cm-1 can be found while the peaks at 530 cm-1 and 788 cm-1 disappear (in Fig. 6). However, the weak peak at 803 cm-1, as well as at 543 and 575 cm-1, can be observed.
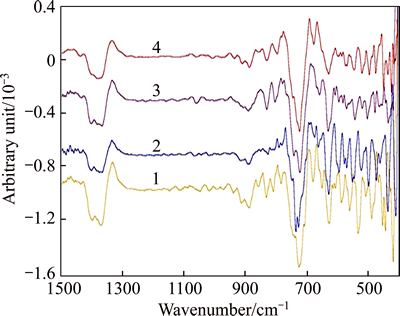
Fig. 5 IR second derivative spectra of solution-GL at αk of 2.80 (solution composition: =225 g/L, αk=2.80, of 0, 0.5, 1 and 3 g/L from bottom to top)
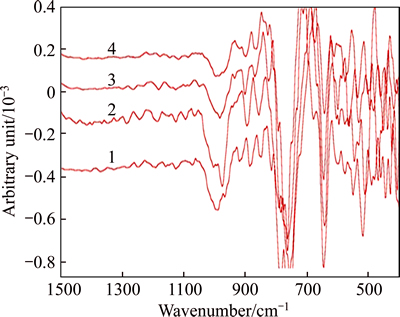
Fig. 6 IR second derivative spectra of solution-GL at αk of 1.40 (solution composition: =160 g/L, αk=1.40, of 0, 0.5, 2 and 3 g/L from bottom to top)
Except for the Al―O or Al―OH bond vibration occurring at about 880, 721, 635 cm-1, the new peak at about 800 cm-1 is assigned to Al―O―Si bond of alumino- silicate anion, which is due to Si―O in SiO4 substituted by Al―O [29-30]. The new peaks at 543 and 575 cm-1 are also attributed to the Si―O―Si or Al―O―Si bond [29-30], owing to the larger dipole moment of Al―O bond as compared with the Si-O bond vibration at 535 cm-1.
Similarly, the second derivative spectra of solution-SS, based on Fig. 4, are presented in Figs. 7 and 8.
As shown in Figs. 7 and 8, a remarkable difference in structures can be observed in comparison with Fig. 4. For silicate-bearing solutions of αk of 1.4, of 160 g/L, peaks at 1064, 883, 824, 717, 629 cm-1 are also found, but the weak peak at 534 cm-1 disappears and more weak peaks appear at 559-565 cm-1. For silicate- bearing solutions of αk of 2.8, of 220 g/L, peaks at 1064, 883, 829, 721, 629 and 543 cm-1 are always observed at different SiO2 concentrations, and the weak peaks at 859 cm-1 and 803 cm-1 also appear at the SiO2 concentration of 3 g/L.
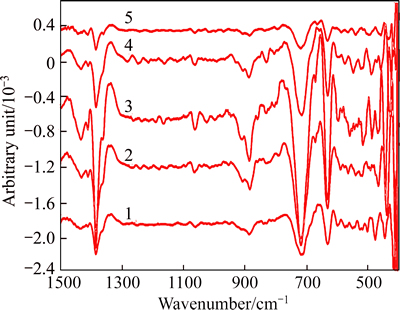
Fig. 7 IR second derivative spectrum of solution-SS at αk of 1.50 (solution composition: =160 g/L, αk=1.50, of 0, 0.5, 1, 2 and 3 g/L from bottom to top)

Fig. 8 IR second derivative spectrum of solution-SS at αk of 2.80 (solution composition: g/L, αk=2.80, of 0, 0.5, 1, 2 and 3 g/L from bottom to top)
The new peak at 1064 cm-1 is assigned to Q3 polymeric silicate anions, and the weak peak at 803 cm-1 also emerges at of 3 g/L. These results suggest that Q3 polymeric silicate anion occurs in solution-SS, and increasing concentration of SiO2 also benefits the formation of the alumino-silicate anions.
Therefore, alumino-silicate anion in solution-GL and Q3 polymeric silicate anion in solution-SS occurs predominantly, being in good agreement with the results of Raman spectra. In addition, there is a overlap of peaks at about 535 cm-1 in sodium aluminate solution
3.5 Relationship of desilication ratio and silicate structure
Al(OH)4- anion is predominant in sodium aluminate solution [1, 7, 26], and its concentration is much greater than SiO2 concentration owing to high A/S of solution. Thus, the concentration of Al(OH)4- can be approximately considered as a constant concentration for a given solution. Meanwhile, the ratio of peak areas of the silicate anions to the peak areas of the characteristic peak of Al(OH)4- is employed to semi-quantitatively present the concentration variation of the silicate anions on basis of the strong peak of Al(OH)4- at about 720 cm-1. The influence of SiO2 concentration on the area ratio of the peak of 800 cm-1 to 720 cm-1 could be seen for solution-GL in Fig. 9, whilst area ratio of the peak of 1064 cm-1 to the peak of 720 cm-1 for solution-SS is presented in Fig. 10.
Figure 9 shows that the peak area increases with increasing SiO2 concentration for solution-GL, and that it increases remarkably for solution αk of 1.4, of 160 g/L in comparison with solution αk of 2.8, of 200 g/L. This suggests that the alumino-silicate anion is easily formed in solution-GL. Moreover, increasing SiO2 concentration significantly promotes the formation of alumino-silicate anion.
In contrast, the peak area ratio also goes up remarkably and then rises slowly with increasing concentration of SiO2 for solution-SS (Fig. 10). Furthermore, the area ratio increases more significantly for solution of αk of 2.8, of 200 g/L, suggesting that Q3 polymeric silicate anion occurs in the solution-SS, especially in solution with low concentration of alumina.In addition, increasing SiO2 concentration also benefits the formation of alumino-silicate anions in the solution-SS owing to peaks at 803 cm-1 being also observed. For example, peak area ratio of 803 cm-1 to 721 cm-1 is 0.024 for solution with 2 g/L SiO2 and that for 3 g/L SiO2 is 0.027, respectively.

Fig. 9 Dependence of SiO2 concentration on peak area ratio in solution-GL (silicate-bearing aluminate solution: of 160 g/L, peak area ratio represents area ratio of peak at 800 cm-1 to peak at 720 cm-1)
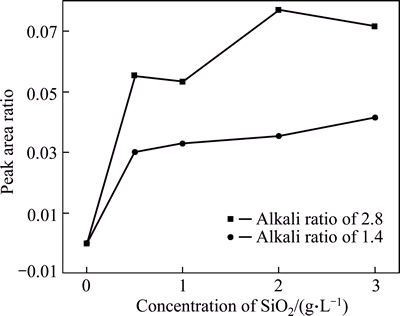
Fig. 10 Dependence of SiO2 concentration on peak area ratio in solution-SS (silicate-bearing aluminate solution: of 160 g/L, peak area ratio represents peak at 1064 cm-1 Q2 or Q3 to peak at 720 cm-1)
Results from Raman spectra and the second derivative spectra of FTIR indicate that alumino-silicate anion occurs in solution-GL while Q3 polymeric silicate anion in the solution-SS. Since desilication ratio in solution-GL is much less than that in solution-SS as mentioned above, it is inferred that the alumino-silicate anion accounts for the low desilication ratio of solution-GL, while polymeric silicate anion will benefit the desilication process.
4 Conclusions
1) Desilication ratio in the solution-SS is much greater than that in the solution-GL with adding CHAC, and increase of alumina concentration decreases the desilication ratio.
2) Based on the Raman spectra and the second deviation of FTIR, much alumino-silicate anions, Q3 polymeric silicate anions can be found in solution-GL and solution-SS, respectively. Increasing SiO2 concentration also favors respectively the formation of alumino-silicate anions or Q3 polymeric silicate anion. In addition, alumino-silicate anions can be formed at SiO2 concentration over 2 g/L in solution-SS. Therefore, low desilication ratio in solution-GL is attributed to the existence of alumino-silicate anion.
References
[1] BARNES M C, ADDAI-MENSAH J, GERSON A R. The kinetics of desilication of synthetic spent Bayer liquor seeded with cancrinite and cancrinite/sodalite mixed-phase crystals [J]. Journal of Crystal Growth, 1999, 200(1/2): 251-264.
[2] WHITTINGTON B I. The chemistry of CaO and Ca(OH)2 relating to the Bayer process [J]. Hydrometallurgy, 1996, 43(1/2/3): 13-35.
[3] ZHENG K L, SMART R, ADDAI-MENSAH J, GERSON A. Solubility of sodium aluminosilicates in synthetic Bayer liquor [J]. Journal of Chemical and Engineering Data, 1998, 43: 312-317.
[4] MA Jia-yu, ZHAI Kun-ming, LI Zhi-bao. Desilication of synthetic Bayer liquor with calcium sulfate dihydrate: Kinetics and modeling [J]. Hydrometallurgy, 2001, 107(1/2): 48-55.
[5] LIU Gui-hua, QI Tian-gui, TIAN Lu, ZHOU Qiu-sheng, PENG Zhi-hong, LI Xiao-bin. Reaction behavior of MgO in desilication process of sodium aluminate solution [J]. The Chinese Journal of Nonferrous Metals, 2013, 23(7): 2055-2060. (in Chinese)
[6] WU Zheng-ping, YIN Zhou-lan, CHEN Qi-yuan, LIANG Cheng. Effect of silicon-containing impurity on precipitation of sodium aluminate solution and interaction mechanism [J]. The Chinese Journal of Nonferrous Metals, 2008, 18(12): 2275-2283. (in Chinese)
[7] SIZYAKOV V M, VOLOKHOV Y A. Study of structure and properties of alumino-silica component in aluminate liquors [J]. Light Metals, 1983: 223-227.
[8] SIPOS P. The structure of Al(III) in strongly alkaline aluminate solution―A review [J]. Journal of Molecular Liquid, 2009, 146: 1-14.
[9] LIU Miao-xiu, ZHOU Pei-fang, CHEN Nian-yi. Study of existence situation of SiO2 in sodium alumina solution [J]. Acta Metallurgica Sinica B, 1990, 26(3): 146-149. (in Chinese)
[10] GOUT R, POKROVSKI G S, SCHOTT J, ZWICK A. Raman spectroscopic study of aluminum silicate complexes at 208 °C in basic solutions [J]. Journal of Solution Chemistry, 2000, 29(12): 1173-1186.
[11] YANG X F, ROONASI P, HOLMGREN A. A study of sodium silicate in aqueous solution and sorbed by synthetic magnetite using in situ ATR-FTIR spectroscopy [J]. Journal of Colloid and Interface Science, 2008, 2(28): 41-47.
[12] TARTE P. Infrared spectra of inorganic aluminates and characteristic vibrational frequencies of AlO4 tetrahedra and AlO6 octahedra [J]. Spectrochimica Acta A, 1967, 23(7): 2127-2143.
[13] EFIMOV A M, POGAREVA V G. IR absorption spectra of vitreous silica and silicate glasses: The nature of bond in the 1300 to 5000 cm-1 region [J]. Chemical Geology, 2006, 229: 198-217.
[14] SIMONSEN M E, S NDERBY C, Li Z S, SGAARD E G. XPS and FT-IR investigation of silicate polymers [J]. Journal of Material Science, 2009, 44: 2079-2088.
[15] YUAN Mei-rong, LU Jin-tang, KONG Gang, CHE Chun-shan. Effect of silicate anion distribution in sodium silicate solution on silicate conversion coatings of hot-dip galvanized steels [J]. Surface and Coatings Technology, 2011, 205: 4466-4470.
[16] GAGGIANO R, GRAEVE I D, MOL J M C, VERBEKEN K, KESTENS L A I, TERRYN H. An infrared spectroscopic study of sodium silicate adsorption on porous anodic alumina [J]. Surface and Interface Analysis, 2013, 45: 1098-1104.
[17] SWADDLE T W. Silicate complexes of aluminum(III) in aqueous systems [J]. Coordination Chemistry Reviews, 2001, 219: 665-686.
[18] HALASZ I, AGARWAL M, LI R B, MILLER N. What can vibrational spectroscopy tell about the structure of dissolved sodium silicate [J]. Microporous and Mesoporous Material, 2010, 135: 74-81.
[19] VALERIA B, KENNETH M, CLELIO T. Synthesis and characterization of materials based on inorganic polymers of alumina and silica: Sodium polysialate polymers [J]. International Journal of Inorganic Materials, 2000, 2(40): 309-317.
[20] LI Xiao-bin, WANG Dan-qin, ZHOU Qiu-sheng, LIU Gui-hua, PENG Zhi-hong. Concentration variation of aluminate ions during the seeded precipitation process of gibbsite from sodium aluminate solution [J]. Hydrometallurgy, 2011, 106: 93-98.
[21] BARNES M C, ADDAI-MENSAH J, GERSON A R. The solubility of sodalite and cancrinite in synthetic spent Bayer liquor [J]. Colloids and Surfaces A: Physicochemical and Engineering Aspects, 1999, 157: 101-116.
[22] MA Jia-yu, LI Zhi-bao, ZHANG Yi, DEMOPOULOS G P. Desilication of sodium aluminate solution by Friedel’s salt (FS: 3CaO・A12O3・CaCl2・10H2O) [J]. Hydrometallurgy, 2009, 99(3/4): 225-230.
[23] ZHANG Yi-fei, LI Ying-hui, ZHANG Yi. Supersolubility and induction of aluminosilicate nucleation from clear solution [J]. Journal of Crystal Growth, 2003, 254(1/2): 156-163.
[24] MA Shu-hua, ZHENG Shi-li, XU Hong-bin, ZHANG Yi. Spectra of sodium aluminate solutions [J]. Transactions of Nonferrous Metals Society of China, 2007, 17: 853-857.
[25] WANG Ya-jing, ZHAI Yu-chun, TIAN Yan-wen. IR and Raman spectrum of sodium aluminate solution and SiO2 containing sodium aluminate solution [J]. The Chinese Journal of Nonferrous Metals, 2003, 13(2): 271-274. (in Chinese)
[26] WANG Ya-jing, ZHAI Yu-chun, TIAN Yan-wen, HAN Yue-xin, LIU Lian-li. Variation of surface tension of sodium aluminate solution with electrolytic microstructure [J]. The Chinese Journal of Process Engineering, 2003, 3(2): 121. (in Chinese)
[27] PAN Feng, YU Xue-hui, MO Xuan-xue, YOU Jing-lin, WANG Chen, CHEN Hui, JIANG Guo-chang. Raman active vibration of aluminosilicates [J]. Journal of the Chinese Ceramic Society, 2007, 35(8): 1871-1875. (in Chinese)
[28] MCMILLAN P, PIRIOU B, NAVROTSKY A. A Raman spectroscopic study of glasses along the joins silica-calcium aluminate, silica-sodium aluminate, and silica-potassium aluminate [J]. Geochimica et Cosmochimica Acta, 1982, 46(11): 2021-2037.
[29] ZHAI Yu-chun, TIAN Yan-wen, WANG Ya-jing, LIU Lian-li. Study on structure and character of silicon dioxide containing sodium aluminate solutions [J]. Journal of the Chinese Rare Earth Society, 2004, 22(S1): 113-116. (in Chinese)
[30] WATLING H. Spectroscopy of concentrated sodium aluminate solution [J]. Journal of Applied Spectroscopy, 1998, 52(2): 250-258.
(Edited by FANG Jing-hua)
Foundation item: Project(51274242) supported by the National Natural Science Foundation of China; Project(2015CX001) supported by the Innovation-driven Plan in Central South University, China
Received date: 2015-04-07; Accepted date: 2015-09-28
Corresponding author: QI Tian-gui, PhD; Tel: +86-731-88830453; E-mail: qitiangui@csu.edu.cn

