J. Cent. South Univ. (2017) 24: 2475-2485
DOI: https://doi.org/10.1007/s11771-017-3659-6

Squeezing rock conditions at phyllite-slate zone in Golab water conveyance tunnel, Iran: A case study
Rahmati Asghar, Faramarzi Lohrasb, Darbor Mohammad
Department of Mining Engineering, Isfahan University of Technology, Isfahan, 84156-83111, Iran
 Central South University Press and Springer-Verlag GmbH Germany 2017
Abstract: Squeezing ground in tunneling is associated with large deformation of the tunnel face. In this study, squeezing characteristics of the ground and rock conditions in Golab water conveyance tunnel, Iran, are discussed and the classification of squeezing behavior around zones where the problems occurred is presented. The squeezing conditions were investigated using empirical and semi empirical methods. In the next step, creep convergence of the tunnel with Burger��s model was simulated by the numerical method. Numerical analysis showed that wall displacement (64.1 mm) of the Golab tunnel was more than allowable strain (1% of the tunnel diameter), therefore, it was found that squeezing phenomenon could exist, leading to the failure of the support system. Numerical analysis at the phyllite-slate zone also showed squeezing conditions due to the weakness of rock mass and high overburden that this situation cause failure in the segmental lining. In this research, failure in segmental lining in phyllite-slate zone verified the results of the numerical modeling.
Key words: squeezing; large deformation; Burger��s model; numerical analysis; failure; segmental lining
1 Introduction
One of the most important factors in weak rock masses that can cause problems in tunneling is the squeezing phenomenon. Squeezing is a unique problem faced by rock engineers while excavating tunnels through rock masses of very poor quality under high rock cover. Weak and schistose rocks like mudstone, shale, slate, phyllite, schist, highly schistose and sheared rocks and the rock mass of the tectonic fault zones are incapable of sustaining high stresses [1]. High deformability, low shear strength and the high in situ stress state are the major factors that govern the tunnel wall stability and extent of closure. Prediction of squeezing conditions is of great importance to a designer for designing a stable support system of the tunnel [2, 3]. Some reseqrchers proposed a constitutive model to pridict squeezing of rock. To demonstrate the practical applicability of this constitutive model, they used to predict the squeezing of rock observed and measured at three different instrumented sections of a tunnel [4]. In the rock mechanics literature, squeezing is a time-dependent large deformation around the tunnel which is associated with creep by exceeding a limiting shear stress [5, 6]. Squeezing phenomenon was previously investigated by TERZAGHI [7], SINGH et al [8], DUBE [9], AYDAN et al [10, 11], SCHUBERT [12], BARTON and GRIMSTAD [13] and GOEL et al [14]. They showed that squeezing condition could be defined as a reduction in the cross-sectional area of an underground opening due to a large deformation. In this study, in addition to the numerical modeling, prediction of squeezing has been done using empirical and semi empirical methods [8, 14, 15]. Numerical simulation provides a flexible environment to test the behavior of a rock mass, namely, various parameters can be modified as per requirement and need of the actual problem [16]. Numerical investigations, as well as reference to practical experience, were carried out by RAMONI and ANAGNOSTOU [17�C20]. Extreme convergences could also produce long term problems associated with floor heave or support failures [21]. There are five linear viscoelastic models: Maxwell model, Kelvin model, generalized Maxwell model, generalized Kelvin model and Burger��s model [22]. In this work, by using numerical modeling and Burger��s creep model, the phyllite-slate zone in the Golab water conveyance tunnel was modeled. Therefore, the Burger��s model was used to simulate rock mass behavior. The triaxial creep tests were used to determine the Berger��s parameters and then these parameters were used in numerical modeling. Therefore, displacement of the tunnel wall and crown were obtained. The numerical results indicated that the displacements in Golab tunnel were very high. Finally, in Golab water conveyance tunnel, segmental lining due to extreme convergence of squeezing conditions was cracked.
2 Project descriptions
The Golab water conveyance tunnel is located in Isfahan province, at the coordinates of 50.75E longitude and 32.79N latitude. This tunnel is situated in south-eastern part of the Zayandeh-roud regulation dam, Isfahan province, Iran. The whole-section with double shield TBM was selected for the project. Golab tunnel, with a diameter of 4.5 m, has been excavated to transfer 23 m3/s water from Zayandeh-roud River to the center part of Iran. The tunnel length is approximately 10.5 km, including the main tunnel, access tunnel and underground pumping station. The main tunnel will be supplied by intake structure to be constructed near the Zayandeh-roud regulation dam. Water flows for about 9 km in the main tunnel, being transferred to the pumping station. Then, it is pumped by the installed pipeline in the access tunnel, which has a length of about 1.5 km, to a refinery built near the portal of access tunnel. Finally, the pipeline will transfer water to Kashan.
2.1 Geology of tunnel
The geological formation of the project area was deposited during the Jurassic period. Formation units of the Golab tunnel mainly include: schist, phyllite, slate, shale, limestone, metamorphic sandstone, siltstone, igneous rocks (diorite, monzodiorite and aplite dyke) and metamorphic rocks (granite, gneiss, metadiorite and metavolcanic). Since squeezing condition is investigated in phyllite-slate zone in this work, this geological profile (chainages 6.5�C8.1 km) is shown in Fig. 1. The rock formations of the Golab tunnel in chainages (6+500) m�C (8+100) m are composed of phyllite, slate and monzodiorite. The lithological conditions of these chainages that include monzodiorite rocks (the left wall of the tunnel), and the slate-phyllite rocks (the right wall and roof of the tunnel), are shown in Fig. 2. Also, the view of tunnel face in this cross-section has been shown in Fig. 2(d).
2.2 Mechanical properties of rock material
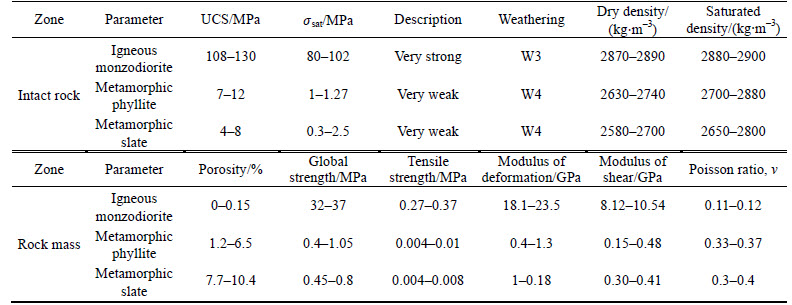
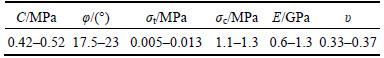
A number of laboratory rock mechanics tests have been performed on rock samples selected from the drill cores of the exploratory boreholes at Golab tunnel. The laboratory tests were performed to determine the density, porosity, uniaxial compressive strength (UCS), modulus of elasticity and Poisson ratio. Also, in this work, the weathering degree was proposed by the ISRM method [23], which proposes five degrees of weathering: W1 (fresh rock with no signs of weathering), W2 (slightly weathered rock with discoloration in discontinuity surfaces), W3 (moderately weathered rock with less than half of the rock decomposed), W4 (highly weathered rock with more than half of the material being transformed to soil) and W5 (completely weathered rock with all material being transformed to soil but the original mass structure still being intact). The test results are given in Table 1. Rock mass characteristics were obtained from Rocklab software, which are used as inputs for the numerical analysis. In Table 1, the general stability description from rocks in phyllite-slate zone has been presented in accordance with ISRM method.
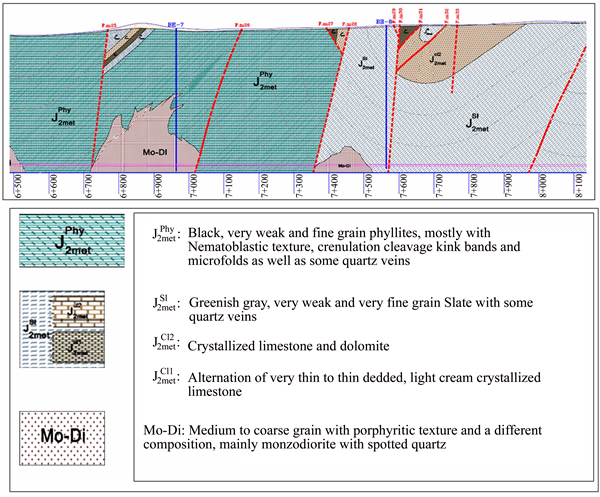
Fig. 1 Longitudinal geological profile along Golab tunnel route from chainage 6.5�C8.1 km
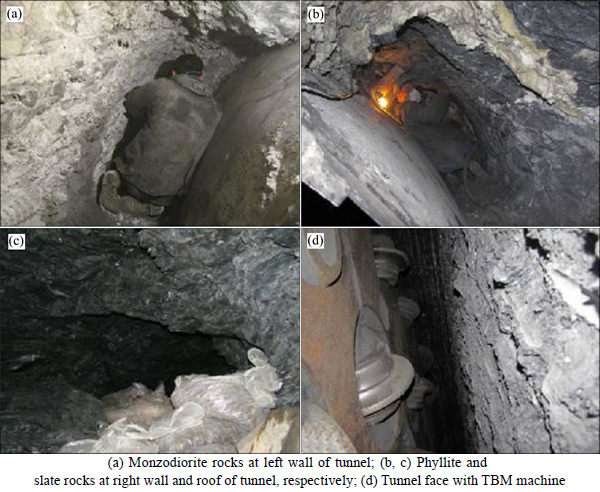
Fig. 2 A general view of rock formations around tunneling areas:
Table 1 Physical and mechanical properties of phyllite-slatezone
2.3 Rock mass classification
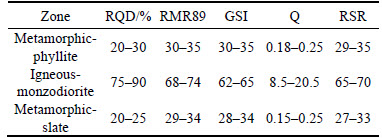
By geological survey of discontinuities and intact rock properties, geological units of metamorphic- phyllite, igneous-monzodiorite and metamorphic-slate have been classified using RMR, RQD, Q, GSI and RSR classification systems. The results of these classifications are listed in Table 2. The values of rock quality designation (RQD), as obtained from the core logs of borehole drilling along this tunnel, showed that this value ranged from 20% to 90%. Evaluation of the rock mass rating (RMR) system for classification of the igneous rocks (monzodiorite), phyllite and slate rocks showed that this rating varied from (68�C74) to (29�C35). However, for the phyllite and slate rocks, RMR values were less than 40. Also, values of GSI, Q and RSR classification systems indicated that phyllite-slate zone was weak.
Table 2 Rock classification systems for igneous-monzodiorite, metamorphic-phyllite and metamorphic-slate zones
3 Geological problems in Golab tunnel
In this section, the unfavorable geological conditions with the difficulties and obstacles have been studied.
3.1 Squeezing
Squeezing behavior of the ground was investigated using empirical and semi empirical methods. SINGH et al [8] used a clear cut demarcation line to differentiate squeezing cases from non-squeezing ones. The equation of this line is:
 (1)
(1)
where Q is rock mass quality. The results of this empirical method graphically are shown in Fig. 3. In this figure, the points are at the top of the H line (H=350Q1/3) and points that are under the H line are in squeezing and non-squeezing conditions, respectively. The results of analysis for Golab tunnel using the rock mass properties and tunnel overburden at phyllite-slate zone based on Eq. (1) indicated that phyllite-slate zone had the squeezing potential. Also, in particular, HOEK and MARINOS [24, 25] showed that a plot of tunnel strain ��t (defined as the percentage ratio of tunnel closure to tunnel radius) versus the ratio ��cm/P0 could be used effectively to assess tunneling problems under squeezing conditions. In Hoek and Marinos method, ��cm and ��t are obtained from Eqs. (2) and (3), respectively.
 (2)
(2)
 (3)
(3)
where ��cm is uniaxial compressive strength of rock mass; ��ci is uniaxial compressive strength of intact rock; mi is Hoek-Brown constant; GSI is geological strength index; pi is internal support pressure; and p0 is in situ stress.
In this study, mi for phyllite and slate rocks was considered equal to 8. Also pi/p0 parameter is calculated from Fig. 4. This figure shows the influence of internal support pressure upon deformation of tunnels in weak ground. Classification of squeezing behavior according to HOEK [15] for Golab tunnel data analysis is shown in Fig. 5. This figure shows various levels of squeezing behavior, which can be categorized from few support problems (��t��1) to extreme squeezing (��t>10). The results of this research work indicate that the phyllite-slate zone has very severe squeezing to extreme squeezing problems (see Fig. 5).
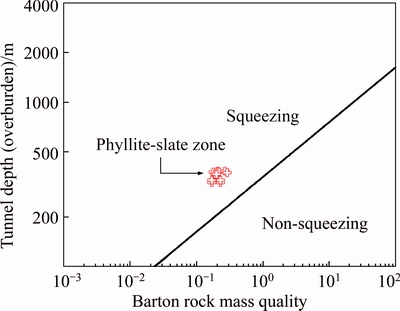
Fig. 3 Classification of squeezing behavior according to SINGH et al [8] for Golab tunnel
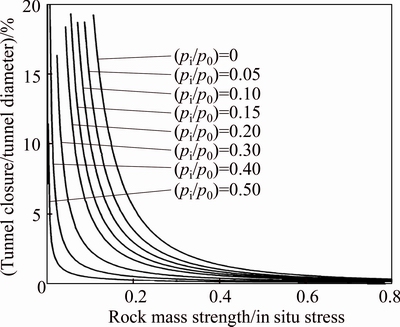
Fig. 4 Influence of internal support pressure upon deformation of tunnels in weak ground [15]
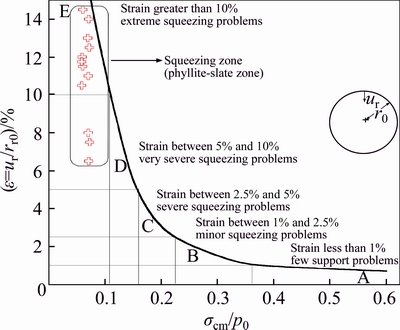
Fig. 5 Classification of squeezing behavior according to HOEK [15] for Golab tunnel
The other approach investigated in this study was GOEL et al [14] method, which is based on rock mass number, N. It is defined as: N=QSRF=1. In this method, a line demarcates the squeezing and non-squeezing cases. The equation of this line is:
H=(275N0.33)B�C1 (4)
The data points lying above the line represent squeezing conditions, whereas those below this line represent non-squeezing conditions (Fig. 6). Also, as can be seen in Fig. 6, GOEL et al [14] method indicates that the phyllite-slate zone has mild to moderate squeezing conditions.
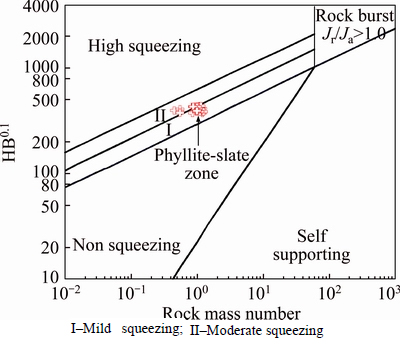
Fig. 6 Approach used by GOEL et al [14] (1995) for predicting squeezing conditions in Golab tunnel:
3.2 Disc cutter wear
TBM disc cutter consumption is shown in Fig. 7. As can be seen, when TBM is entered into the squeezing zone, disk consumption rate is increased. As Fig. 7 clearly indicates, the trend of disk cutter consumption rate in the first two kilometers of the tunnels is high due to the existence of the igneous rock, and this trend from chainage 2�C6 km is mild due to uniformly of the soft material. In chainage 6 km to the squeezing section (phyllite-slate section), this parameter increases because it enters into the squeezing section. Thus, the rate of disc consumption in chainages 0�C2 km, 2�C6 km and (7+0.0)�C (7+694) m (squeezing zone) is 0.0026 disc/m3,0.00075 disc/m3 and 0.0015 disc/m3, respectively. The important point is that in squeezing rock formations, discs fail to turn freely due to lack of enough friction between rock and disc cutter. Thus, disc consumption rate increases in this zone. Also, existence of vein and lens shape quartz in slate rocks that cause the excessive wear of disc cutter is another reason for the increase of disc consumption rate. A large number of quartz veins exist in the phyllite-slate zone in the tunnel route. These veins that are embedded in fractures and spaces with a few centimeters thickness are in phyllite-slate zone randomly. These veins were unknown and folded with lens shapes in phyllite and slate rocks. Quartz veins and lenses in phyllite-slate zone have been shown in Fig. 8.
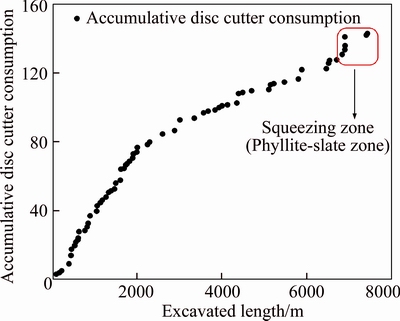
Fig. 7 Disc consumption during Golab tunnel excavation
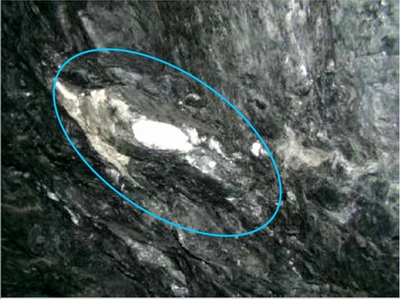
Fig. 8 Quartz veins and lenses in phyllite-slate zone in Golab tunnel route
4 In situ measurements
Measurements of tunnel convergence at the phyllite-slate zone in the Golab tunnel were performed to evaluate the rock mass condition. To achieve this, an instrument for measuring displacement was installed in chainage (7+600) m. Figure 9 shows a typical deformation curve at this station on the right wall of the tunnel. As shown in this figure the deformation increases gradually. And it accelerates after 1 year, showing a typical creep behavior. Also, another instrument station including strain and pressure gauges was installed on the rock mass in chainage (7+660) m. With successive readings of these instruments data, it was revealed that ground pressure was being exerted on the segments. The results of instruments have been shown in Figs. 10(a) and (b).
Changes in strain and pressure on the phyllite-slate zone versus time at the distance of 41 m from the broken segments are shown in Figs. 10(a) and (b). Figure 10(a) shows that the changes of strain in the walls are high, showing that the failure conditions of the walls have been provided. The plot for total strain on the right wall of the tunnel has negative value and on the left wall of the tunnel has positive value, in accordance with coordinate system as shown in Fig. 10(a). These negative and positive values indicate that the respective points of the tunnel are moving towards into the tunnel. Also, the value of total strain in roof is positive. This means that strain changes to the outside of the tunnel in roof.Fig. 10(b) shows the non-uniform distribution of pressure around the tunnel. This could mean that the distribution of gravel material injected behind the segmental support system maybe had a non-uniform condition.
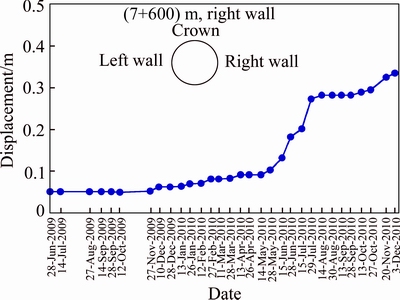
Fig. 9 Displacement vs time on right wall of tunnel at chainage (7+600) m
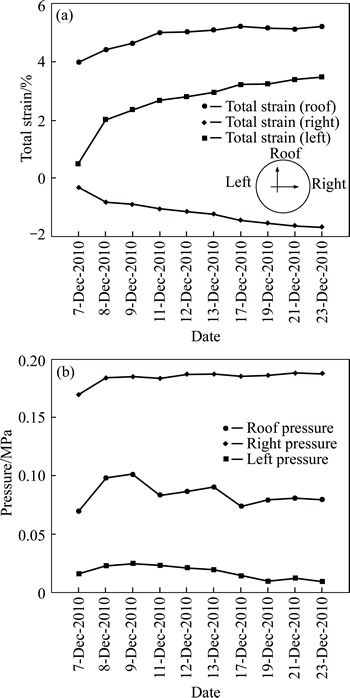
Fig. 10 Total strain (a) and pressure (b) vs time (day) in cross section around the squeezing zone (chainage (7+660) m)
5 Determination of Burger��s model parameters from triaxial creep test
One of the most important phenomena in time-dependent behavior is creep. In this study, Burger��s model for Golab tunnel rock mass was found to be appropriate. Berger��s model is shown in Fig. 11. In this study, a triaxial creep test was used to determine the Berger��s parameters. The triaxial creep test machine is shown in Fig. 12.
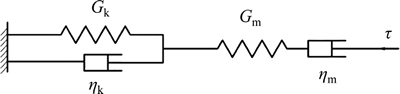
Fig. 11 Burger��s model [22]
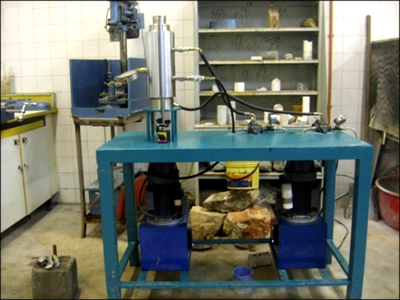
Fig. 12 A triaxial creep test machine
To perform triaxial creep test, phyllite and slate rocks samples were collected from drilled boreholes in Golab tunnel. The samples are prepared with 54 mm diameter and 110�C120 mm height which can be seen in Fig. 13. The phyllite and slate samples had low uniaxial compression strength and very high creep strain. As shown in Fig. 14, the creep test was conducted in different deviatoric stresses. The ����*�� symbol in this plot shows the failure point. Burger��s function has been checked by curve fitting to the creep data; the Burger��s function in Eq. (5) shows appropriate fit (see Fig. 15).
 (5)
(5)
where K is bulk modulus; Gk is Kelvin shear modulus; ��k is Kelvin viscosity; Gm is Maxvel shear modulus and ��m is Maxvel viscosity. Five parameters that must be determined in Burger��s creep model includes: K, Gm, ��m, Gk and ��k. K and Gm control instantaneous elastic behavior and are inherently independent of the time- dependent behavior but ��m; Gk and ��k are directly related to time-dependent behavior. Curve fitting to the creep data can be seen in Fig. 15. From this figure, it is seen that the coefficient of correlation R2=0.9636, indicates that the curve fitting of the data is well (see Fig. 15).
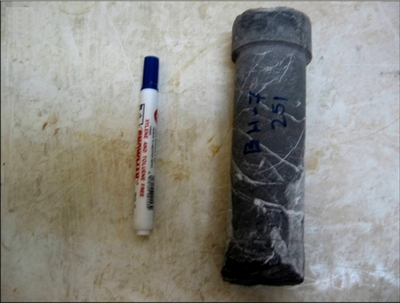
Fig. 13 Sample preparation for creep test
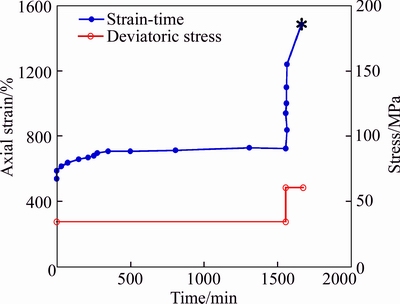
Fig. 14 Axial strain�Ctime curve and deviatoric stress for phyllite specimen in Golab tunnel
The coefficient of correlation of R2, which was close to 1.00, is the better fit of the Burger��s equation to the triaxial test data. The values of the Burger��s parameters determined based on triaxial creep tests are presented in Table 3. In this study, creep parameters extracted from the creep test were used for numerical modeling.
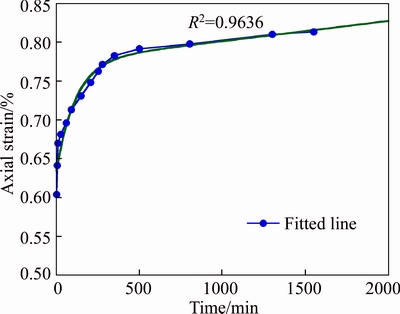
Fig. 15 Axial strain vs time for triaxial creep test and curve fitting for phyllite specimen in deviatoric stress equal to 5.5 MPa
6 Numerical modeling
One of the obvious advantages of numerical methods in the analysis and design of tunnels is squeezing rock conditions. The use of more complex stress�Cstrain models for the rock mass such as the strain softening behavior and time-dependent behavior, which can be implemented with both FEM (finite element method) and FDM (finite difference method). Numerical modeling of tunnel convergence at the phyllite-slate zone in the Golab water conveyance tunnel was accomplished using FLAC3D software, in a continuum medium. This modeling was done in order to simulate tunnel deformation and creep behavior of the phyllite-slate zone. In this work, for numerical modeling, the Burger��s model was used, as described in the previous section. For time-dependent phenomena such as creep and squeezing, FLAC3D program allows users to define a time step. The maximum time step for Burger��s creep model by Eq. (6) is defined as [26]
 (6)
(6)
Creep modeling for Golab tunnel was performed for a period of 100 d.
6.1 Numerical modeling description
To investigate the influence of squeezing rock conditions on the stability of the Golab tunnel, numerical modeling was performed. Lining support and Burger��s creep model were characteristics of the tunnel deformation modeling. The properties of segmental support system as input data of lining are given in Table 4. To avoid the effect of boundary conditions and consider the 4.5 m diameter of the tunnel, the numerical models were constructed for a length of 40 m, a width of 40 m, and a height of 40 m (Fig. 16). Figure 16 show the models generated for the numerical analysis. In this numerical modeling, the optimum mesh density around the tunnel was generated. The value of mass density was 2700 kg/m3 for the rocks at the phyllite-slate zone, and 10.5 MPa stress, equal to the overburden weight in Y direction, were applied on the top of the model. Schematic of this modeling is shown in Fig. 17. The Mohr�CCoulomb criterion was applied as a failure criterion for rock masses to solve the model. The geomechanical and creep data used for numerical modeling are given in Tables 5 and 6, respectively.
Table 3 Creep parameters extracted from the creep test
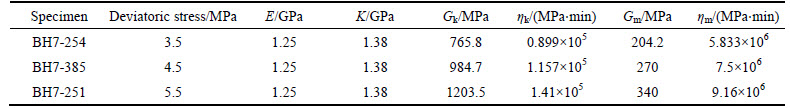
Table 4 Properties of segmental support system in Golab tunnel
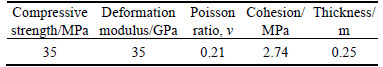
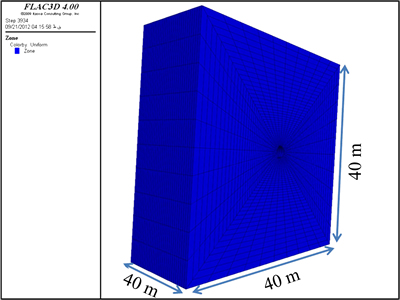
Fig. 16 A view of model geometry in FLAC3D with optimum mesh density for phyllite-slate zone
6.2 Results of numerical modeling
A practical tunnel design, utilizing the program FLAC3D, is presented. In the first stage, the complete model is with a horizontal top surface. The vertical stress is assumed to be due to gravity and it is calculated as the product of the depth below surface and the unit weight of the rock mass. The unbalanced force is shown in Fig. 18, It is sufficient to say that the model is in equilibrium when the maximum unbalanced force is small compared to the total applied forces in the problem. After solution,the displacement of the tunnel walls and the distribution of the plastic zones around the excavated tunnel are shown in Fig. 19. The creep convergence was measured using the two selected points on the tunnel��s periphery for 100 d as shown in Fig. 20. The results of numerical modeling for creep displacement and displacement without creep have been given in Table 6. From Table 6, it can be concluded that the displacement (creep and non- creep) of the tunnel wall was more than crown displacement.
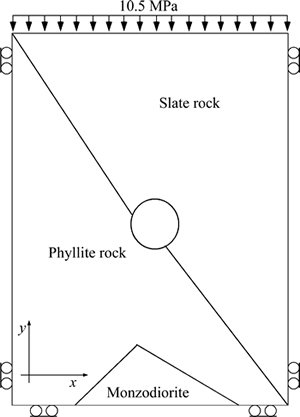
Fig. 17 Geometry and boundary condition of numerical model in 2D direction for squeezing zone in Golab tunnel
Table 5 Input data for numerical modeling
The plot of displacement at the tunnel crown and wall for phyllite-slate zone for the long-term (100 d) is shown in Fig. 20. Because the amount of this strain (64.1 mm, the total of creep and non-creep displacement, Table 6 and Fig. 20) is more than the allowable strain, 1% of the tunnel diameter (45 mm), this strain can show that squeezing conditions exist and lead to instability with the passage of time; then the secondary squeezing leads to failure in the support system. Reports and figures related to the support system indicate that the failure occurred in the tunnel wall segment. This phenomenon is quite in agreement with the results of numerical modeling. Also, it should be noted that the ratio of horizontal to vertical stresses (K0) is pointed out from different empirical equations, including: HOKE and BROWN [27], SINGH and GOEL [28], STEPHANSSON [29], SHEOREY [30, 31]. Then, K0 value was calculated based on these equations for phyllite-slate section of the tunnel that is shown in Table 7. As shown in Fig. 21, it can be seen that with increasing stress ratio (K0), creep convergence in the tunnel wall was increased. In this section of the Golab tunnel, increasing of tunnel convergences caused the failure of the segmental lining system in chainage (7+694) m (see Fig. 22). Also, it should be noted that TBM machine during excavation had been stuck in this chainage that this phenomenon is due to the squeezing condition, too.
Table 6 Horizontal and vertical displacements of tunnel wall and crown for a period of 100 days with creep data
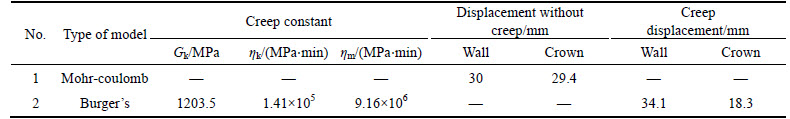
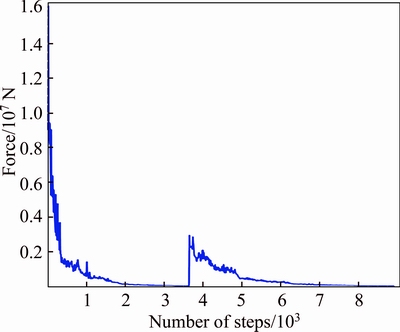
Fig. 18 Plot of unbalanced force in FLAC3D for phyllite-slate zone
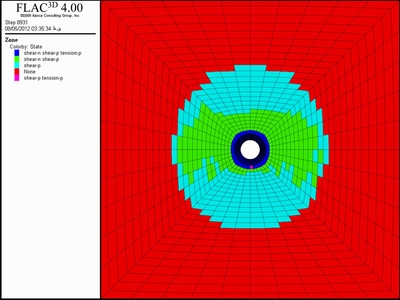
Fig. 19 Development of plastic zones around Golab tunnel in a section across phyllite-slate zone
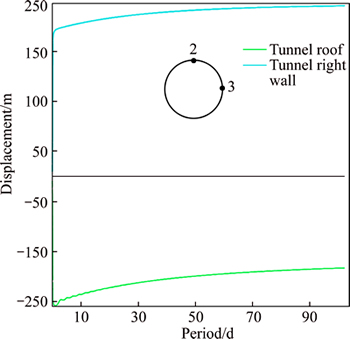
Fig. 20 Horizontal and vertical creep displacements of tunnel wall and crown for a period of 100 d
7 Conclusions
Laboratory tests, field measurements and site investigation, and numerical modeling of the tunnel deformation at the phyllite-slate zone in the Golab water conveyance tunnel clearly demonstrated the occurrence of large time-dependent displacement. These deformations, which occur around an underground opening, are referred to as ��squeezing rock conditions��. Squeezing phenomenon was investigated using empirical and semi empirical and numerical methods.In this study, the main factor of segment failure in phyllite-slate zone was diagnosed to be severe squeezing condition. Numerical results indicated that this zone had a high degree of convergence. Numerical analysis also showed that due to squeezing conditions, a heavy support system after excavation was required. Unstable ground and squeezing conditions created problems for excavation in Golab tunnel and it has caused that TBM machine in phyllite-slate zone was stuck several times. The squeezing conditions at phyllite-slate zone, which were investigated in this work, occurred due to the very weak rock masses, the high overburden of the rocks and creep properties of this zone. The increase in overburden depth was an important factor that intensified squeezing conditions. Unfavorable geological conditions (such as complex geological structures), could also enhance squeezing conditions at the phyllite-slate zone in Golab tunnel.
Table 7 K0 value for phyllite-slatesection of Golab tunnel
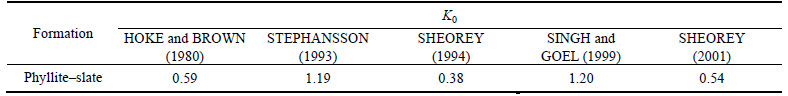
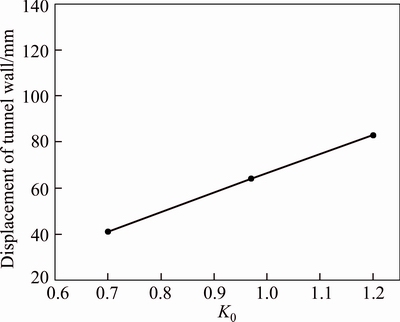
Fig. 21 Displacement of tunnel wall vs. K0 (ratio of horizontal stress to vertical stress)
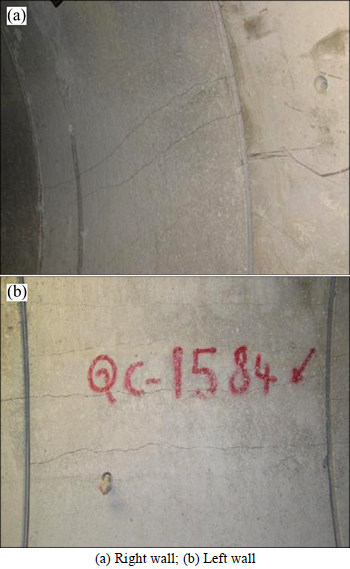
Fig. 22 Crack in segments in phyllite-slate zone (chainage (7+694) m):
Acknowledgments
The authors express their thanks to the Imensazan Consultant Engineers Institute for providing facilities and access to the data.
References
[1] BASNET C B. Evaluation on the squeezing phenomenon at the headrace tunnel of Chameliya hydroelectric project, Nepal [D]. Trondheim: Norwegian University of Science and Technology, 2013.
[2] RAMONI M, ANAGNOSTOU G. The interaction between shield, ground and tunnel support in TBM tunneling through squeezing ground [J]. Rock Mechanics and Rock Engineering, 2011, 44(1): 37�C61.
[3] SINGH M, SINGH B, CHOUDHARI J. Critical strain and squeezing of rock mass in tunnels [J]. Tunneling and Underground Space Technology, 2007, 22(3): 343�C350.
[4] SCUSSEL D, CHANDRA S. New approach to the design of tunnels in squeezing ground [J]. International Journal of Geomechanics, 2014, 14(1): 110�C117.
[5] BARLA G. Squeezing rocks in tunnels [J]. ISRM News Journal, 1995, 2(3, 4): 44�C49.
[6] DALGIC S. Tunneling in squeezing rock, the Bolu tunnel, Anatolian Motorway, Turkey [J]. Engineering Geology, 2002, 67(1, 2): 73�C96.
[7] TERZAGHI K. Rock defects and loads on tunnel supports [M]// PROCTOR R V, WHITE T L. Rock Tunneling with Steel Supports, 1946: 15�C99.
[8] SINGH B, JETHWA J L, DUBE A K, SINGH B. Correlation between observed support pressure and rock mass quality [J]. Tunneling and Underground Space Technology, 1992, 7(1): 59�C74.
[9] DUBE A K. Squeezing under high stress conditions, assessment and prevention of failure phenomena in rock engineering [M]. Rotterdam: Balkema, 1993.
[10] AYDAN O, AKAGI T, KAWAMOTO T. The squeezing potential of rocks around tunnels: Theory and prediction [J]. Rock Mechanics and Rock Engineering, 1993, 26(2): 137�C163.
[11] AYDAN O, AKAGI T, KAWAMOTO T. The squeezing potential of rocks around tunnels: Theory and prediction with examples taken from Japan [J]. Rock Mechanics and Rock Engineering, 1996, 29(3): 125�C143.
[12] SCHUBERT W, SCHUBERT P. Tunnels in squeezing rock: failure phenomena and counteractions [C]// International Symposium on Assessment and Prevention of Failure Phenomena in Rock Engineering. Istanbul, 1993: 479�C484.
[13] BARTON N, GRIMSTAD E. The Q-system following twenty years of application in NMT support selection [C]// 43rd Geomechanic Colloquy. Salzburg, Felsbau, 1994, 12(6): 428�C436.
[14] GOEL R K, JETHWA J L, PAITHANKAR A G. Tunneling through the young Himalayas�CA case history of the Maneri-Uttarkashi power tunnel [J]. Engineering Geology, 1995, 39(1, 2): 31�C44.
[15] HOEK E. Big tunnels in bad rock [J]. The ASCE Journal of Geotechnical and Geoenvironmental Engineering, 2001, 127(9): 726�C740.
[16] VERMA A K, SINGH T N. Assessment of tunnel instability��A numerical approach [J]. Arabian Journal of Geosciences, 2010, 3(2): 181�C192.
[17] RAMONI M, ANAGNOSTOU G. Tunnel boring machines under squeezing conditions [J]. Tunneling and Underground Space Technology, 2010a, 25(2): 139�C157.
[18] RAMONI M, ANAGNOSTOU G. Thrust force requirements for TBMs in squeezing ground [J]. Tunneling and Underground Space Technology, 2010b, 25(4): 433�C455.
[19] RAMONI M, ANAGNOSTOU G. The interaction between shield ground and tunnel support in TBM tunneling through squeezing ground [J]. Rock Mechanics and Rock Engineering, 2011a, 44(1): 37�C61.
[20] RAMONI M, ANAGNOSTOU G. The effect of consolidation on TBM shield loading in water-bearing squeezing ground [J]. Rock Mechanics and Rock Engineering, 2011b, 44(1): 63�C83.
[21] BARLA G, PELIZZA S. TBM tunneling in difficult ground conditions [M]. Geo Engineering 2000, International Conference on Geotechnical and Geological Engineering. Melbourne, 2000.
[22] GOODMAN R E. Introduction to rock mechanics [M]. New York: Wiley, 1989.
[23] ISRM. Methods for the quantitative description of rock masses and discontinuities [J]. International Journal of Rock Mechanics and Mining Sciences, 1978, 15: 319�C368.
[24] HOEK E, MARINOS P. Predicting tunnel squeezing problems in weak, heterogeneous rock masses, Part 1 [J]. Tunnels and Tunneling International, 2000, 32(11): 45�C51.
[25] HOEK E, MARINOS P. Predicting tunnel squeezing problems in weak heterogeneous rock masses, Part 2 [J]. Tunnels and Tunneling International, 2000, 33(12): 33�C36.
[26] Itasca consulting group. User manual for Flac3D [R]. Version 4. Minnesota, 2009.
[27] HOEK E, BROWN E T. Underground excavations in rock [M]. London: Institution of Mining and Metallurgy, 1980.
[28] SINGH B, GOEL R K. Rock mass classification: a practical approach in civil engineering [M]. U.K: Elsevier Science Ltd, 1999.
[29] STEPHANSSON O. Rock stress measurement by sleeve fracturing [C]// 5th International Congress Rock Mechanics. Melbourne, 1983: 129�C137.
[30] SHEOREY P R. A theory for in-situ stresses in isotropic and transversely isotropic rock [J]. International Journal of Rock Mechanics and Mining Sciences, 1994, 31(1): 23�C34.
[31] SHEOREY P R, MOHAN G M, SINHA A. Influence of elastic constants on the horizontal in situ stress [J]. International Journal of Rock Mechanics and Mining Sciences, 2001, 38(8): 1211�C1216.
(Edited by YANG Hua)
Cite this article as: Rahmati Asghar, Faramarzi Lohrasb, Darbor Mohammad. Squeezing rock conditions at phyllite-slate zone in Golab water conveyance tunnel, Iran: A case study [J]. Journal of Central South University, 2017, 24(10): 2475�C2485. DOI:https://doi.org/10.1007/s11771-017-3659-6.
Received date: 2016-06-24; Accepted date: 2016-09-29
Corresponding author: Faramarzi Lohrasb, Associate, Professor, PhD; Tel: +98�C311�C3915108; Fax: +98�C311�C3912776; E-mail: lfaramarzi@cc.iut.ac.ir

