J. Cent. South Univ. Technol. (2009) 16: 0096-0100
DOI: 10.1007/s11771-009-0016-4
Digital characterization and mathematic model of sodium penetration into cathode material for aluminum electrolysis
L? Xiao-jun(������)1, LI Qing-yu(������)1, 2, LAI Yan-qing(������)1, LI Jie(�� ��)1
(1. School of Metallurgical Science and Engineering, Central South University,Changsha 410083, China;
2. School of Chemistry and Chemical Engineering, Guangxi Normal University, Guilin 541004, China)
Abstract: The sodium expansion curves of semi-graphitic cathode and TiB2/C composite cathode with different TiB2 contents were measured with the improved Rapoport-Samoilenko apparatus. The mathematic model of the sodium expansion was deduced on the basis of the experimental results. The sodium expansion parameter (a) and penetration rate factor (Q), were introduced into the model. The model was validated with the experimental sodium expansion curves self-measured and reported. The results show that the variation tendency of the sodium expansion parameter (a) and penetration rate factor (Q) is consistent with that of the experimental curves. The model is capable of not only conveniently judging the cathode quality, but also favorably establishing a unified standard of the resistance to sodium penetration of cathode.
Key words: aluminum electrolysis; cathode; sodium expansion; modeling; characterization
1 Introduction
During aluminum electrolysis metallic sodium migrates into the carbon structure according to the following reaction [1-2]:
Al(l)+3NaF(in electrolyte)=3Na(in carbon)+AlF3(in electrolyte) (1)
or
Na++e=Na(in carbon) (2)
The main transport mechanism for the sodium penetration into the carbon material is probably by diffusion of sodium absorbed in micropores. However, vapor transport in the gas phase through macropores or transport by surface diffusion in the pores may be important as well for the sodium penetration. Anyway, the absorbed or intercalated sodium leads to carbon swelling (i.e. sodium expansion) which causes creep deformation and material damage, and subsequently shortens the cathode life. In early year, RAPOPORT and SAMOILENKO [3] reported a simple method to measure the sodium expansion of carbon materials due to sodium penetration. Since then, various modifications of the Rapoport-Samoilenko apparatus have been proposed [4-8]. The sodium expansion of carbon cathode is related to the following factors [9-12], such as current density, graphite content (carbon cathode composition), external pressure, cryolite ratio of electrolyte, temperature, and test apparatus.
The sodium expansion is a quantitative reflection of sodium penetration into carbon cathode. On the other hand, too fast penetration rate or too much sodium expansion may result in material damage, and sodium penetration rate has a greater impact on the cathode material failure. So both the penetration rate and sodium expansion should be involved to evaluate the extent of sodium penetration into carbon cathode since the latter only indicates the equilibrium of sodium penetration. Sodium expansion curve, however, is only a graph measured in laboratory. It is not convenient for charactering the performance of materials, or comparing among the cathode materials. Therefore, in this work, a mathematic model of sodium expansion with the electrolysis time was put forward on the basis of the experimental data, and the digital characterization for the resistance to sodium penetration into cathode was established as well.
2 Experimental
A modified Rapoport-Samoilenko apparatus was used to measure the sodium expansion of semi-graphitic cathode block and TiB2/C composite cathode materials with different TiB2 contents, as shown in Fig.1. The test system was placed in a vertical tube furnace and held at 980 �� under a nitrogen atmosphere. A constant current was provided during electrolysis by an SCR-1 DC power supply. The cylindrical cathode specimen was immersed into the cryolite electrolyte, and the immersion depth was 50 mm. The electrolysis was performed at a current density of 0.5 A/cm2 and temperature of 980 ��. The electrolyte was composed (mass fraction) of 14.5% NaF, 72.5% Na3AlF6, 5.0% CaF2, 8.0% Al2O3, the cryolite ratio was 4, and the test time was 1.5 h.
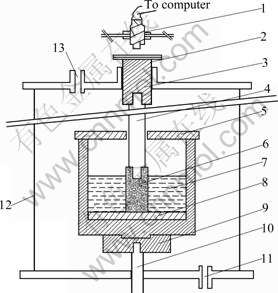
Fig.1 Apparatus for sodium expansion of cathode materials: 1��Transducer; 2��Gas outlet; 3��Graphite piston; 4��Steel rod; 5��Corundum lid; 6��Test specimen (Cathode); 7��Cryolite melt; 8��Corundum disk; 9��Graphite crucible (Anode); 10��Anode steel rod; 11��Gas inlet; 12��Furnace; 13��Gas outlet
The sodium expansion was calculated by the following equation:
��=?L/L (3)
where �� is the sodium expansion, %; ?L is the linear displacement of samples due to sodium penetration and is detected automatically by a computer through a transducer; and L is the depth immersed into bath.
3 Results and discussion
3.1 Sodium expansion of cathode
Under the same electrolysis condition, Figs.2 and 3 show the sodium expansion curves of semi-graphitic cathode and TiB2/C composite cathode with different TiB2 contents. In Figs.2 and 3, SG is semi-graphitic cathode sample, and TC0-TC60 are TiB2/C composite coatings with TiB2 contents of 0-60% on semi-graphitic cathode, respectively.
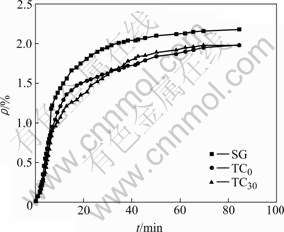
Fig.2 Sodium expansion curves of cathode samples during electrolysis
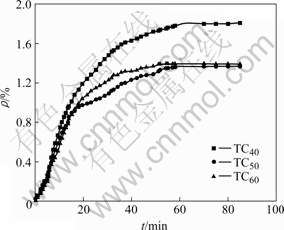
Fig.3��Sodium expansion curves of TiB2/C samples with different TiB2 contents during electrolysis
As can be seen from Figs.2 and 3, the sodium expansion curves show a parabolic shape. The growth rate of sodium expansion, i.e. the sodium penetration rate,increases faster at the beginning of the electrolysis, then decreases gradually, and finally keeps unchanged. The sodium penetration rate of sample SG is the fastest, and its equilibrium sodium expansion is also the largest. The penetration rate of sample TC0 sample is slightly smaller than that of sample SG, but the equilibrium sodium expansion approaches that of sample SG after electrolysis for 1.5 h. The sodium expansion rates of samples TC30, TC40, TC50, and TC60 are smaller than that of sample SG. With the increase of TiB2 content, the penetration rate of TiB2/C composite cathodes gradually slows down, and the equilibrium sodium expansion gradually decreases as well. The equilibrium sodium expansion of sample TC60 is the smallest, which is only around 60% of SG expansion.
3.2 Mathematic model
The sodium expansion of cathode material is a quantitative reflection of sodium penetration into material. The sodium expansion data are measured, which consist of curves of sodium expansion with electrolysis time (see Figs.2 and 3). The curves reflect not only the quantity of sodium expansion but also the sodium penetration rate.
Based on the measured curves of sodium expansion, some parameters to characterize the sodium penetration performance of cathode materials were found.
The following functions to describe the parabolic curves of sodium expansion were used,
 (4)
(4)
where y represents ��L/L, x represents time (t), and a and b are parameters.
When x����, y��a; when x��0, if b��0, then y��0, and y increases with the increase of x. In order to determine the parameters a and b, both sides of Eqn.(4) are taken the natural logarithm.
 (5)
(5)
According to Eqn.(5), the curve of ln(?L/L) versus t can be drawn, and the parameters a and b can be calculated through the intercept and slope of the curves.
When t=0, sodium expansion ��L/L=0. The boundary condition of Eqn.(4) is x��0, y��0, and not x=0, y=0. In order to avoid the initial point (0, 0), only the dots in the sodium expansion curves are adopted, rather than all dots collected by computer, which have no influence on the changing law of sodium expansion. The fitting curves were applied to the measured curves of samples SG, TC0, TC30, TC40, TC50, and TC60. The corresponding equations are obtained as follows:
 (6)
(6)
 (7)
(7)
 (8)
(8)
 (9)
(9)
 (10)
(10)
 (11)
(11)
The parameters a and b from the equations above are listed in Table 1. As we can see, the sodium penetration rate is related to both a and b. Given that Q equals a/b, a new parameter Q is calculated and also listed in Table 1.
From the discussion above, the equilibrium sodium expansions of TiB2/C composite cathodes are reduced with the increase of TiB2 content, and so are the penetration rates. As can be seen in Table 1, a and Q show the trend of decrease with the increase of TiB2 content, which match with the experimental curves. As can be known from Eqns.(4) and (5), t����, ��L/L��a, which indicates that a is the equilibrium value of sodium expansion under a certain electrolysis condition. The change trend of a in Table 1 is basically in concordance with the equilibrium sodium expansion measured in Figs.2 and 3. Apparently, the equilibrium expansion of sample SG is the largest, which declines gradually with the increase of TiB2 content, and that of sample TC60 is the minimum. Parameter Q is related to sodium penetration rate and named as the sodium penetration rate factor, which reflects the sodium penetration rate during the electrolysis from beginning to penetration equilibrium. Obviously, it is reasonable to characterize the resistance to sodium penetration of cathode materials with parameter a and factor Q.
Table 1 Characterization of sodium expansion by parameter a and factor Q
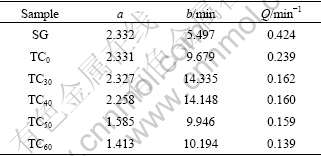
Parameter a and factor Q can not only characterize quantitatively the resistance to sodium penetration, but also get some experimental information which is difficult to get directly from the sodium expansion curve. From Table 1, it can be seen that parameter a of sample SG is almost the same as that of sample TC0, that is, the equilibrium sodium expansions of the two samples are basically the same. But the values of factor Q of the two samples are quite different. The factor Q of sample TC0 is significantly less than that of sample SG, which indicates that the coating with no TiB2 cannot change the equilibrium sodium expansion of sample SG, but it can reduce the sodium penetration rate. Parameter a of sample TC40 is larger than that of sample TC50, but their factors Q are almost the same, which indicates that the increase of TiB2 content at this level can reduce the equilibrium sodium expansions of TiB2/C composite cathodes, but cannot decrease the sodium penetration rate. An excellent resistance to sodium penetration into cathode material, should be the material with low equilibrium sodium expansion and penetration rate, i.e. small parameter a and factor Q. In Table 1, parameter a and factor Q of sample TC60 are the smallest.
3.3 Validation of digital characterization
Fig.4 shows sodium expansion of two amorphous carbon materials under the same electrolysis condition measured by S?RLIE and ?YE [13]. A series of dots were taken in Fig.4, and the data (ti, (?Li)) (i=1, ��, 12) were obtained. According to Eqn.(5), the fitting curves of sodium expansion for materials A and B are given as follows, respectively:
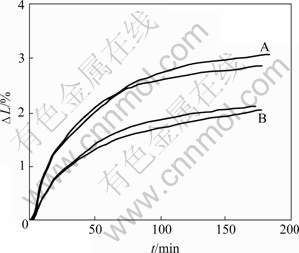
Fig.4 Sodium expansion of two amorphous carbon materials during aluminum electrolysis
 (12)
(12)
where parameter a is 2.921, and factor Q is 0.218 min-1.
 (13)
(13)
where parameter a is 2.106, and factor Q is 0.130 min-1. It can be seen that a and Q of material B are smaller than those of material A. This illustrates that the equilibrium sodium expansion and penetration rate of material B are less than those of material A, that is, the resistance to sodium penetration of material B is better than that of material A. This reflects the information of the measured curves. Therefore, it is a good way to characterize the resistance to sodium penetration into cathode material by parameter a and factor Q.
WIKENING [14] added non-carbonaceous additives to carbon cathode in order to improve the resistance to sodium penetration of material. Fig.5 shows the sodium expansion curves of carbon cathode with adding different FeSi25 contents. Four curves in Fig.5 are fitted and the following equations are obtained by Eqn.(5):
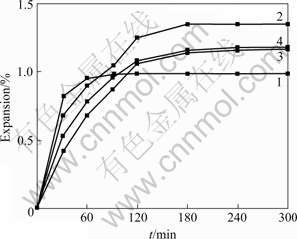
Fig.5 Rapoport expansion of bench-scale cathode blocks with addition of different FeSi25 contents: 1��0%; 2��5%; 3��10%; 4��15%
 (14)
(14)
 (15)
(15)
 (16)
(16)
 (17)
(17)
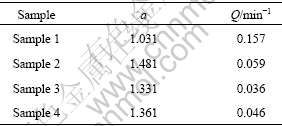
Parameter a and factor Q are listed in Table 2. As can be seen in Table 2, parameters a of samples 2, 3 and 4 with addition of FeSi25 5%, 10% and 15%, respectively, are larger than that of sample 1 without addition of FeSi25, while their factors Q are smaller than that of sample 1, which means that the penetration rate is reduced with addition of FeSi25 even though the equilibrium sodium expansion increases with the increase of FeSi25. But, factor Q appears the minimum value when 10% FeSi25 is added, that is, the penetration rate of material with adding 10% FeSi25 is the minimum. This is consistent with the information reflected by the measured curves. Again, it shows that it is convenient to characterize the sodium penetration performance of cathode material by parameter a and factor Q.
Table 2 Sodium penetration resistance of cathode block with different FeSi25 contents
4 Conclusions
(1) On the basis of the experimental results, mathematic model y=aexp(-b/x) of the sodium expansion is deduced, and parameter a and factor Q, which can numerically characterize the sodium expansion and penetration rate of material respectively, are introduced into the model.
(2) It is a good way to characterize the sodium penetration performance of cathode material by parameter a and factor Q through validation. It can not only conveniently judge the quality of carbon block as cathode and avoid the inconvenience to comparing the sodium penetration performance of different cathodes by the graph, but also favorably establish a unified standard for the resistance to sodium penetration of cathode.
References
[1] S?RLIE M, ?YE H A. Cathodes in aluminum electrolysis [M]. 2nd ed. D��sseldorf: Aluminum-Verlag, 1994.
[2] LI Qing-yu. Development and industrial application of wettable inert TiB2 cathodic composite coating for aluminum electrolysis [D]. Changsha: Central South University, 2003. (in Chinese)
[3] RAPOPORT M B, SAMOILENKO V N. Deformation of cathode blocks in aluminum baths during process of electrolysis [J]. Tsvetnye Metally, 1957, 30(2): 44-51.
[4] BRISSON P Y, SOUCY G. Revisiting sodium and bath penetration in the carbon lining of aluminum electrolysis cell [C]// KVANDE H. Light Metals 2005. Warrendale: The Minerals, Metals and Materials Society, 2005: 727-732.
[5] PEYNEAU J M, GASPARD J R, DUMAS D, SAMANOS B. Laboratory testing of the expansion under pressure due to sodium intercalation in carbon cathode materials for aluminum smelters [C]// CUTSHALL E R. Light Metals 1992. Warrendale: The Minerals, Metals and Materials Society, 1992: 801-808.
[6] SCHREINER H, ?YE H A. Sodium expansion of cathode materials under pressure [C]// EVANS J. Light Metals 1995. Warrendale: The Minerals, Metals and Materials Society, 1995: 463-470.
[7] LI Qing-yu, LAI Yan-qing, LI Jie, YANG Jian-hong, FANG Jing, CHEN Zhu. The effect of sodium-containing additives on the sodium-penetration resistance of TiB2/C composite cathode in aluminum electrolysis [C]// KVANDE H. Light Metals 2005. Warrendale: The Minerals, Metals and Materials Society, 2005: 789-791.
[8] LI Jie, FANG Jing, LI Qing-yu, LAI Yan-qing. Effect of TiB2 content on resistance to sodium penetration of TiB2/C cathode composites for aluminum electrolysis [J]. Journal of Central South University of Technology, 2004, 11(4): 400-404.
[9] LIAO X A, ?YE H A. Effects of carbon-bonded coatings on sodium expansion of the cathode in aluminum electrolysis [C]// EDWARD E. Light Metals 1999. Warrendale: The Minerals, Metals and Materials Society, 1999: 629-636.
[10] FANG Jing. Properties study and preparation of wettable inert TiB2/C composite cathode material for aluminum electrolysis [D]. Changsha: Central South University, 2004. (in Chinese)
[11] L? Xiao-jun. Study on the electrical conductivity, compressive strength and resistance to sodium penetration of TiB2-C composite cathode coating [D]. Changsha: Central South University, 2006. (in Chinese)
[12] BRILLOIT P, LOSSIUS L P, ?YE H A. Penetration and chemical reactions in carbon cathodes during aluminum electrolysis: Part ��. Laboratory experiments [J]. Metallurgical Transactions B, 1993, 24B(2): 75-89.
[13] S?RLIE M, ?YE H A. Laboratory testing of carbon cathode materials at operational temperatures [C]// CAMPBELL P G. Light Metals 1988. Warrendale: The Minerals, Metals and Materials Society, 1988: 625-631.
[14] WIKENING S. Some experiments in cathode carbon [C]// WELCH B. Light Metals 1998. Warrendale: The Minerals, Metals and Materials Society, 1998: 689-693.
Foundation item: Project(2005CB623703) supported by the Major State Basic Research and Development Program of China; Project(2008AA030502) supported by the National High-Tech Research and Development Program of China; Project(GUIKEJI0639032) supported by the Science Fund Project of Guangxi Province, China
Received date: 2008-09-17; Accepted date: 2008-11-20
Corresponding author: L? Xiao-jun, Doctoral candidate; Tel: +86-731-8876454; E-mail: lxj8886@yahoo.com.cn
(Edited by YANG You-ping)

