
J. Cent. South Univ. (2019) 26: 2634-2642
DOI: https://doi.org/10.1007/s11771-019-4200-x

Effect of composition and aging time on hardness and wear behavior of Cu-Ni-Sn spinodal alloy
S. ILANGOVAN, R. VAIRA VIGNESH, R. PADMANABAN, J. GOKULACHANDRAN
Department of Mechanical Engineering, Amrita School of Engineering, Coimbatore,Amrita Vishwa Vidyapeetham, India
 Central South University Press and Springer-Verlag GmbH Germany, part of Springer Nature 2019
Abstract: Copper alloyed with various compositions of nickel and tin were cast into molds under argon atmosphere. The cast rods were homogenized, solution heat treated, followed by aging for different time duration. The specimens were characterized for microstructure and tested for microhardness and wear rate. A hybrid model with a linear function and radial basis function was developed to analyze the influence of nickel, tin, and aging time on the microhardness and tribological behavior of copper-nickel-sin alloy system. The results indicate that increase in the composition of nickel and tin increases the microhardness and decreases the wear rate of the alloy. The increase in the concentration of nickel and tin decreases the peak aging time of the alloy system.
Key words: spinodal decomposition; microhardness; wear; radial basis function; model
Cite this article as: S. ILANGOVAN, R. VAIRA VIGNESH, R. PADMANABAN, J. GOKULACHANDRAN. Effect of composition and aging time on hardness and wear behavior of Cu-Ni-Sn spinodal alloy [J]. Journal of Central South University, 2019, 26(10): 2634-2642. DOI: https://doi.org/10.1007/s11771-019-4200-x.
1 Introduction
The melding of mechanical and tribological properties enables the usage of copper-nickel-tin (CNS) alloy in a variety of engineering applications [1]. CNS spinodally hardened alloys are apposite materials for load bearing applications such as bearings and wear plate. In such applications, wear is an inevitable phenomenon. The microstructure of CNS alloys can be altered to tailor the tribological properties of the alloy. Of late techniques like dispersion hardening, surface modification and spinodal hardening have been employed to strengthen the CNS alloys. However, spinodal hardening technique is predominantly functional for hardening the CNS alloys. Spinodal decomposition is the decomposition of unstable phase into solute-rich and solute lean regions in a pair of solids that do not combine at all quantities over all the temperature ranges [2].
The spinodal decomposition improves the yield strength of Cu-9Ni-6Sn alloy aged at various temperatures [3]. The presence and development of grain-boundary precipitates and spinodal decomposition reduces the yield strength of Cu-9Ni-6Sn alloy [4]. Investigations on the early stages of spinodal decomposition process in the Cu-9Ni-6Sn alloy revealed that the grain boundaries are the preferential sites for discontinuous reaction in the over-aged specimens [5]. The influence of temperature on the yield strength is higher in the quenched specimen than the aged Cu-10Ni-6Sn specimen [6]. The characteristics of wear debris in Cu-15Ni-8Sn alloy system subjected to sliding wear test were analyzed by SINGH et al [7].
Though many studies were performed to improve the tribological properties of CNS alloys, a comprehensive study on the influence of composition and aging time on the microhardness and tribological properties of CNS alloys is not available in the open literature. Hence, it becomes necessary to evaluate the properties of CNS alloy with respect to alloying composition and aging time. In this study, Cu was alloyed with the various compositions of Ni and Sn and subjected to heat treatment. The microhardness and wear rate of the solution heat treated (SHT) and aged specimens were measured. A hybrid model with a linear function and radial basis function was developed to analyze the influence of Ni, Sn, and aging time on the microhardness and tribological behavior of CNS alloy system.
2 Materials and methods
2.1 Materials
99.9% pure Cu, Ni, and Sn rods were utilized in this study. The electric melting furnace was used to melt the materials in a graphite crucible under an argon atmosphere. The molten alloy was transferred into molds at a pouring temperature of (1250��10) ��C. The castings were removed from the molds after solidification.
2.2 Heat treatment procedure
The cast rods were cleaned, degreased, and heat treated as described below: homogenization, solution heat treatment and aging heat treatment.
In an inert atmosphere, the cast rods were heat treated in a muffle type furnace. Homogenization was carried out at a temperature of 825 ��C, which is higher than the miscibility gap of CNS alloy, for a period of 10 h in a nitrogen atmosphere.
The homogenized rods were SHT at 825 ��C for 1 h and rapidly quenched below 200 ��C. The SHT rods were aged at 350 ��C (for 1, 2, 3, 4, 5 h) and then water quenched.
2.3 Microstructure and microhardness
The specimens were polished using metallographic sheets according to the standard ASTM E3�C11 and etched using an etchant made from 1.5 g of ferric chloride, 100 mL of hydrochloric acid and 100 mL of distilled water. Optical microscope (Carl Zeiss Axiovert 25) was utilized to observe the microstructure of the specimens in the as-cast condition, SHT, and aged conditions. Vickers microhardness of the specimens was measured according to ASTM E384. A diamond indenter was plunged into the specimen under an axial load of 50 g for 20 s. The microhardness of the specimens was calculated from the dimensions of the indents.
2.4 Wear test
The wear rate of the specimens was determined using a pin-on-disc tribometer setup (Ducom�CTR20LE) shown in Figure 1. The wear test was performed as endorsed by the standard ASTM G99. The disc was made of steel (Grade: EN316).Specimens of diameter d 5 mm and length 40 mm were machined from the SHT and aged specimens and used as pins. As advocated by the standard ASTM E3�C11, the specimens were mirror-polished and degreased using acetone. The constant load applied through the lever ensures continuous contact between the pin and the disc. The wear test parameters were as follows: a normal load of 20 N, track radius of 45 mm, sliding velocity of 3 m/s, and sliding distance of 1800 m. Precision weighing balance with a readability of 0.0001 g was used to measure the mass of the specimens before and after the wear test.
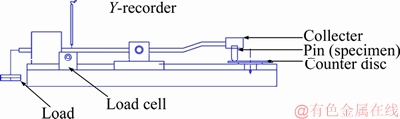
Figure 1 Tribometer setup
Equation (1) was used to calculate the wear rate of the specimens, where ��m is the difference in mass of the specimens, �� is the density of the alloy and ds is the sliding distance.
 (1)
(1)
2.5 Linear function��radial basis function model
The effect of Ni and Sn compositions at a various aging time on the properties of the alloy system could be studied using a mathematical model. As the degree of complexity in predicting the properties of alloy system based on composition is high, mathematical models based on regression analysis result in low values of coefficient of determination (R2). Recently, radial basis function (RBF) network based mathematical models are gaining momentum in statistical analysis, as they generate high efficient models. RBF is a real-valued function and the output of the function is reliant on the center point ��a��. Any function that satisfies Eq. (2) is identified as RBF [8].
 (2)
(2)
where x is the input variable.
Commonly used RBFs include Gaussian, multiquadratic, inverse quadratic and spline type. Multiquadratic type RBF was preferred to develop the model. Equation (3) shows the multiquadratic RBF related with the centers yj.
 (3)
(3)
where �� is the shape parameter.
The characteristic equation for the construction of approximation function using RBF network is given by Eq. (4).
 (4)
(4)
where f(y) is the approximation function; wi is the weight; and N is the number of RBFs.
Equation (5) shows the typical linear function �C RBF model.
 (5)
(5)
where G is the response; c1, c2, ��, cn are the regression coefficients of the predictors d1, d2, ��, dn respectively. In this study, a hybrid model with a linear function and RBF was developed using aging time, w(Ni) and w(Sn) as input variables and microhardness and wear rate as output variables. The linear regression consisted of three regression coefficients corresponding to the three terms namely w(Ni), w(Sn) and aging time.
3 Results and discussion
3.1 Microstructure
The micrograph of the as-cast specimen, homogenized and SHT specimen and specimen aged for 4 h are given in Figure 2. Figure 2(a) clearly shows that the micrograph of as-cast specimen displayed dendritic structure. The dendritic structure was not observed in the homogenized and SHT specimens. This indicated that the alloying elements were uniformly distributed in the matrix [9, 10].
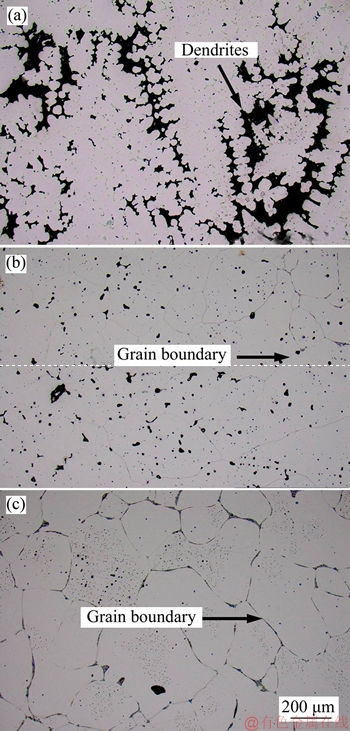
Figure 2 Metallographic microstructure of as-cast Cu-9Ni-6Sn (a), homogenized and SHT Cu-9Ni-6Sn (b) and 4 h aged Cu-9Ni-6Sn (c)
However, a few grain boundary precipitates were observed in the microstructure as shown in Figure 2(b). The microstructure of SHT Cu- 9Ni-6Sn aged for 4 h is shown in Figure 2(c) with its sleek grain boundary precipitates. The quantity of �� and �� (DO3) phases increased with the increase in aging time. Equilibrium phases are partially filled in the grain boundary, as the aging time chosen in the study is minimal [11]. A similar observation was made by ZHANG et al [12] and they reported that the grain boundaries are completely filled with equilibrium precipitates, with a considerable increase in aging time [13].
3.2 Microhardness and wear rate
The experimentally determined microhardnesses of the SHT and aged specimens are given in Table 1.
Table 1 Microhardness and wear rate of SHT and specimens aged at 350 ��C
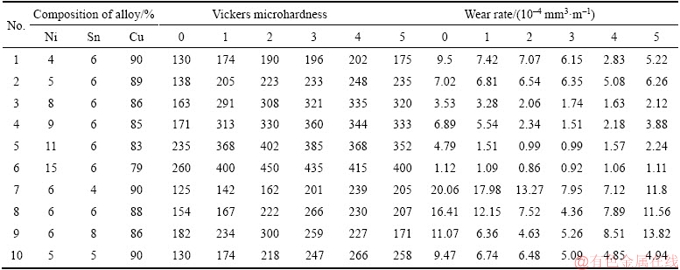
The formation of spinodal structure and meta- stable phase with DO22 increased the microhardness of the specimens [14]. The fall in the microhardness after an aging time of 4 h was credited to the formation of equilibrium grain boundary precipitates �� and �� (DO3) phases [11]. The increase in aging time formed metastable phase DO22 which hardened the matrix. Subsequent aging of specimens resulted in the formation of grain boundary precipitates, which reduced the microhardness of the matrix.
From Table 1, it is observed that increase in Ni and Sn concentration, increased the microhardness in SHT and aged specimens. The increase in microhardness of SHT specimens is accredited to the solution hardening effect of Ni and Sn. The microhardness of the aged specimens improved as a result of spinodal decomposition and ordering reaction [1]. Even at the low aging time, specimens with high Ni and Sn concentrations resulted in high microhardness. Hence, we infer that concentrations of Ni and Sn have significantly contributed to the microhardness of the matrix. The wear resistance of harder specimens was higher than the wear resistance of softer specimens, which adheres to Archard��s adhesion theory of wear.
3.3 SEM analysis
The worn out surfaces of the specimens were observed using scanning electron microscope and the typical images indicating high wear, medium wear, and low wear are shown in Figure 3. Deep continuous grooves were observed in the SHT specimens indicating high wear rate. For an example, Figure 3(a) shows deep grooves on the worn out surface of the SHT specimen Cu-9Ni-6Sn after wear test.
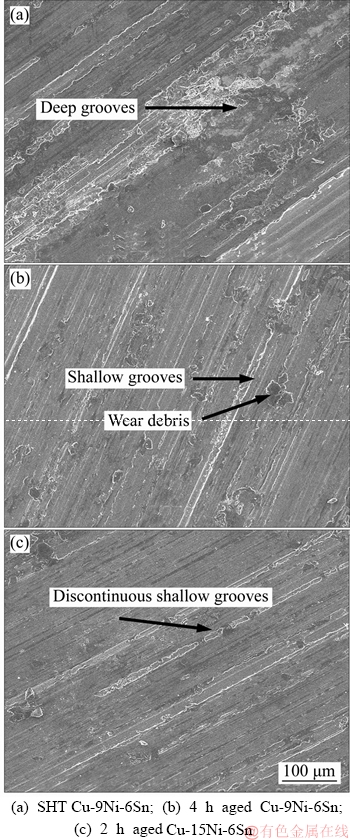
Figure 3 SEM images of worn out surface:
The high wear rate attested the softness of the matrix, which was in line with the microhardness measurements. The worn out surface of Cu-9Ni- 6Sn aged for 4 h is shown in the Figure 3(b) which clearly shows the wear debris and shallow grooves. The worn out surface of the 2 h aged Cu-15Ni-6Sn is shown in Figure 3(c). It had a minimum volume of wear debris and discontinuous shallow groove indicating a higher wear resistance.
3.4 Linear function��radial basis function model
Hybrid models (linear function�Cradial basis function) were developed for forecasting the microhardness and wear rate of the specimens using MATLAB computing environment. The models were built using 80% of the experimental data and the remaining 20% of experimental data was used for testing and validation. The models for predicting the microhardness and the wear rate are given by Eq. (6) and Eq. (7), respectively.
Microhardness=874.0468�C199.9673w(Ni)+
133.2919w(Sn)�C275.4336t+RBF1 (6)
Wear rate=�C9.77101�C1.05643w(Ni)�C
32.7w(Sn)�C12.636t+RBF2 (7)
The model developed was a hybrid consisting of a linear function and an RBF function. The algorithm used to develop and validate the model was RBF fit algorithm. The RBF network parameters chosen for developing the models are given in Table 2. The plot of experimental measurements versus predicted results for microhardness and wear rate of the specimens were shown in Figures 4(a) and (b), respectively.
The efficiency of the model in forecasting the microhardness and wear rate of the specimens are determined using R2 and adjusted R2 value, which are given in Table 2. The closeness of R2 value to one and equableness of R2 and the adjusted R2 value indicated that the developed models had high efficiency in prediction [15, 16].
3.5 Effect of Ni, Sn concentrations and aging time on microhardness and wear of CNS alloy system
3.5.1 Contour plots for microhardness
The contour plots displaying the variation of microhardness as a function of Ni and Sn compositions at various aging time were generated using the developed model and are shown in Figure 5. From Figure 5(a), it is observed that the SHT specimens with Ni greater than 11% and Sn between 6% and 7% had a harder matrix and the highest microhardness of 260 HV was obtained for the SHT Cu-15Ni-6Sn. From Figure 5(b), it is observed that the specimens with Ni greater than 11% and Sn between 6% and 7% and aged for 1 h had a harder matrix. From Figure 5(c), it is observed that the specimens with Ni greater than 11% and Sn between 5.5% and 6.5% and aged for 2 h had a harder matrix. From Figure 5(d), it is observed that the specimens with Ni greater than 11% and Sn between 6% and 6.5% and aged for 3 h had a harder matrix. From Figure 5(e), it is observed that the specimens with Ni greater than 11% and Sn between 5.5% and 6.5% and aged for 4 h had a harder matrix. From Figure 5(f), it is observed that the specimens with Ni greater than 11% and Sn between 5.5% and 6.5% and aged for 5 h had a harder matrix. From Figure 5(a) to Figure 5(f), it is observed that the specimens with Ni greater than 10% and Sn between 5.5% and 7% had harder matrix than the specimens with a low Ni concentration at all aging time. The matrices of Cu-6Ni-4Sn and Cu-5Ni-5Sn were relatively softer than any other composition in the SHT condition. The specimens aged until 4 h exhibited higher microhardness than the SHT specimens.
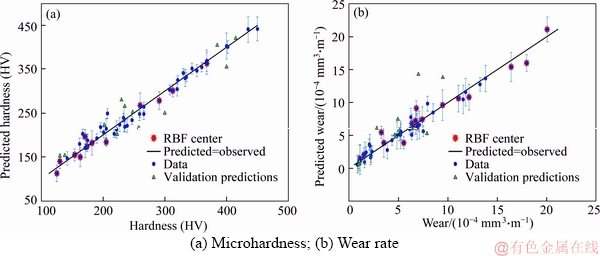
Figure 4 Linearity graph between experimental and predicted:
Table 2 RBF network parameters, R2 and adjusted R2 for generated model
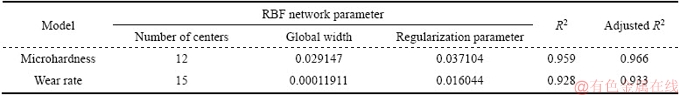
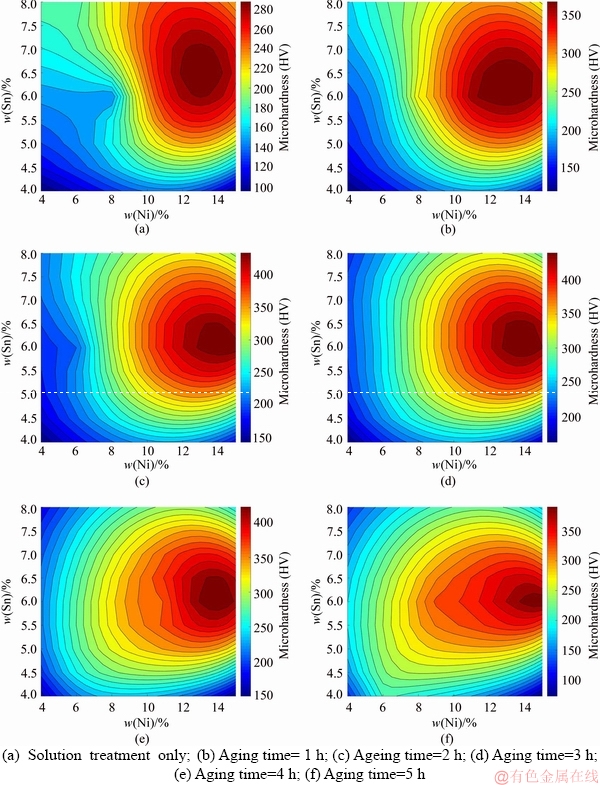
Figure 5 Effect of Ni and Sn composition on microhardness of alloy subjected to:
From Figure 5(a), it is observed that the SHT specimens with 4% Ni and 4% Sn, and 15% Ni and 4% Sn had a softer matrix and hence resulted in lower microhardness. From Figure 5(b), it is observed that the specimens with 4% Ni and 4% Sn, and 15%Ni and 4% Sn and aged for 1 h had a softer matrix and hence resulted in lower microhardness. From Figure 5(c), it is observed that the specimens with 4% Ni and 4% Sn, and 15%Ni and 4% Sn and aged for 2 h had a softer matrix and hence resulted in lower microhardness. From Figure 5(d), it is observed that the specimens with 4% Ni and 4% Sn, and 15%Ni and 4% Sn and aged for 3 h had a softer matrix and hence resulted in lower microhardness. From Figure 5(e), it is observed that the specimens with 4% Ni and 4% Sn, and 15%Ni and 4% Sn and aged for 4 h had a softer matrix and hence resulted in lower microhardness. From Figure 5(f), it is observed that the specimens with 4% Ni and 4% Sn, and 15%Ni and 4% Sn and aged for 5 h had a softer matrix and hence resulted in lower microhardness. As a result of non-initiation of spinodal decomposition, the specimens with a low Ni concentration displayed softer matrix for all aging time. It is observed that Cu-15Ni-6Sn displayed high microhardness than any other specimens at all the aging time. The microhardness of the specimens declined past an aging time of 3 h. With the increase in aging time, precipitation of equilibrium �� and �� phases softened the matrix, resulting in low microhardness [17]. Sn primarily contributes to microhardness by solution hardening.
3.5.2 Contour plots for wear rate
The effect of the Ni and Sn concentrations on the wear rate of Cu�CNi�CSn alloy for different aging time are shown as contour plots in Figure 6. From Figure 6(a), it is observed that the SHT specimens with Ni greater than 11% and Sn greater than 6.5% had lower wear rate. From Figure 6(b), it is observed that the specimens with Ni greater than 11% and Sn greater than 6% and aged for 1 h had lower wear rate. From Figure 6(c), it is observed that the specimens with Ni greater than 11% and Sn greater than 6% and aged for 2 h had lower wear rate. From Figure 6(d), it is observed that the specimens with Ni greater than 11% and Sn greater than 6% and aged for 3 h had lower wear rate. From Figure 6(e), it is observed that the specimens with Ni greater than 11% and Sn greater than 6% and aged for 4 h had lower wear rate. From Figure 6(f), it is observed that the specimens with Ni greater than 11% and Sn greater than 6% and aged for 5 h had lower wear rate. From Figure 6(a) to Figure 6(f), it is observed that specimens with a high Ni and Sn concentrations had minimum wear rate in the SHT and aged condition.
From Figure 6(a), it is observed that the SHT specimens with Sn between 4% and 4.5% and Ni between 4% and 15% had higher wear rate. From Figure 6(b), it is observed that the specimens with Sn between 4% and 4.5% and Ni between 4% and 15% and aged for 1 h had higher wear rate. From Figure 6(c), it is observed that the specimens with Sn between 4% and 4.5% and Ni greater than 10% and aged for 2 h had higher wear rate. From Figure 6(d), it is observed that the specimens with Sn between 4% and 4.5% and Ni greater than 10% and aged for 3 h had higher wear rate. From Figure 6(e), it is observed that the specimens with Sn between 4% and 4.5% and Ni greater than 10% and aged for 4 h had higher wear rate. From Figure 6(d), it is observed that the specimens with Sn between 4% and 4.5% and Ni greater than 10% and aged for 5 h had higher wear rate. It is also observed that lower Sn concentration produced soft matrix irrespective of Ni concentration for all aging time. Sn attributes this to the absence of solution hardening. It is observed that the SHT samples had high wear rate, which is the direct consequence of matrix softness [18]. A low wear rate was observed in the hard specimens, which abides by Archard��s adhesive theory of wear.
4 Conclusions
The CNS spinodal alloy with various compositions was cast efficaciously. The microstructure, microhardness and wear rate of the specimens were characterized. Hybrid models relating the Ni and Sn concentrations and aging time with the microhardness and wear rate of the alloys were generated. The applicability of the model was verified from the experimental data and closeness of coefficient of determination to one. The results demonstrated the following.
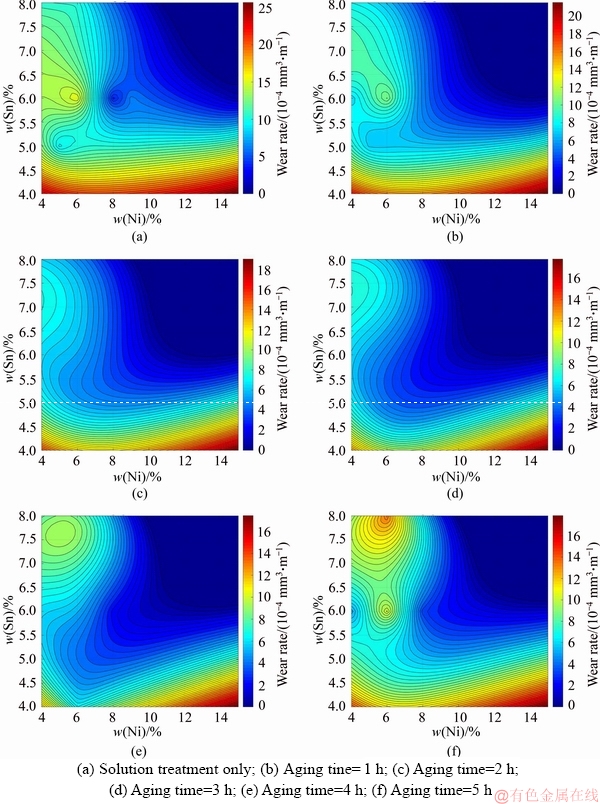
Figure 6 Effect of Ni and Sn concentrations on wear of alloy subjected to:
1) The micrograph of the as cast-specimen had dendritic structure, while no precipitates and dendrites were observed in the homogenized and SHT specimens. Hence, the alloying elements were uniformly dispersed in the matrix.
2) The Ni and Sn concentrations in the matrix significantly contribute to spinodal decomposition and ordering reaction. Increase in Ni and Sn concentrations increased the microhardness in the SHT and aged specimens, due to solution hardening, spinodal decomposition and ordering reaction. Sn primarily contributes to microhardness by solution hardening.
3) Aging improved the microhardness of the specimens, due to the formation of spinodal structure and meta-stable phase with DO22. Prolonged aging decreased the microhardness due to the formation of equilibrium �� and �� (DO3) phases in the matrix.
4) The wear rate was higher in the SHT specimens which were attested by deep-continuous grooves after wear test. Aging improved the wear resistance of the specimens, but prolonged aging decreased the wear resistance. Specimens with high Ni and Sn concentrations had minimum wear rate in the SHT and aged condition.
References
[1] ILANGOVAN S, SELLAMUTHU R. Measurement of the variation of mechanical properties with aging temperatures for sand cast Cu-5Ni-5Sn alloy [J]. Journal of Engineering Science and Technology, 2016, 11(11): 1609�C1619.
[2] DITCHEK B, SCHWARTZ L H. Diffraction study of spinodal decomposition in Cu-10 wt%Ni-6 wt% Sn [J]. Acta Metall, 1980, 28 (6): 807�C822.
[3] SCHWARTZ L H, MAHAJAN S, PLEWES J T. Spinodal decomposition in a Cu-9 wt% Ni-6 wt% Sn alloy [J]. Acta Metall, 1974, 22(5): 601�C609.
[4] SCHWARTZ L H, PLEWES J T. Spinodal decomposition in Cu-9wt% Ni-6wt% Sn��II. A critical examination of mechanical strength of spinodal alloys [J]. Acta Metall, 1974, 22(7): 911�C921.
[5] BABURAJ E G, KULKARNI U D, MENON E S K, KRISHNAN R. Initial stages of decomposition in Cu-9Ni-6Sn [J]. J Appl Crystallogr, 1979, 12(5): 476�C480.
[6] KATO M, MORI T, SCHWARTZ L H. Hardening by spinodal modulated structure [J]. Acta Metall, 1980, 28(3): 285�C290.
[7] SINGH J B, CAI W, BELLON P. Dry sliding of Cu�C15 wt%Ni�C8 wt%Sn bronze: Wear behaviour and microstructures [J]. Wear, 2007, 263(1): 830�C841.
[8] ILANGOVAN S, VAIRA VIGNESH R, PADMANABAN R, GOKULACHANDRAN J. Comparison of statistical and soft computing models for predicting hardness and wear rate of Cu-Ni-Sn alloy [C]// Progress in Computing, Analytics and Networking. Advances in Intelligent Systems and Computing, 2018: 559�C571.
[9] DI NEZ M, DONOSO E, SAYAGU
 S M, PEREJ
 N A, SNCHEZ-JIMNEZ P, PREZ-MAQUEDA L, CRIADO J. The calorimetric analysis as a tool for studying the aging hardening mechanism of a Cu-10 wt% Ni-5.5 wt% Sn alloy [J]. J Alloys Compd, 2016, 688(1): 288�C294.
[10] DONOSO E, DINEZ M, PEREJN A, SNCHEZ- JIMNEZ P, PREZ-MAQUEDA L, SAYAGUS M, CRIADO J. Microcalorimetry: A powerful tool for quantitative analysis of aging hardening response of Cu-Ni-Sn alloys [J]. J Alloys Compd, 2017, 694(1): 710�C714.
[11] ILANGOVAN S, SELLAMUTHU R. An investigation of the effect of Ni content and hardness on the wear behaviour of sand cast Cu�CNi�CSn alloys [J]. Int J Microstruct Mater Prop, 2012, 7(4): 316�C328.
[12] ZHANG S, JIANG B, DING W. Dry sliding wear of Cu�C15Ni�C8Sn alloy [J]. Tribol Int, 2010, 43(1): 64�C68.
[13] LEI Q, LI Z, GAO Y, PENG X, DERBY B. Microstructure and mechanical properties of a high strength Cu-Ni-Si alloy treated by combined aging processes [J]. J Alloys Compd, 2017, 695(1): 2413�C2423.
[14] WANG Y, ZHANG L, XIAO J, CHEN W, FENG C, GAN X, ZHOU K. The tribo-corrosion behavior of Cu-9 wt% Ni- 6 wt% Sn alloy [J]. Tribol Int, 2016, 94(1): 260�C268.
[15] RAMALINGAM V V, RAMASAMY P. Modelling corrosion behavior of friction stir processed aluminium alloy 5083 using polynomial: Radial basis function [J]. Trans Indian Inst Met, 2017, 70(10): 2575�C2589.
[16] VAIRA VIGNESH R, PADMANABAN R. Influence of friction stir processing parameters on the wear resistance of aluminium alloy AA5083 [J]. Mater Today: Proc, 2018, 5(2): 7437�C7446.
[17] ZHAO D M, DONG Q M, LIU P, KANG B X, HUANG J L, JIN Z H. Structure and strength of the age hardened Cu�CNi�CSi alloy [J]. Mater Chem Phys, 2003, 79(1): 81�C86.
[18] ZHANG S Z, JIANG B H, DING W J. Wear of Cu�C15Ni�C8Sn spinodal alloy [J]. Wear, 2008, 264(3): 199�C203.
(Edited by HE Yun-bin)
���ĵ���
�Ͻ�ɷֺ�ʱЧʱ���Cu-Ni-Sn�⾧̬�Ͻ�Ӳ�Ⱥ�ĥ�����ܵ�Ӱ��
ժҪ�������в�ͬ�ɷ���������ͭ�Ͻ�����������½���ģ�������������о��Ȼ��������ȴ�������в�ͬʱ��ʱЧ����������������������֯������������������Ӳ�Ⱥ�ĥ���ʽ����˲��ԡ����������Ժ����;���������Ļ��ģ�ͣ���������������ʱЧʱ���Cu-Ni-Sn�Ͻ���Ӳ�Ⱥ�Ħ��ѧ��Ϊ��Ӱ�졣����������������ɷֵ�����ʹ�Ͻ�������Ӳ�����ӣ�ĥ���ʽ��͡�������Ũ�ȵ����ӽ����˺Ͻ���ϵ�ķ�ֵʱЧʱ�䡣
�ؼ��ʣ�������ֽ⣻��Ӳ�ȣ�ĥ�𣻾����������ģ��
Received date: 2017-03-24; Accepted date: 2018-09-05
Corresponding author: R. PADMANABAN; Tel: +91-9894568309; E-mail: dr_padmanaban@cb.amrita.edu; ORCID: 0000-0002-4605- 646X

