Distribution patterns of rock mass displacement in deeply buried areas induced by active fault creep slip at engineering scale
��Դ�ڿ������ϴ�ѧѧ��(Ӣ�İ�)2020���10��
�������ߣ���С�� �Ŵ��� ����� �ܻ� ���� ����
����ҳ�룺2849 - 2863
Key words��active faults; creep slip; displacement distribution patterns; discrete element; rotation test
Abstract: Active fault creep slip induces deformation of rock mass buried deeply in fault zones that significantly affect the operational safety of long linear projects passing through it. Displacement distribution patterns of rock masses in active fault zones which have been investigated previously are the key design basis for such projects. Therefore, a discrete element numerical model with different fault types, slip time, dip angles, and complex geological features was established, and then the creep slip for normal, reverse, and strike-slip faults were simulated to analyze the displacement distribution in the fault rock mass. A disk rotation test system and the corresponding laboratory test method were developed for simulating rock mass displacement induced by creep slippage of faults. A series of rotation tests for soft- and hard-layered specimens under combined compression and torsional stress were conducted to verify the numerical results and analyze the factors influencing the displacement distribution. An S-shaped displacement distribution independent of fault dip angle was identified corresponding to reverse, normal, and strike-slip faults. The results indicated that the higher the degree of horizontal extrusion, the softer the rock mass at the fault core, and the higher the degree of displacement concentration in the fault core; about 70% of the creep slip displacement occurs within this zone under 100 years of creep slippage.
Cite this article as: ZHANG Chuan-qing, LIU Xiao-yan, ZHU Guo-jin, ZHOU Hui, ZHU Yong, WANG Chao. Distribution patterns of rock mass displacement in deeply buried areas induced by active fault creep slip at engineering scale [J]. Journal of Central South University, 2020, 27(10): 2849-2863. DOI: https://doi.org/10.1007/s11771-020- 4514-8.

J. Cent. South Univ. (2020) 27: 2849-2863
DOI: https://doi.org/10.1007/s11771-020-4514-8

ZHANG Chuan-qing(�Ŵ���)1, 2, LIU Xiao-yan(��С��)1, 2, ZHU Guo-jin(�����)3,
ZHOU Hui(�ܻ�)1, 2, ZHU Yong(����)1, 2, WANG Chao(����)3
1. State Key Laboratory of Geomechanics and Geotechnical Engineering, Institute of Rock
and Soil Mechanics, Chinese Academy of Sciences, Wuhan 430071, China;
2. University of Chinese Academy of Sciences, Beijing 100049, China;
3. Power China Kunming Engineering Corporation Limited, Kunming 650000, China
 Central South University Press and Springer-Verlag GmbH Germany, part of Springer Nature 2020
Abstract: Active fault creep slip induces deformation of rock mass buried deeply in fault zones that significantly affect the operational safety of long linear projects passing through it. Displacement distribution patterns of rock masses in active fault zones which have been investigated previously are the key design basis for such projects. Therefore, a discrete element numerical model with different fault types, slip time, dip angles, and complex geological features was established, and then the creep slip for normal, reverse, and strike-slip faults were simulated to analyze the displacement distribution in the fault rock mass. A disk rotation test system and the corresponding laboratory test method were developed for simulating rock mass displacement induced by creep slippage of faults. A series of rotation tests for soft- and hard-layered specimens under combined compression and torsional stress were conducted to verify the numerical results and analyze the factors influencing the displacement distribution. An S-shaped displacement distribution independent of fault dip angle was identified corresponding to reverse, normal, and strike-slip faults. The results indicated that the higher the degree of horizontal extrusion, the softer the rock mass at the fault core, and the higher the degree of displacement concentration in the fault core; about 70% of the creep slip displacement occurs within this zone under 100 years of creep slippage.
Key words: active faults; creep slip; displacement distribution patterns; discrete element; rotation test
Cite this article as: ZHANG Chuan-qing, LIU Xiao-yan, ZHU Guo-jin, ZHOU Hui, ZHU Yong, WANG Chao. Distribution patterns of rock mass displacement in deeply buried areas induced by active fault creep slip at engineering scale [J]. Journal of Central South University, 2020, 27(10): 2849-2863. DOI: https://doi.org/10.1007/s11771-020- 4514-8.
1 Introduction
Permanent ground displacement due to fault rupture would cause serious damage to tunnels or buried pipelines [1-3]. Although faults in seismically active areas should be avoided if possible, it is inevitable that some infrastructure will cross such areas [4, 5]. Especially in recent years, in order to address problems of uneven areal distribution of water resources and inconvenient transportation in western mountainous areas, China has constructed many traffic tunnels, water tunnels, and energy-transmission pipelines, including the Dianzhong Water Diversion Project, the Sichuan-��Tibet Railway Project, and the West Route of the South-to-North Water Transfer Project. Most of these tunnels and pipelines lie within areas of tectonic activity and cross active fault areas [6, 7]. Moreover, due to their extensive length, tunnels have a larger probability of passing a fault zone with fault core and damage zone that are several hundreds of meters wide. Such tunnels are vulnerable to not only seismic shaking but also creep deformations, and the cumulative creep displacement will cause severe damage to the tunnel within the service life of the project [8, 9].
To ensure the safe operation of these tunnels, numerous related studies including numerical and analytical analysis and centrifuge tests have been conducted to investigate the displacement or stress responses of the lining buried in the active fault areas. The theory of beams on elastic foundations was introduced, developed, and refined to obtain the strain distribution of a steel pipeline crossing faults [10, 11]. Large-scale centrifuge tests and series of sandbox tests were performed to describe the deformation and stress concentration area of a buried pipeline and shear zone subject to strike-slip fault, normal fault, and reverse fault motion [12-15].
From the previous studies, it is of interest to draw some broad conclusions, in terms of how the creep slip affects the safety of the tunnels when crossing active faults:
1) The performance of a tunnel that crosses a fault zone in a shallow burial area is mainly affected by the contact between the rock mass and the lining structure; therefore, the failure pattern of lining structure and displacement patterns of the tunnel itself need to be taken into account before designing the tunnel structure or a scheme to resist fault slip.
2) In deeply buried areas, when tunnels pass through a fault zone, it is the displacement distribution in the shear bands of the fault zone that exerts the greatest influence on the performance of these tunnels. Therefore, the differential displacement distribution along a tunnel, called the displacement distribution patterns, is the key to studying the deformation and failure of such a tunnel. Moreover, the distribution patterns could be used as a quantitative standard for different types of tunnel design.
3) The displacement distribution patterns are closely related to the geological structure of the fault zone, the in-situ stress condition, and in particular, the mechanical characteristics of rock mass in the fault area.
Therefore, in deeply buried areas, without accurately evaluating the distribution patterns of rock mass displacement induced by active fault creep slip, the design method of deep buried tunnels crossing active faults cannot be scientifically determined. However, previous results cannot yet be applied directly.
Focusing on this issue, the geological and kinematic features of several faults were analyzed according to different types of faults and different locations in a fault zone. Then, a discrete element numerical model with different fault types, slip time, dip angles, and complex geological features was developed. Additionally, a disk rotation test system and the corresponding laboratory test method were developed for simulating rock mass deformation inducing by creep slippage of faults. A series of rotation tests for soft and hard-layered specimens under combined compression and torsion stress was conducted to validate the numerical results and analyze the displacement distribution patterns.
2 Geological features of active faults
Generally, active faults exhibit different types of activity, generation ages, and stratigraphic lithology. However, based on the rock mass structural features, each fault zone can be divided into the following sub-strips: the hanging wall and footwall, the damage zone, and the fault core. The geological conditions of the same sub-strips of different faults are similar [16, 17].
As shown in Figure 1, rock masses in the hanging wall and footwall are continuous and relatively intact. In the damage zone, rock masses were cut into blocks of different shapes but with similar sizes, according to their occurrence. In the fault core, the breccia and mud are separated from each other and are loosely connected.

Figure 1 Geological area of tunnel crossing active fault
The rock compositions for different geological sub-strips are listed in Table 1. Containing dense and hard rock (such as granite, limestone, and glutenite), the hanging wall and footwall rock blocks exhibit a high strength. In the damage zone, the structural planes of rock masses were developed, and the rock masses were composed mostly of glutenite, thin mudstone, and siltstone. In the fault core, the rock masses are high in chalking, soft, and scattered, which results in low strength. In summary, the closer to the centre the active fault, the higher the degree of fragmentation, the weaker the rock mass, and the lower its strength.
3 Geometric and in-situ stress features of active faults in deeply buried areas
Different types of active faults may affect the interaction between the surrounding rock and the tunnel lining differently due to the different slip modes and dip angles, and thus contribute to different damage characteristics. Based on the fault type, dip angle, and slip modes of the hanging wall and footwall rock blocks, the active faults can be divided into three main types: normal fault, reverse fault and strike-slip fault, as shown in Figure 2.
According to geological observations results and Anderson theory [24-29], in the vicinity of a reverse fault, the maximum principal stress is along the horizontal direction, and the minimum principal stress is along the direction of action of gravity (i.e., vertically downwards). The angle of overthrust fault is generally less than 45��, and many reverse faults exhibit an angle greater than 45�� in vicinity of the normal fault. Anyhow, for reverse fault, then the slip between the hanging wall and footwall rock blocks will cause the tunnel lining to be squeezed. For a normal fault, the maximum principal stress is vertically downwards and the minimum principal stress is along the horizontal direction. The resulting fracture plane is at an angle greater than 45��(generally 60��). The slip between the hanging wall and footwall rock blocks subjects the tunnel lining to tension. When the maximum and the minimum principal stresses are parallel to the ground surface, a strike-slip fault is formed, resulting in a steep fracture plane with a large dip angle, close to 90�� at its maximum, so attention must be given to the stability of the left and right- hand sides (spring-line) of the tunnel. Therefore, the types of fault, dip angles as well as in-situ stresses should be included in the study of displacement distribution patterns.
4 Kinematic features of active faults
The creep rate data of 27 active faults around the world are summarized in Figure 3: black circles indicate the horizontal rate, and red forks represent the vertical rate. The former exceeds the latter, because some of the data pertaining to vertical rate were not captured for all those faults listed. The annual slip displacements between the hanging wall and footwall of faults are in general, within 10 mm, and the slip displacement mainly occurs in the horizontal direction [30]. When a creep rate of several millimeters per year occurs within 100 years, the cumulative creep slip displacement in fault zone could reach several meters and cause serious damage to any tunnel lining buried in the fault zone. From another perspective, under different creep slip rates, the total slip displacement is different, for example, over 20 years, which will have different effects on tunnel stability. Therefore, the creep slip rate should also be considered an important factor in the analysis. An alternative method will be used here, namely, increasing the displacement by increasing the slip time, and observing the deformation under different imposed displacements.
Table 1 Geological characteristics of typical active faults

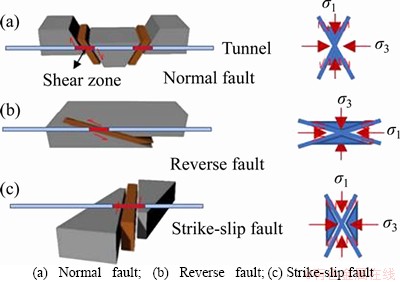
Figure 2 Slip types, dip angles and in-situ stress condition of:

Figure 3 Horizontal and vertical creep slip rates of active faults [30-32]
5 Geometric and in-situ stress features of active faults in deeply buried areas
5.1 Geological and geometrical basis of numerical model
As described in Section 2, the Yuanmou- L��zhijiang fault crossed by the Fenghuangshan Tunnel in the Dianzhong Water Diversion Project in the southwest China was selected as a typical fault which consists of the hanging wall and footwall, fault core, and damage zones (Figure 4). For this fault, the material composition, mechanical parameters of rock mass, in-situ stress in the vicinity of the tunnel and fault slip rate have been provided. In addition, rather than specifically simulating it, this study also explored the displacement distribution patterns around normal and reverse faults based on the typical geological conditions of this fault, such as geological structure, rock mass type, or in-situ stress regime.

Figure 4 Schematic diagram of Fenghuangshan Tunnel crossing Yuanmou-L��zhijiang fault
The overall structure and dimensions of the model are illustrated in Figure 5, where the combined width of the damage zone and the fault core is 100 m along the horizontal direction.
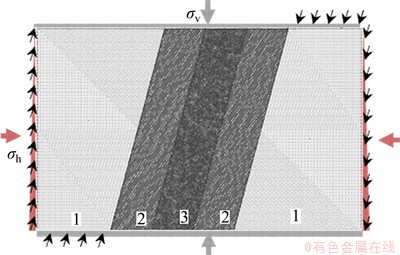
Figure 5 Schematic diagram of active fault numerical model (1-Hanging wall and footwall; 2-Damage zone; 3-Fault core)
Based on the dip angles of the typical active fault [18], numerical models were established for dip angle of 53�� for the reverse fault, dip angle of 75�� for the normal fault, and dip angle of 84�� for the left-lateral strike-slip fault.
Previous research results showed that incompatible deformation occurs in rock masses under the joint control of structures and joint planes and that the rock masses in the damage zone and fault core are typical discontinuous rock structures [19]. To this end, the discrete element program Universal Distinct Element Code (UDEC) was used here for modelling.
The rock masses in the fault core were broken and fractured; material structures were rather complicated, and structural planes were distributed in a disorderly manner. From the particle size distribution characteristics of the fractured rock masses, the block sizes and the number of joints in the fractured rock masses have a quantitative relationship with the number of geometric fractals. The distribution pattern of the block sizes is clear, and the overall distribution is non-uniform. BILLI et al [33] investigated the rock mass geometry of the fault core of several active faults and found the distribution patterns of the blocks in the fault core. Based on observed results, the geometric appearances of the rock mass structures of the fault core are similar to Voronoi polygonal groups.
As shown in Eq. (1), any point inside a Voronoi polygon is the closest to the single discrete point Si contained within the polygon. This property makes the Voronoi polygon appear in the form of a ��cell body�� with uniform, and random, side lengths. Therefore, the polygonal groups formed by this method were used to describe the fractured rock masses to have macroscopic ��continuity�� and microscopic ��fragmentation��. In the present work, the Voronoi block partitioning logic of the discrete element software UDEC was used to develop rock mass models of the fault core. BILLI et al [33] presented statistical results pertaining to the structural blocks in the fault core. A group of 103 Voronoi polygons could be created according to the characteristics of a non-uniform distribution in a 100-m fault core (Figure 6).
 D|d(P, Si)��d(P, Sj),
  j��i} (1)
where Ci is the area contained in a polygon in the Voronoi group; Pi is the arbitrary point in a Voronoi polygon; d(P, Si) represents the distance from Pi to a single point Si contained within the Voronoi polygon; d(P, Sj) represents the distance from Pi to a single point Sj contained in the Voronoi polygon group.
Based on a statistical study for trace length and angle of joints in faults in Ref. [33] in the implementation of the program, the averaged trace lengths, angles and the distribution patterns of the joints in the damage zone were considered from which we plotted the centre position coordinates of the joins in the area based on the distribution parameters of the joints (Figure 7(a)).
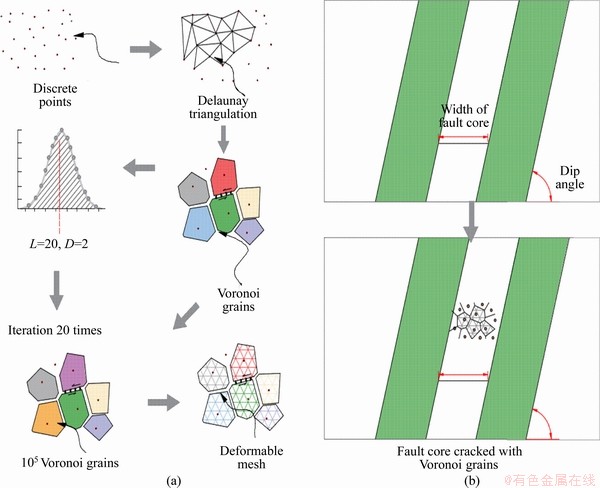
Figure 6 Flow diagram to create numerical model of fault core
Then, the length and angle sequences of the joints (converted into matrix format) were generated according to the distribution models of the length and angle of the joints. As shown in Figure 7(b), the beginning and end position coordinates of each joint could be calculated and then a joint network was formed by connecting these coordinates (Figure 7(c)). The hanging wall and footwall rock blocks were relatively intact. Therefore, we only performed mesh generation (not joint division) in the area. The discrete element numerical model of the active fault is illustrated in Figure 7.
5.2 Mechanical models and parameters
For the fractured rock mass, only when the macroscopic mechanical parameters thereof are selected correctly, the microscopic parameters can be determined scientifically through trial calculation. Here, it was the mechanical parameters of blocks and joints that control the macroscopic mechanical parameters of the fractured rock mass in fault zone. To simulate the mechanical response of rock mass in the fault zone, an ideal elastic-plastic model was applied to describe the mechanical behavior of rock blocks, and the Mohr-Coulomb criterion and tensile strength criterion were employed to judge the shear and tensile failure of rock blocks and joints, respectively. The mechanical parameters of a block included elastic modulus, Poisson ratio, cohesion, and friction angle. The mechanical parameters of a joint plane included normal stiffness, normal tensile strength,tangential stiffness, internal friction angle, and cohesion.
To acquire the mechanical parameters of rock structures and joint planes, the following steps were used to obtain the noted parameters:
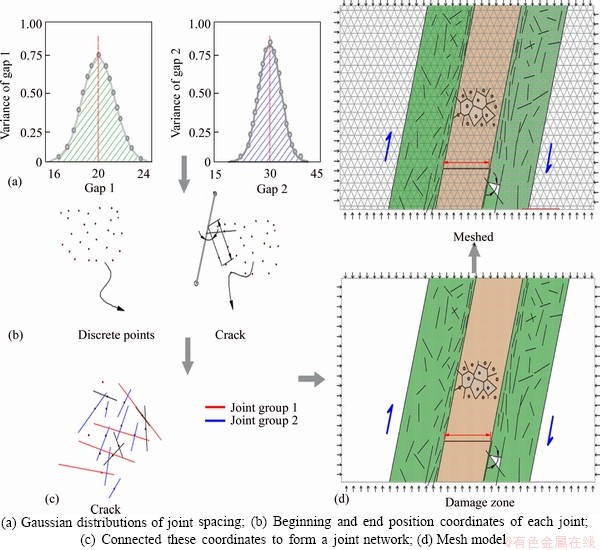
Figure 7 Flow diagram showing development of numerical model of damage zone:
1) First, according to the field test results of rock mass from the Yuanmou-L��zhijiang fault and test results from case studies [34-36], the macroscopic mechanical parameters including UCS, elastic modulus, cohesion, and friction angle of the rock masses in the fault zone were obtained.
2) Then, the discrete element method (Figure 8) was used to model compression tests on scaled rock mass specimens, and trial calculations were performed with different microscopic parameters to select the best macroscopic mechanical parameter.
3) By comparing the parameters obtained in Steps 1 and 2, the mechanical parameters of the rock blocks and joints needed for the numerical simulations were determined.
In this procedure, the stiffness parameter of a joint had to be obtained from the elastic parameters of nearby structural elements. The stiffness parameter could be calculated using Eq. (2):
 (2)
(2)
where K is the bulk modulus; G is the shear modulus; and ��Zmin represents the minimum size of the connecting area in the normal direction of the joint plane.
Figure 8 Numerical compression of rock masses for fault core using discrete element method [37-39]
The mechanical parameters of the rock blocks and joint planes are listed in Table 2, and the corresponding numerical simulation results are shown in Figure 9. In Table 2, the mechanical parameters of the hanging wall and footwall rock blocks are greater than those in the damaged zone and they gradually decreased towards the central part of the rock mass. The mechanical parameters of the rock masses are symmetrically distributed from the centre to the two sides.
5.3 Initial and boundary conditions
The boundary conditions set for the numerical simulations of fault slip are shown in Figure 6. For different types of faults, not only are the horizontal tectonic stress and the overlying strata gravity applied but also a stress gradient at the boundaries is also applied based on the self-weight of the rock mass. The in-situ stress fields in the numerical models (i.e., the reverse fault with a 53�� dip angle, normal fault with a 75�� dip angle, and strike slip fault with an 84��dip angle) in the present work are selected according to the in-situ stress measurement results in the vicinity of the tunnel [7, 28, 40, 41], the in-situ principal stresses are listed in Table 3.
Based on geological survey results [8], a slip rate of 6.25 mm/year was selected for active faults, since the active fault slip was dominated by a single direction, and for normal and reverse faults, slip occurred mainly along the dip direction, so we simulated fault slip by applying velocity vectors at the nodes of the hanging wall and footwall rock blocks, by resolving the slip into horizontal and vertical components.
6 Numerical results
6.1 Displacement distribution patterns for different types of active faults
Figure 10 shows displacement vector nephograms of active strike-slip faults with dip angle of 80�� after 30 years of slip.
Table 2 Mechanical parameters of rock masses in different geological zones
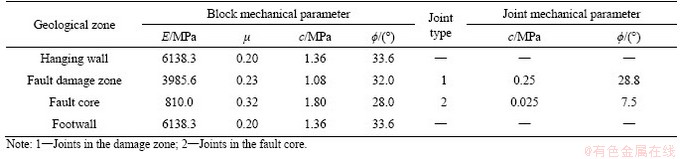

Figure 9 Stress�Cstrain curve of a fractured rock sample (numerical study) subjected to different confining pressures
Table 3 Initial and boundary conditions for different types of active faults


Figure 10 Rock mass deformation and displacement nephograms for creep slip of different types of active faults
It can be seen that, if the fault centreline (parallel to the fault plane) is the symmetric axis, the closer to the centre the fault core, the narrower the equivalent area of the displacement, and lighter the color. In other words, the closer to the centre the fault core, the smaller the displacement, and the larger the gradient. The displacements of the hanging wall and footwall rock blocks (relative to the fault centreline) are equivalent but opposite in sign.
The displacement curves of rock mass in normal, reverse, and strike-slip faults induced by creep slip are demonstrated in Figures 11-13. The coordinate system was based on the hypothetical tunnel axis as the abscissa, the mid-point of the tunnel crossing the fault core as the origin, and vertically downwards as the ordinate. The positive and negative directions along the coordinate axes are positive and negative, respectively. The coordinate range of the fault core is between -50 and 50 m. The coordinate ranges of the damage zone are from -150 to -50 m and from 50 to 150 m. The ranges of the hanging wall and footwall rock blocks are from -400 to -150 m and from 150 to 400 m. The coordinates of the interface between the damage zone and the fault core are ��50 m.
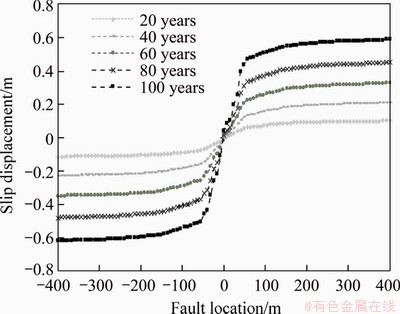
Figure 11 Displacement patterns for strike-slip faults of -84�� at different times

Figure 12 Displacement patterns for reverse faults of -53�� at different times

Figure 13 Displacement patterns for normal faults of -75�� at different times
The displacement distribution curves have a central symmetry feature determined by the structural symmetry of the hanging wall and footwall blocks of active faults. Figure 14 shows the displacement distributions for each of the three types of faults, in which displacement patterns for the three types of active faults are similar and generally are S-shaped. Meanwhile, it indicates that the fault types have little effect on the displacement distribution patterns. In the fault zone with hanging wall and footwall, the rock blocks have higher strength and stiffness. Therefore, the slip displacement in this area is relatively gentle and the rock moves translationally.
From the hanging wall and footwall to the nearby damage zone, the displacement curves of rock mass are continuous and change only slightly. In the damage zone, the displacement of the rock mass decreases linearly from the hanging wall or footwall to the fault core. The displacement curves contain a point of inflection at the interface between the damage zone and the fault core. The gradients of the displacement curves of the fault core rock mass are significantly larger than that of the damage zone rock mass, and the displacement curves are quasi-linear. The gradients of the slip displacement curves are closely related to the mechanical characteristics of the rock masses.

Figure 14 Displacement patterns of three types of faults after 100 years creep slippage
These results show that the displacement distribution patterns for different dip angles are the same. In the fault core, the slip displacement magnitude is the highest, and the displacement gradient is the largest. The displacement inflection point is located at the interface between the damage zone and the fault core.
6.2 Gradient of displacement curves for different types of active faults
The displacement gradient curves of reverse, normal, and strike slip faults are shown in Figure 15. The maximum displacement gradient (about 9.0��10-3) is found in the fault core, between -50 and 50 m, whereas displacement gradient increases slowly when approaching the centre of the fault core. The most significant displacement gradient observation is the abrupt decrease at ��50 m between in the two actively deforming shear zones, the fault core, and damaged zone. Compared with the gradient in the fault core, the displacement gradient in the damage zone, hanging wall, and footwall is lower, and the displacement gradient decreases gradually from the damage zone to the hanging wall and footwall, ranging from -400 to -150 m and from 150 to 400 m.
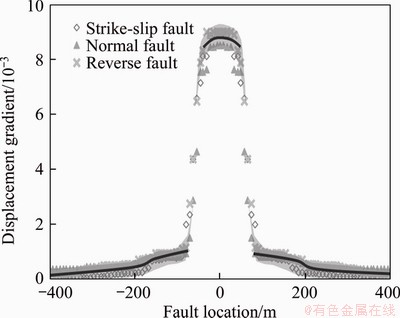
Figure 15 Displacement gradient of displacement distribution curves for reverse, normal, and strike-slip faults
6.3 Displacement proportion of fault sub-strips after 100 years
In this section, the relative displacement indicating the max amount in each fault sub-strip and its percentage of the total dislocation displacement were calculated for the design life of a tunnel (i.e., 100 years). The total dislocation displacement refers to the relative displacement between the hanging wall to the footwall.
Figure 16 indicates that the dislocation displacement in fault core, with the weakest mechanical properties, accounts for 67.83% of the total dislocation displacement, which is the mean value of the three types of faults. The displacement percentages of the damage zone, hanging wall and footwall are 16.41%, 8.21% and 7.55, on average, respectively. The slip displacement is thus concentrated in the area of the fault core, and this ratio 74.18% for strike-slip fault is higher than that for a normal fault and reverse fault, which are 57.56% and 67.96%, respectively.
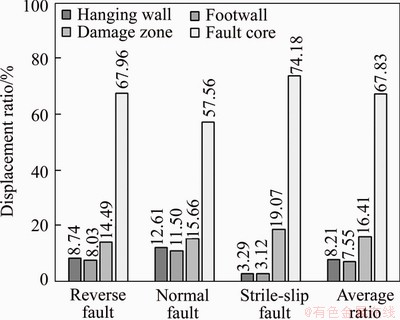
Figure 16 Percentage of displacement of each fault sub-strips in total displacement over 100 years
7 Experimental study
7.1 Development of disk rotation test system and corresponding test method
Creep slip of the active faults including the normal, reverse, and strike slip faults could be generalised to a shear mechanical behaviour of the rock mass under in-situ stress. Since the displacement response of the cross-section of the faults under creep slip is the focal point here, when considering the cross-section of the faults as a specific research object, the stress state in the cross-section plane could be replaced by a lateral displacement constraint, and normal and shear stresses. Therefore, in terms of the macroscopic mechanical principle of fault creep slip and the material structure of the fault zones, a layered-dis like disk rotation model could be used to simulate the creep dislocation between different fault sub-strips (Figure 17). The layered-dis like fault bands could be represented by the soft and hard composite interlayers, and the creep slip behavior could be represented by the rotation of disk sample at its two ends. The stress condition in the disk sample could be achieved by the reaction of the lateral confined sleeve under the normal stress at the end of the disk sample.

Figure 17 Schematic diagram of disk rotation test system
Based on above technical guidelines, a disk rotation test system was developed and was equipped with hydraulic jacks and transmission rods for application of normal loading and torsion rotation, which can be applied simultaneously and independently. The test system could provide continuous rotation through a 360�� (relative) torsion angle between the upper and lower disks, and the maximum normal load could reach 100 kN. The test samples were cylindrical with the maximum diameter of 200 mm and a height of 400 mm.
7.2 Sample preparation and test plan
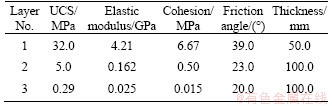
Referring to the fault zoning shown in Figure 2, we established a cylindrical specimen consisting of a five-layer structure shown in Figure 18, which includes three similar materials with different mechanical properties. The similar material in the middle layer (Layer 3) is the weakest and made of the composition that clay: quartz sand: water=49%: 40%: 11%, compared with the similar material with clay: quartz sand: blanc fixe: plaster: water=23.4%: 26.0%: 22.5%: 18.5%: 9.59% in Layer 2, and the similar material with cement: quartz sand: water = 40%: 40%: 20% in the upper and lower layers (Layer 1). As shown in Table 4, the upper and lower layers (Layer 1) are referred to as hanging wall and footwall, causing the middle three layers (Layers 2 and 3) to rotate under the combination of normal and shear stress. Each layer is cylindrical with a maximum diameter of 200 mm and a height of 100 mm.
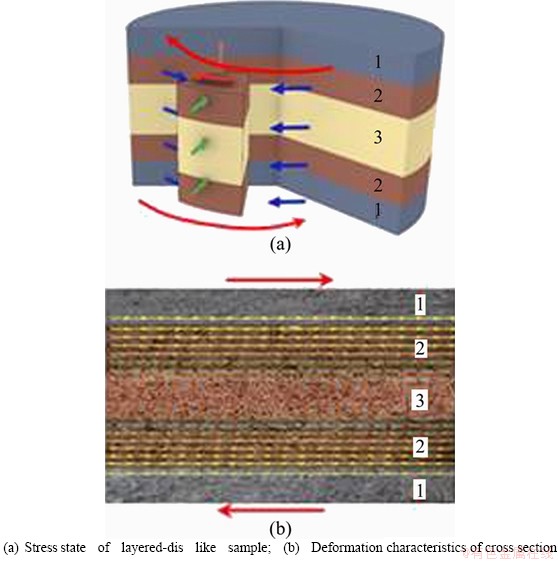
Figure 18 Structure of cylindrical specimen:
Table 4 Material composition and mechanical parameters of each layer
The deformation of the layers was analyzed when the normal stress of the contact surface ranged from 10 to 25 kPa according to the similarity law; therefore, the aforementioned normal load was determined accordingly, and consolidation was conducted over 48 h until the rate of axial displacement of the hard and soft layers in the specimen decreased to zero [42]. During the test, the normal stress was applied under constant normal stress control; the rotation of the upper and lower plates was displacement-controlled until the rate of change of normal displacement decreased to zero.
A high-speed camera was used to monitor the deformation of the specimens with soft and hard layers, and a uniform distribution of measuring points along pre-set lines was established on the surface of the sample before each test. Then, the displacement could be obtained by calculating the changes in the relative position of measuring points on the outer surface. Pictures of the outer surface of the sample were captured at 0��-360�� and assembled by the method of digital speckle displacement measurement.
The coordinate range of the middle soft layer is ��50 mm, and the coordinates of the hard layers representing the damage zone ranged from -100 to -50 mm and from 50 to 100 mm. The displacement distribution at each normal load is shown in Figure 19.

Figure 19 Displacement patterns of soft and hard layers under different normal pressures
7.3 Test results
1) The displacement distribution patterns of samples with hard and soft layers are S-shaped Figure 19 shows the displacement of the weak interlayers along the axial direction of the specimen under different normal loads: the displacement curves are S-shaped. In the central area of the middle two soft layers, the displacement curves still show linear characteristics, but gradually deflect when approaching the upper and lower layers. In addition, the displacement gradient of the middle soft layer is much greater than those of the upper and lower layers.
The comparison between Figures 5 and 20 shows that the displacement distribution patterns obtained by the experiment are consistent with the numerical results.
2) The proportion of displacement in different layers
Figure 20 indicates that the dislocation displacement in the middle layer referred to fault core accounts for 72.92% to the total displacement, on average for three types of faults. In addition, the change in normal stress exerts little effect on the ratio of the displacement of each layer to the total displacement, for example, when the normal stress increases from 15 to 25 kPa, the proportion of displacement in the middle soft interlayer to the total dislocation displacement increases from 69.2% to 78.0%, the average ratio thereof is 72.92%.

Figure 20 Percentage of displacement of each sub-layers in total displacement
8 Discussion
8.1 Comparison of displacement distribution patterns found using different methods
Our results suggest that the creep displacement distribution patterns are S-shaped, controlled by the in-situ stress regime and the mechanical parameters of the rock mass in the fault zones. This was confirmed through both numerical simulation and experiment.
Figure 21 shows the comparison between the displacement distribution patterns along several typical tunnels subjected to creep slip, inferred from synthetic aperture radar (SAR), monitoring data, and output data from use of the FEA method [7, 43, 44]. The monitoring lasted for 7 years and 4 montls (from December 1971 to April 1979); in contrast, the displacement distribution pattern along the BART tunnel axis which crosses the Hayward fault with its aseismic creep slip behavior is in agreement with our results in terms of the general trend to an S-shaped distribution. From this point of view, use of geomechanics to explore the displacement response of tunnels is appropriate for predicting their structural deformation subjected to creep slip in areas of deep burial.

Figure 21 Comparison of displacement distribution patterns [44]
In the past, the displacement distribution was deemed to have been linear and this has been used as a design basis for some tunnels [43, 44]. Herein, the linear displacement pattern may be conservative for damaged zone and dangerous for fault core zones, after comparing the displacement magnitude and displacement gradient of different fault areas. It is recommended that the S-shaped displacement pattern could be used as a quantitative basis for the structural design of the tunnel that crosses an active fault zone, to ensure resistance to dislocation and deformation of the lining.
Moreover, in previous studies, there were few opportunities available to study the difference in the displacement patterns between surface and deeper buried areas, at a depth of a few tens to several hundred metres. In the present work, it was concluded that the surface displacement patterns differed from those in deeply-buried areas, owing to the difference in factors such as in-situ stress regime, and the properties of the rock mass in fault zones.
8.2 Supplementary instruction and limitation
In addition, it should be noted that the displacement distribution patterns are the same when the mechanical parameters of the hanging wall and footwall are the same or different. Since the mechanical parameters of the fault core and damage zone are too weak relative to the hanging wall and footwall, the difference in parameters between hanging wall and footwall does not affect the displacement distribution.
Furthermore, there are several limitations to this study:
1) The reason why the displacement pattern is S-shaped has not been evaluated but it may be explained by the plastic flows occurring in the fault core identified by the strain softening and hardening mechanism.
2) The magnitudes of the in-situ stress components have not been considered in the disk test, and the physical simulation test of creep slip in the fault zone under triaxial principal stresses could be further explored.
3) Specific structural design methods based on the displacement distribution have not been proposed.
4) The results given in the paper are valid when the mechanical properties of the rock mass in fault zones do not change when approaching the fault core; for some faults where the mechanical properties of rock mass in the fault zone changes, it is necessary to rerun the calculation according to the method proposed here.
9 Conclusions
Creep slip displacement distributions for different types of faults and dip angles were proposed using the numerical simulation and experimental methods. The following conclusions were obtained:
1) The creep slip displacement distribution patterns of reverse, normal, and strike-slip faults are all S-shaped.
2) The fault dip angle does not affect the displacement distribution but does affect the displacement gradient in a fault zone.
3) Under creep slip for 100 years, for a normal fault, reverse fault, and strike-slip fault, about 70% of the creep slip displacement occurs within the fault core: attention must be paid to this zone during tunnel and pipeline design.
4) The component of the in-situ stress perpendicular to the fault plane can increase the displacement of the fault core to some extent.
Contributors
ZHANG Chuan-qing and ZHOU Hui provided the concept, and ZHANG Chuan-qing edited the draft of manuscript. LIU Xiao-yan conducted the literature review and wrote the first draft of the manuscript. ZHU Guo-jin and WANG Chao provided the measured geological and landslides displacement data, and LIU Xiao-yan analyzed the measured data.
Conflict of interest
ZHANG Chuan-qing, LIU Xiao-yan, ZHOU Hui, ZHU Guo-jin and WANG Chao declare that they have no conflict of interest.
References
[1] ZHANG Xue-peng, JIANG Yu-jing, MAEGAWA K. Mountain tunnel under earthquake force: A review of possible causes of damages and restoration methods [J]. Journal of Rock Mechanics and Geotechnical Engineering, 2020, 12(2): 414-426. DOI: 10.1016/j.jrmge.2019.11.002.
[2] LAI Jin-xing, HE Si-yue, QIU Jun-ling. Characteristics of seismic disasters and aseismic measures of tunnels in Wenchuan earthquake [J]. Environmental Earth Sciences, 2017, 76(2): 94. DOI: 10.1007/s12665-017-6405-3.
[3] TSINIDIS G, DESILVA F, ANASTASOPOULOS I. Seismic behaviour of tunnels: From experiments to analysis [J]. Tunnelling and Underground Space technology, 2020, 99: 103334. DOI: 10.1016/j.tust.2020.103334.
[4] DING Xuan-ming, FENG Li, WANG Cheng-long. Shaking table tests of the seismic response of a utility tunnel with a joint connection [J]. Soil Dynamics and Earthquake Engineering, 2020, 133: 12. DOI: 10.1016/j.soildyn.2020. 106133
[5] ANASTASOPOULOS I, GAZETAS G. Foundation-structure systems over a rupturing normal fault: Part I. Observations after the Kocaeli 1999 earthquake [J]. Bulletin of Earthquake Engineering, 2007, 5(3): 253-275. DOI: 10.1007/s10518- 007-9029-2
[6] LI Tian-bin. Damage to mountain tunnels related to the Wenchuan earthquake and some suggestions for aseismic tunnel construction [J]. Bulletin of Engineering Geology & the Environment, 2012, 71: 297-308. DOI: 10.2208/ jscej.2000.659_27.
[7] ZHANG Chuan-qing, ZHOU Hui, ZHU Yong. Study on structural adaptability of tunnels in active faults in Yuzhong Water Diversion Project [R]. Wuhan: Institute of Rock and Soil Mechanics, Chinese Academy of Science, 2017.
[8] BARNHART W D. Fault creep rates of the Chaman fault (Afghanistan and Pakistan) inferred from InSAR [J]. Journal of Geophysical Research: Solid Earth, 2017, 122: 372-386. DOI: 10.1002/2016JB013656.
[9] ZHANG Xue-peng, JIANG Yu-jing, MAEGAWA K. Mountain tunnel under earthquake force: A review of possible causes of damages and restoration methods [J]. Journal of Rock Mechanics and Geotechnical Engineering, 2020, 12(2): 414-426. DOI: 10.1016/j.jrmge.2019.11.002.
[10] NEWMARK N M, HALL W J. Pipeline design to resist large fault displacement [C]// Proceedings of the U.S. National Conference on Earthquake Engineering-1975. Michigan, 1975.
[11] TRIFONOV O V, CHERNIY V P. A semi-analytical approach to a nonlinear stress�Cstrain analysis of buried steel pipelines crossing active faults [J]. Soil Dynamics and Earthquake Engineering, 2010, 30: 1298-1308. DOI: 10.1016/ j.soildyn.2010.06.002.
[12] FAN Ling, CHEN Jie-ling, PENG Shu-quan. Seismic response of tunnel under normal fault slips by shaking table test technique [J]. Journal of Central South University, 2020, 27(4): 1306-1319. DOI: 10.1007/s11771-020-4368-0.
[13] LIU Xue-zeng, LI Xue-feng, SANG Yun-long. Experimental study on normal fault rupture propagation in loose strata and its impact on mountain tunnels [J]. Tunnelling & Underground Space Technology Incorporating Trenchless Technology Research, 2015, 49: 417-425. DOI: 10.1016/ j.tust.2015.05.010.
[14] O��ROURKE T D, JUNG J K, ARGYROU C. Underground pipeline response to earthquake-induced ground deformation [J]. Soil Dynamics and Earthquake Engineering, 2016, 91: 272-283. DOI: 10.1016/j.soildyn.2016.09.008.
[15] KUN M, ONARGAN T. Influence of the fault zone in shallow tunneling: A case study of Izmir Metro Tunnel [J]. Tunnelling and Underground Space Technology, 2013, 33: 34-45. DOI: 10.1016/j.tust.2012.06.016.
[16] CAINE J S, EVANS J P, FORSTER C B. Fault zone architecture and permeability structure [J]. Geology, 1996, 24(11): 1025-1028. DOI: 10.1130/0091-7613(1996)024< 1025:FZAAPS>2.3.CO;2.
[17] KIM Y S, PEACOCK D C P, SANDERSON D J. Fault damage zones [J]. Journal of Structural Geology, 2004, 26: 503-517. DOI: 10.1016/j.jsg.2003.08.002.
[18] BEN-ZION Y, SAMMIS CG. Characterization of fault zones [J]. Pure & Applied Geophysics, 2003, 160: 677-715. DOI: 10.1007/PL00012554.
[19] BRADBURY K K, EVANS J P. Composition and structure of the san andreas fault observatory at depth (SAFOD) Phase III Whole-Rock core: Implications for fault zone deformation and fluid-rock interactions [J]. Geological Society of America Denver Annual Meeting, 2010: 4.
[20] MA K F, TANAKA H, SONG S R, WANG C Y. Slip zone and energetics of a large earthquake from the Taiwan Chelungpu-fault drilling project [J]. Nature, 2006, 444: 473. DOI: 10.1038/nature05253.
[21] SONG Sheng-rong, KUO Li-wei, YEH E C. Characteristics of the lithology, fault-related rocks and fault zone structures in TCDP Hole-A [J]. Terrestrial, Atmospheric and Oceanic Sciences, 2007, 18: 243. DOI: 10.3319/TAO.2007. 18.2.243(TCDP).
[22] WIBBERLEY C A, SHIMAMOTO T. Internal structure and permeability of major strike-slip fault zones: The Median Tectonic Line in Mie Prefecture, Southwest Japan [J]. Journal of Structural Geology, 2009, 25: 59-78. DOI: 10.1016/s0191-8141(02)00014-7.
[23] LI Hai-bing, WANG Huan, XU Zhi-qin. Characteristics of the fault-related rocks, fault zones and the principal slip zone in the Wenchuan Earthquake Fault Scientific Drilling Project Hole-1 (WFSD-1) [J]. Tectonophysics, 2013, 584: 23-42. DOI: 10.1016/j.tecto.2012.08.021.
[24] FAULKNER D R, MITCHELL T M, HEALY D. Slip on ��weak�� faults by the rotation of regional stress in the fracture damage zone [J]. Nature, 2006, 444: 922-925. DOI: 10.1038/nature05353.
[25] ANDERSON E M. The dynamics of faulting [J]. Transactions of the Edinburgh Geological Society, 1905, 8(3): 387-402.
[26] GUDMUNDSSON A, SIMMENES T H, LARSEN B L. Effects of internal structure and local stresses on fracture propagation, deflection, and arrest in fault zones [J]. Journal of Structural Geology, 2010, 32: 1643-1655. DOI: 10.1016/ j.jsg.2009.08.013.
[27] MOUNT V S, SUPPE J. State of stress near the San Andreas Fault: Implications for wrench tectonics [J]. Geology, 1987, 15: 1143-1146. DOI: 10.1130/0091-7613(1987)152.0.CO;2.
[28] QIN Xiang-hui, CHEN Qun-ce, WU Man-lu. In-situ stress measurements along the Beichuan-Yingxiu fault after the Wenchuan earthquake [J]. Engineering Geology, 2015, 194: 114-122. DOI: 10.1016/j.enggeo.2015.04.029.
[29] CAULFIELD R, KIEFFER D S, TSZTOO D F. Seismic design measures for the retrofit of the claremont tunnel [C]// Jacobs Associates, Rapid Excavation and Tunneling Conference (RETC) Proceedings. San Francisco, CA, USA: Jacobs Associates, 2005.
[30] HARRIS R A. Large earthquakes and creeping faults [J]. Reviews of Geophysics, 2017, 55: 169-198. DOI: 10.1002/ 2016RG000539.
[31] ZHANG Jing, WEN Xue-ze, CAO Jian-ling. Surface creep and slip-behavior segmentation along the northwestern Xianshuihe fault zone of southwestern China determined from decades of fault-crossing short-baseline and short-level surveys [J]. Tectonophysics, 2018, 722: 356-372. DOI: 10.1016/j.tecto.2017.11.002.
[32] ZENG Wei, YANG Sheng-qi, TIAN Wen-ling. Numerical investigation on permeability evolution behavior of rock by an improved flow-coupling algorithm in particle flow code [J]. Journal of Central South University, 2018, 25(6): 1367-1385. DOI: 10.1007/s11771-018-3833-5.
[33] BILLI A, SALVINI F, STORTI F. The damage zone-fault core transition in carbonate rocks: implications for fault growth, structure and permeability [J]. Journal of Structural Geology, 2003, 25: 1779-1794. DOI: 10.1016/S0191- 8141(03)00037-3.
[34] DALGIC S. Tunneling in fault zones, Tuzla tunnel, Turkey [J]. Tunnelling & Underground Space Technology Incorporating Trenchless Technology Research, 2003, 18: 453-465. DOI: 10.1016/S0886-7798(03)00045-2.
[35] ZHAO Kun, CHEN Wei-zhong, YANG Dian-sen. Mechanical tests and engineering applicability of fibre plastic concrete used in tunnel design in active fault zones [J]. Tunnelling and Underground Space Technology, 2019, 88: 200-208. DOI: 10.1016/j.tust.2019.03.009.
[36] YAN Gao-ming, SHEN Yu-sheng, GAO Bo. Damage evolution of tunnel lining with steel reinforced rubber joints under normal faulting: An experimental ansd numerical investigation [J]. Tunnelling and Underground Space Technology, 2020, 97: 103223. DOI: 10.1016/j.tust.2019. 103223.
[37] ZUO Jian-ping, WEI Xu, SHI Yue. Experimental study on the ultrasonic and mechanical properties of natural fissure limestone [J]. International Journal of Rock Mechanics and Mining Science, 2020, 125: 104162. DOI: 10.1016/ j.ijrmms.2019.104162.
[38] HU Li, JIANG Shu-yong, ZHANG Yan-qiu. Texture evolution and inhomogeneous deformation of polycrystalline Cu based on crystal plasticity finite element method and particle swarm optimization algorithm [J]. Journal of Central South University, 2017, 24(12): 2747-2756. DOI: 10.1007/ s11771-017-3688-1.
[39] CUNDALL P A. A computer model for simulating progressive, large scale movements in blocky rock systems [C]// Proceedings of the International Symposium Rock Fracture, ISRM, Nancy, 1971, 1(ii-b): 11-8. DOI: https://www. researchgate.net/publication/262685567.
[40] GUNAYDIN O, CETIN H. Determination of stress distribution on active fault by means of Casagrande method: An innovative approach [J]. Soil Dynamics and Earthquake Engineering, 2020, 129: 105920. DOI: 10.1016/j.soildyn. 2019.105920.
[41] DREWS M C, SEITHEL R, SAVVATIS A. A normal-faulting stress regime in the Bavarian Foreland Molasse Basin? New evidence from detailed analysis of leak-off and formation integrity tests in the greater Munich area, SE-Germany [J]. Tectonophysics, 2019, 755: 1-9. DOI: 10.1016/j.tecto. 2019.02.011.
[42] SEDOV L I. Similarity and dimensional methods in mechanics [M]. CRC Press, 2018.
[43] SHAHIDI A R, VAFAEIAN M. Analysis of longitudinal profile of the tunnels in the active faulted zone and designing the flexible lining (for Koohrang-III tunnel) [J]. Tunnelling and Underground Space Technology, 2005, 20: 213-221. DOI: 10.1016/j.tust.2004.08.003.
[44] ROGERS J D, PECK R B. Engineering geology of the bay area rapid transit (BART) system 1964-75 [EB/OL]. [2018-06-11]. http://sonic.net/~mly/www.geolith.com/bart/# orinda.
(Edited by ZHENG Yu-tong)
���ĵ���
��Խ�ϲ���������������们λ�Ƶķֲ�ģʽ
ժҪ����ϲ���们�����Դ�Խ���е�����(��)�����ߵȳ��߹��̵����а�ȫӰ���������ϲ��们λ�Ʒֲ�ģʽ�Ǵ���̽��������Ҫ������ݡ����ڶϲ���Ļ���������������Լ��������ڵ��������ʣ�������ɢԪ���������˲�ͬ���ͺ���ǵĶϲ���ֵģ�͡�����ϲ���们�������Ʊ���Ϊ���ʷֲ��ij����Լ��У����Ʋ�������Բ����ת����װ�öԡ���Ӳ���ֲ�����������ѹŤӦ������µ���ת���顣������ֵģ��������������������ϲ㡢��ϲ㼰���ϲ��λ�Ʒֲ�ģʽ�������������ϲ㡢���ϲ�����ϲ�Ĵ���λ�ƾ���S�ͣ�λ��ģʽ��ϲ����������ԣ�����λ���ڶϲ�������ڵķֲ����ɾ��з�����������ˮƽ��ѹ�̶�Խ�ߣ��������ڵ�λ�Ƽ��г̶�Խ�ߣ������们������Լ70%�Ĵ���λ�Ʋ����ڶϲ���ڡ�
�ؼ��ʣ���ϲ㣻�们��λ��ģʽ����ɢԪ��Բ����ת
Foundation item: Project(U1865203) supported by the Key Projects of the Yalong River Joint Fund of the National Natural Science Foundation of China; Projects(41941018, 51879135) supported by the National Natural Science Foundation of China
Received date: 2020-06-09; Accepted date: 2020-07-31
Corresponding author: LIU Xiao-yan, PhD; Tel: +86-13476831323; E-mail: liuxiaoyan171@mails.ucas.ac.cn; ORCID: https://orcid.org/ 0000-0002-0997-4616

