
Development of processing maps for as-cast ZE41A magnesium alloy
S. ANBU SELVAN1, S. RAMANATHAN1, R. KARTHIKEYAN2, B. K. RAGHUNATH1
1. Department of Manufacturing Engineering, Annamalai University, Annamalai Nagar, 608002, India;
2. Department of Mechanical Engineering, Birla Institute of Technology and Sciences, Dubai
Received 9 February 2009; accepted 21 August 2009
Abstract: The hot deformation behavior of as-cast ZE41A magnesium alloy was studied by employing both processing maps and microstructural observations. To obtain processing map, hot compression tests were performed over a range of strain rates (0.001-1.0 s-1) and temperatures (250-450 ℃). Power dissipation efficiency (η) and instability parameter  were evaluated and processing maps were developed for the strain of 0.5. The dynamic recrystallization (DRX) and instable zones were identified and validated through micrographs. The processing maps can be used to select optimum strain rates and temperatures for effective hot working of the material.
Key words: magnesium alloy; hot deformation; flow stress; processing map; dynamic recrystallization
1 Introduction
In recent years, the structural applications of magnesium alloys in aerospace and automobile industries are increasing progressively. This is because of not only their low densities but also their excellent properties, such as heat dissipation, damping, electromagnetic shielding and recycling[1-3]. The inherently poor workability of magnesium and several of its alloys is due to the limited number of slip systems associated with the HCP crystal structure. This restricts the utility of these alloys mostly in the as-cast condition. Although there are several studies addressing the issues specific to superplastic deformation in the commercial wrought Mg alloys, only a few have focused on the hot deformation behavior of as-cast Mg alloys[4]. MYSHLYAEV et al[5] have studied the microstructural development in as-cast Mg alloy AZ31 during hot working and have characterized the microstructural features with reference to the associated mechanisms such as twinning, dynamic recovery (DRY) and dynamic recrystallization (DRX) under limited deformation conditions. SIVAKESAVAM and PRASAD[6] have investigated the hot deformation behavior of as-cast Mg-2Zn-1Mn alloy. They suggested that dynamic recrystallization (DRX) occurred at 450 ℃ and 0.1 s-1. Also grain boundary cracking occurred at 450 ℃ and lower strain rates. In the as-cast ZE41A magnesium alloy, addition of zinc to magnesium improves its strength and creep resistance. The addition of rare earth element improves grain refinement, heat resistant capacity and high temperature properties of Mg alloys. The aim of the present investigation is to study the hot deformation behavior of as-cast ZE41A magnesium alloy using the processing map technique and to establish the safe and unsafe domains. Domains are validated through microstructure observations. Processing maps help in identifying temperature―strain rate windows for hot working where the intrinsic workability of the material is the maximum (e.g. dynamic recrystallization (DRX) or super-plasticity) and also in avoiding the regimes of flow instabilities (e.g. adiabatic shear bands or flow localization).
2 Development of processing maps
The processing maps were developed on the basis of Dynamic Materials Model[7], which was recently reviewed by PRASAD and SESHACHARYULU[8]. In this model, the workpiece is considered to be a dissipater of power. At any instant the total power dissipated consists of two complementary parts, G content and J co-content. G content represents the power dissipation through a temperature rise and J co-content represents the power dissipation through metallurgical processes. The factor that partitions power between G and J is the strain rate sensitivity (m) of flow stress. The strain rate sensitivity is the inverse of the stress exponent (n) in the standard kinetic rate equation which describes the hot deformation.
The load―stroke curves obtained in compression at a constant temperature and true strain rate were converted into true stress―strain curves using standard equations. The flow stress data as a function of temperature, strain rate and strain were obtained from the above curves and used for constructing the power dissipation maps. The logarithmic flow stress versus logarithmic strain rate data were fitted using a cubic spline and the strain rate sensitivity (m) was calculated as a function of strain rate. The J co-content is given by
J=σ m/(m+1) (1)
where σ is the flow stress and is the strain rate. For an ideal linear dissipater, m=1 and J=Jmax= /2. The efficiency of power dissipation of a non-linear dissipator may be expressed as a dimensionless parameter:
η=J/Jmax=2m/(m+1) (2)
The variation of efficiency which is usually expressed as percent with temperature and strain rate represents the power dissipation characteristics occurring through microstructural changes in the workpiece and constitutes a power dissipation map. This map exhibits different domains, which may be correlated with specific microstructural process. According to criterion developed by PRASAD and SESHACHARYULU[9], flow instability will occur if
ξ ={δln[m/(m+1)]/δln}+m<0 (3)
The variation of instability parameter  with temperature and strain rate constitutes an instability map, which may be super-imposed on the power dissipation map, giving a processing map to delineate instability regimes of negative values. This methodology has been used to optimize hot workability of various materials[10].
3 Experimental study
The chemical composition (mass fraction, %) of the alloy used in this investigation was Zn, 3.85; Ce, 1.27; Zr, 0.53; Cu, 0.002; Al, 0.006; Mn, 0.008; Fe, 0.004; Si, 0.003; Ni, 0.002 and balance Mg. The starting material was a sand-cast ingot. The initial microstructure of as-cast ZE41A magnesium alloy is shown in Fig.1. Cylindrical specimens of 10 mm in diameter and 10 mm in height were prepared for hot compression test. Concentric grooves were provided on the faces of the specimens to ensure effective lubrication during compression. The temperature of the specimen was monitored with a thermocouple embedded in a d 0.8 mm hole drilled in the half the height of the specimen. This thermocouple was also used for the measurement of the adiabatic temperature rise in the specimen during deformation. A 10 t servo controlled universal testing machine was used for conducting the hot compression tests. The tests were conducted for different strains (0.1-0.5), strain rates (0.001-1.0 s-1) and temperatures (250-450 ℃). In each case, the specimens were compressed to half their height and load displacement data were obtained. The deformed specimens were quenched in water and sectioned parallel to the compression axes. The cut surface was polished and etched with an aqueous solution containing 10% picric acid. The microstructure of the specimens was obtained through Versamet 2.0 optical microscope with Clemex Vision Image Analyzer and mechanism of deformation was studied. Using the flow stress data, power dissipation efficiency and flow instability were evaluated for different strain rates and temperatures at a constant strain of 0.5. The processing maps were developed for the strain of 0.5 for as-cast ZE41A magnesium alloy.
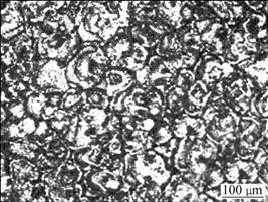
Fig.1 Initial microstructure of as-cast ZE41A magnesium alloy
4 Results and discussion
4.1 Flow curves
The compression tests on cylindrical as-cast ZE41A magnesium alloy were conducted in the temperature range of 250-450 ℃ and strain rate range of 0.001-1.0 s-1. Flow stress values were obtained from the load―stroke data. The flow curves are used to interpret the type of mechanism involved in deformation under particular condition. The steady state flow curve at lower strain rate and temperature represents dynamic recovery and dynamic recrystallization and it is associated with single peak or multi peak flow curves at comparatively higher strain rates and temperature. The drop in flow stress after a peak at higher strain rate represents flow softening[11]. The flow curves obtained for as-cast ZE41A magnesium alloy deformed in compression at 350 ℃ and for different stain rates ranging from 0.001 s-1 to 1.0 s-1 are presented in Fig.2. It can be found that flow stress decreases with decreasing strain rate. Also flow softening occurs at higher strain rates and steady-state flow occurs at lower strain rates. This agrees well with the result of SIVAKESAVAM and PRASAD[6]. The flow curves obtained at different temperatures ranging from 250 to 450 ℃ and 0.1 s-1 are shown in Fig.3. At lower temperatures, the strain hardening is intensified and steady state is obtained at higher temperatures. At lower temperatures the material exhibits severe work hardening followed by continuous flow softening. At higher temperatures, the flow softening behaviour is distinctly different. The initial work hardening component is reduced and the material exhibits only steady-state flow behavior. This is in good agreement with WANG et al[12].

Fig.2 Flow curves of as-cast ZE41A magnesium alloy for different strain rates at constant temperature of 350 ℃
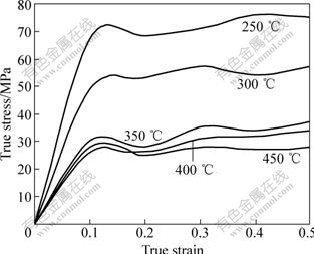
Fig.3 Flow curves of as-cast ZE41A magnesium alloy for different temperatures at constant strain rate of 0.1 s-1
4.2 Processing map
The processing map obtained at the strain of 0.5 is shown in Fig.4. The contour numbers represent percentage efficiency of power dissipation, shaded region shows the instability domain and other areas represent stability domains. The map obtained at other strain of 0.1, 0.2, 0.3 or 0.4 is similar to that of the map obtained at the strain of 0.5, which indicates that there is no significant effect of strain. The processing map for the strain of 0.5 shows a domain in the temperature range of 330-380 ℃ and strain rate range of 0.01-0.1 s-1 with peak efficiency of about 34% occurring at 360 ℃. The microstructure obtained at 350 ℃ and 0.1 s-1 is shown in Fig.5. Dynamic recrystallization (DRX) may be considered[13] to consist of two competing processes such as formation of interfaces (nucleation) and migration of interfaces (growth). The nucleation consists of the formation of a grain boundary due to the dislocation generation, simultaneous recovery and rearrangement. This interface will become a nucleus for DRX when it attains a critical configuration, i.e. at a large angle boundary. The nucleus will grow by the process of grain boundary migration. Under hot working conditions, the material acts essentially as a dissipater of power, which gives the driving force for the migration of interfaces. So, there is a reduction of the total interface energy. When nucleation and growth simultaneously occur, the slower of these two will be the controlling step for DRX. Under constant true strain rate conditions, the rate of formation of interfaces will complete with the rate of migration, such that the true strain rate remains constant with increasing strain. The relative values of these two rates will determine the shape of the stress―strain curves. If these two rates lead to comparable changes in the interface area, steady state stress―strain curves will result in. If the rate of the interface formation is lower than the rate of migration, the material will have to undergo a certain strain before the critical configuration of the interface for migration is achieved. At this critical strain, a large number of interfaces migrate, leading to softening. The microstructure (Fig.5) has the three features as follows: 1) equiaxed grain is formed in the band structure by compression; 2) grain size is fine compared with initial grain size which is indicative of refinement of grain; and 3) grain boundaries are irregular (or) wavy in nature. These features agree well with DRX observed by WANG et al[12]. The above domain represents complete DRX process which is desirable and ‘safe’ for processing. Microstructure analysis shows that the initial structure has been replaced by recrystallized structure. The grain boundaries are irregular in shape. The first domain, therefore, can be interpreted to represent the region of possible DRX. At higher temperature, usually above 0.7Tm and at higher strain rates, many metals recrystallize dynamically. During DRX, the flow is stable and microstructure is reconstituted[14]. Therefore, the optimum domains for DRX occur in the temperature range of 330-380 ℃ and strain rate range of 0.02-0.06 s-1 with peak efficiency of 34%. It is identified as optimum working regions.
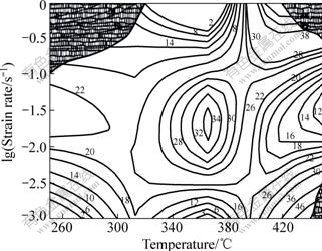
Fig.4 Processing map of as-cast ZE41A magnesium alloy at strain of 0.5

Fig.5 DRX observed at temperature of 350 ℃ and strain rate of 0.1 s-1
4.3 Flow instability
The microstructures of three instability regions on the processing map demarcated from the stable flow region are shown in Figs.6-8. The regimes have negative value of and will exhibit flow instability. The region I occurs at lower strain rates (<0.01 s-1) while regions Ⅱ and Ⅲ occur at higher strain rates (>0.1 s-1). Generally, instability is associated with high rates of deformation which is due to localized shear.

Fig.6 Wedge cracking observed at temperature of 450 ℃ and strain rate of 0.001 s-1
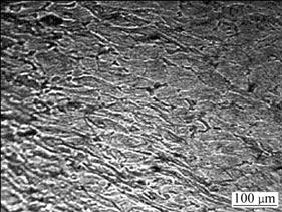
Fig.7 Adiabatic shear band observed at temperature of 300 ℃ and strain rate of 1.0 s-1
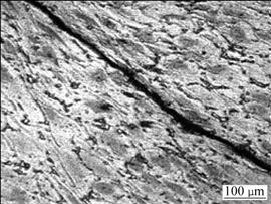
Fig.8 Matrix cracking observed at temperature of 450 ℃ and strain rate of 1.0 s-1
At 400 ℃ and 0.01 s-1 the material exhibits exceptional grain growth, as shown in Fig.9, which explains the decrease in formability due to loss of super-plasticity[15]. In this domain, the grains grow quickly due to higher temperature and concurrently fine grains appear at grain boundaries. The microstructure is highly uneven and flow instability is caused by uneven deformation of grain boundary. As the deformation temperature increases beyond the temperature corresponding to the peak efficiency, the grain size increases and abnormal grain growth is observed at higher temperatures and lower strain rates. Abnormal coarse grains do not favor grain boundary sliding (GBS) even at lower rates of deformation. The absence of GBS eliminates cavitation during deformation at these temperatures[4].
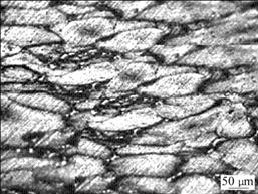
Fig.9 Grain elongation observed at temperature of 400 ℃ and strain rate of 0.01 s-1
Fig.6 represents the formation of wedge cracking at 450 ℃ and 0.001 s-1. According to RAJ maps[16], the domain occurring at higher temperatures and lower strain rates represents the process of grain boundary sliding. The stress concentrations occurring at the grain boundary triple junctions, if not relieved by accommodation process, will result in wedge cracking. SIVAKESAVAM and PRASAD[6] reported that at higher temperatures (>450 ℃) and at lower strain rates (0.001 s-1), grain boundary cracking appeared. GANESAN et al[17] also reported that at low strain rates and higher temperatures the grain boundary sliding occurs under shear stress. When the diffusion rates are not large enough, wedge cracking occurs at the grain boundary triple junctions. The state of stress will have a significant influence on the manifestation of these cracks. Wedge cracking is reduced by increasing the strain rate or decreasing the temperature, which reduces the extent of grain boundary sliding. So, these temperatures and strain rates should be avoided in processing the material.
Fig.7 shows the formation of shear bands occurring at a temperature of 300 ℃ and a high strain rate of 1.0 s-1. These adiabatic shear bands generally occur sharply at 45? with respect to the principal stress axis. This is in good agreement with RAMANATHAN et al[18]. Localization may occur in two modes. In the first mode of localization, discontinuous deformation often localizes in narrow zones and the neighboring regions remain intact. Factors such as material compositions, boundary conditions and type of loading may affect localization. A material can fail due to the formation and growth of micro cracking at randomly distributed locations. In the second mode, localization may result in motions along preferential directions called shear bands and can lead to extensive deformation and failure[19]. Localization usually occurs at peak load but sometimes it may occur before reaching peak. Beyond peak, the material may experience softening or degradation in its load carrying capacity, but it still continues to carry reduced load compared with peak load while growth and coalescence of micro cracks continue during the falling region of the curve. Finally, the micro crack growth leads to a macro crack and fracture. In the case of low temperature and high strain rate, the fine grains formed at the mantle provide the potential path for localized shear zone. The model was proposed by ION et al[20] in Mg-0.8%Al and they found that the favourable orientation of such fine grains for basal slip along with the constraints imposed by the neighboring grains makes the deformation localized, leading to shear bands. At higher strain rates, heat generated due to local temperature rise by plastic deformation is not conducted away to the cooler regions of the body since the available time is too short. The flow stress in deformation will get lowered and further plastic flow will be localized. The band gets intensified and nearly satisfies adiabatic shear bands, which exhibit cracking, recrystallization along macroscopic shear planes[21]. So, these conditions may be avoided in processing this material.
Fig.8 shows the formation of macro cracks at a temperature of 450 ℃ and a high strain rate of 1.0 s-1. WANG et al[22] suggested that the flow of matrix that occurs at high temperatures causes large local stresses, resulting in deformations and breakage. As the temperature increases, this stress would cause local plastic deformation. When the stress is higher than the fracture stress, the material would crack, resulting in complete failure. So, these conditions may be avoided in processing this material.
5 Conclusions
1) Flow stress decreases with decreasing strain rate. Also flow softening occurs at higher strain rates and steady-state flow occurs at lower strain rates. At lower temperatures, the strain hardening is found to be high and it decreases with the increase in temperature.
2) The optimum domains for dynamic recrystallization (DRX) occur in the temperature range of 330-380 ℃ and strain rate range of 0.02-0.06 s-1 with peak efficiency of 34% and it is identified as optimum working regions.
3) Wedge cracking is obtained in the temperature range of 440-450 ℃ at lower strain rate of 0.001 s-1 with peak efficiency of 48%. Adiabatic shear band occurs in the temperature range of 250-300 ℃ and strain rate of 1.0 s-1. Matrix cracking occurs in the temperature range of 420-450 ℃ and strain rate of 1.0 s-1. Therefore, these temperatures and strain rates should be avoided in processing the material.
Acknowledgement
The authors are grateful to Hindustan Aeronautic Limited (HAL), Bangalore, India, for providing material and technical assistance.
References
[1] LEE S, CHEN Y H, WANG J Y. Isothermal sheet formability of magnesium alloy AZ31 and AZ61 [J]. Material Processing and Technology, 2002, 124: 19-24.
[2] TAKUDA H, ENAMI T, KUBOTA K. The formability of a thin sheet of Mg-8.5Li-1Zn alloy [J]. Material Processing and Technology, 2000, 101: 281-286.
[3] TAKUDA H, FUJIMOTO H, HATTA N. Modelling of flow stress of Mg-Al-Zn alloys at elevated temperatures [J]. Material Processing and Technology, 1998, 80/81: 513-516.
[4] SRINIVASAN N, PRASAD Y V R K, RAMA RAO P. Hot deformation behavior of Mg-3Al alloy [J]. Materials Science and Engineering A, 2008, 476: 146-156.
[5] MYSHLYAEV M M, MCQUEEN H J, MWEMBELA A, KONOPLEVE E. Twinning, dynamic recovery and recrystallization in hot worked Mg-Al-Zn alloy [J]. Materials Science and Engineering A, 2002, 337: 121-126.
[6] SIVAKESAVAM O, PRASAD Y V R K. Hot deformation behavior of as cast Mg-2Zn-1Mn alloy in compression [J]. Materials Science and Engineering A, 2003, 362: 118-124.
[7] PRASAD Y V R K, GEGEL H L, DORAIVELU S M, MALAS J C, MORGAN J T, LARK K A, BARKER B R. Modelling of dynamic material behavior in hot deformation: Forging of Ti-6242 [J]. Metallurgical Transactions A, 1984, 15: 1883-1892.
[8] PRASAD Y V R K, SESHACHARYULU T. Modelling of hot deformation for microstructural control [J]. International Materials Review, 1998, 43: 243-258.
[9] PRASAD Y V R K, SESHACHARYULU T. Resent advances in the science of mechanical processing [J]. Indian Journal of Technology, 1990, 28: 435-451.
[10] PRASAD Y V R K, SASIDHARA S. Hot working guide for a compendium of processing maps [M]. Russell Township: ASM International, Materials Park, 1997.
[11] DIGHE M D, GOKHALE A M, HORSTEMEYER M F, MOSHER D A. Effect of strain rate on damage evolution in a cast Al-Si-Mg base alloy [J]. Metallurgical and Materials Transactions A, 2000, 31: 1725-1731.
[12] WANG C Y, WANG X J, CHANG H, WU K, ZHENG M Y. Processing maps for hot working of ZK60 magnesium alloy [J]. Materials Science and Engineering A, 2007, 464: 52-58.
[13] RAVICHANDRAN N, PRASAD Y V R K. A study using processing maps [J]. Bulletin of Material Science, 1991, 14: 1241-1248.
[14] PRASAD Y V R K, SESHACHARYULU T, MEDEIROS S C, FRAZIER W G. Effect of perform microstructure on the hot working mechanisms in ELI grade Ti-6Al-4V: Transformed β v equiaxed (α+β) [J]. Materials Science and Technology, 2000, 16: 511-516.
[15] KRIDLI T, SHERIF E G, RICHARD L. Development of processing maps for super plastic forming of weldaliteTM 049 [J]. Materials Science and Engineering A, 1998, 244: 224-232.
[16] RAJ R. Development of processing map for use in warm-forming and hot-forming process [J]. Metallurgical Transactions A, 1981, 12: 1089-1097.
[17] GANESAN G, RAGHUKANDAN K, KARTHIKEYAN R, PAI B C. Development of processing maps for 6061 Al/15% SiCp composite material [J]. Materials Science and Engineering A, 2004, 369: 230-235.
[18] RAMANATHAN S, KARTHIKEYAN R, GANESAN G. Development of processing maps for 2124 Al/ SiCp composites [J]. Materials Science and Engineering A, 2006, 441: 321-325.
[19] RAMANATHAN S, KARTHIKEYAN R, MANOJ G. Development of processing maps for Al/SiCp composite using fuzzy logic [J]. Material Processing and Technology, 2007, 183: 104-110.
[20] ION S E, HUMPERYS F J, WHITE S H. Dynamic recrystallization and the development of microstructure during the high temperature deformation of magnesium alloy [J]. Acta Metallurgica, 1982, 30:1909-1919.
[21] ZHANG B L, MACLEAN M S, BAKER T M. Hot deformation behavior of aluminium alloy 6061/SiCp power metallurgy route [J]. Material Science Technology, 2000, 16: 897-902.
[22] WANG C Y, WU K, ZHENG M Y. Hot deformation and processing maps of Al18B4O33W/ZK60 composite [J]. Materials Science and Engineering A, 2008, 477: 179-184.
Corresponding author: S. ANBU SELVAN; Tel: +91-9865387907; Fax: +91-4144239734; E-mail: anbushankari@yahoo.co.in
DOI: 10.1016/S1003-6326(09)60091-1
(Edited by YANG Bing)

