Centrifugal and field studies on water infiltration characteristics below canals under wetting-drying-freezing-thawing cycles
��Դ�ڿ������ϴ�ѧѧ��(Ӣ�İ�)2021���5��
�������ߣ������� ���� ��Ӣ�� �ų� ������ ���
����ҳ�룺1519 - 1533
Key words��wetting-drying; freezing-thawing; water infiltration; crack; canals; centrifugal model test
Abstract: Seepage is one of the main causes for the deformation and instability of canal slopes in Xinjiang, China. In this study, centrifugal model tests under wetting-drying (WD) and wetting-drying-freezing-thawing (WDFT) cycles were performed to investigate the water infiltration characteristics below a canal. The results show that the shallow soil of the canal models was fully saturated in the wetting process. Compared with the canal model under the WD cycles, the canal model under the WDFT cycles had larger saturated areas and a higher degree of saturation below the canal top after each cycle, indicating that the freezing-thawing (FT) process in the WDFT cycles promoted the water infiltration behavior below the canal slope. The cracks on the surface of the canal model under the cyclic action of WDFT developed further and had a higher connectivity, which provided the conditions for slope instability from a transverse tensile crack running through the canal top. On this basis, a field test was conducted to understand the water infiltration distribution below a typical canal in Xinjiang, China, which also verified the accuracy of the centrifugal results. This study provides a preliminary basis for the maintenance and seepage treatment of canals in Xinjiang, China.
Cite this article as: ZHU Rui, CAI Zheng-yin, HUANG Ying-hao, ZHANG Chen, GUO Wan-li, ZHU Xun. Centrifugal and field studies on water infiltration characteristics below canals under wetting-drying-freezing-thawing cycles [J]. Journal of Central South University, 2021, 28(5): 1519-1533. DOI: https://doi.org/10.1007/s11771-021-4703-0.

J. Cent. South Univ. (2021) 28: 1519-1533
DOI: https://doi.org/10.1007/s11771-021-4703-0

ZHU Rui(����)1, 2, CAI Zheng-yin(������)1, HUANG Ying-hao(��Ӣ��)1,ZHANG Chen(�ų�)1, GUO Wan-li(������)1, ZHU Xun(���)1
1. Geotechnical Engineering Department, Nanjing Hydraulic Research Institute, Nanjing 210024, China;
2. College of Civil and Transportation Engineering, Hohai University, Nanjing 210098, China
 Central South University Press and Springer-Verlag GmbH Germany, part of Springer Nature 2021
Abstract: Seepage is one of the main causes for the deformation and instability of canal slopes in Xinjiang, China. In this study, centrifugal model tests under wetting-drying (WD) and wetting-drying-freezing-thawing (WDFT) cycles were performed to investigate the water infiltration characteristics below a canal. The results show that the shallow soil of the canal models was fully saturated in the wetting process. Compared with the canal model under the WD cycles, the canal model under the WDFT cycles had larger saturated areas and a higher degree of saturation below the canal top after each cycle, indicating that the freezing-thawing (FT) process in the WDFT cycles promoted the water infiltration behavior below the canal slope. The cracks on the surface of the canal model under the cyclic action of WDFT developed further and had a higher connectivity, which provided the conditions for slope instability from a transverse tensile crack running through the canal top. On this basis, a field test was conducted to understand the water infiltration distribution below a typical canal in Xinjiang, China, which also verified the accuracy of the centrifugal results. This study provides a preliminary basis for the maintenance and seepage treatment of canals in Xinjiang, China.
Key words: wetting-drying; freezing-thawing; water infiltration; crack; canals; centrifugal model test
Cite this article as: ZHU Rui, CAI Zheng-yin, HUANG Ying-hao, ZHANG Chen, GUO Wan-li, ZHU Xun. Centrifugal and field studies on water infiltration characteristics below canals under wetting-drying-freezing-thawing cycles [J]. Journal of Central South University, 2021, 28(5): 1519-1533. DOI: https://doi.org/10.1007/s11771-021-4703-0.
1 Introduction
Xinjiang, China, is a typical arid region. To realize the optimal allocation of water resources, several canals have been built successively there in recent years [1, 2]. These canals start water transfer in spring and stop water transfer in autumn, resulting in rise and fall processes of the water level in a year. The moisture changes of the soil below the canal structure throughout the year can be simplified as a wetting-drying (WD) process [3]. Additionally, these canals are located in a mid-latitude area. The lowest temperature at night in winter is below -40 ��C, and the highest temperature in summer is above 30 ��C [4]. Accordingly, if temperature changes are taken into account, it would be a wetting-drying-freezing-thawing (WDFT) process [5], as shown in Figure 1. Under the cyclic action of WDFT, canals leaked severely due to the poor anti-seepage effect [6]. Consequently, significant water infiltration occurs below the canals, which causes great hidden dangers to the stable operation of the canals [7-9]. Figure 2 shows the typical failure characteristics of a main canal in northern Xinjiang, China. As a result of water infiltration for many years, the main canal presents frost heave deformation in winter and the landslides occur in summer [10, 11].
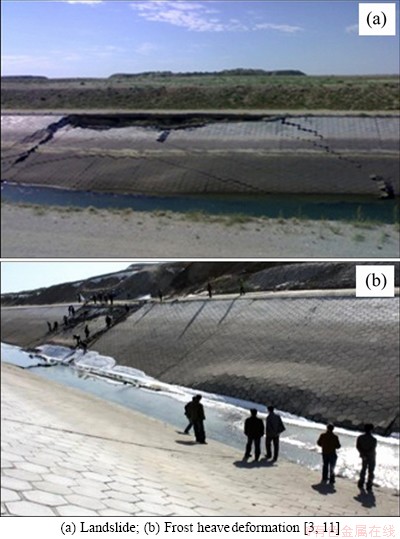
Figure 1 Typical failure characteristics of a main canal in Northern Xinjiang, China:
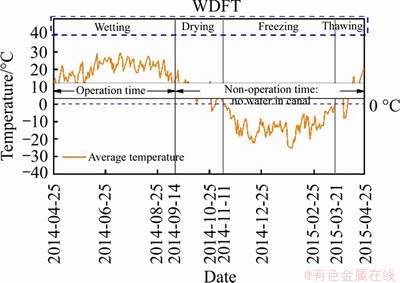
Figure 2 Simplified WDFT processes
In view of this fact, a number of experimental studies [12, 13], numerical studies [14], theoretical studies [15, 16] and field studies [17] have been carried out on in-depth investigations of water infiltration below the canals. FU et al [18, 19] observed the water infiltration process under different slope ratios, infiltration heads, and canal bottom widths in laboratory tests. On this basis, a theoretical model was proposed to simulate the movement of the wetting front dynamically and effectively below the canal. YAO et al [20] assessed the leakage characteristics of canals through ponding tests in Northwest China by measuring the seepage rate and soil moisture content and performed a further analysis using a saturated�Cunsaturated flow model. SOLOMON et al [21] calculated the flow volume into the drainage region using a finite element program. When the drainage distance is large, the anti-seepage effect of the canal lining is reduced. ZHANG et al [22] studied the variation characteristics of water infiltration through seepage tests and found that the water depth in the canal had a great influence on the infiltration rate. These studies help us to understand the mechanism of water infiltration to a certain extent [8].
As previously mentioned, the canals in Xinjiang, China, have a poor anti-seepage ability. To reduce canal slope instability caused by water infiltration [21, 23], local management decided to build drainage below the canals. However, studies related to the water infiltration below these canals are very scarce in the literature. Consequently, current studies may not provide a good reference for drainage construction.
Accordingly, the objective of this study is to investigate the water infiltration characteristics below the canal under the cyclic action of WDFT. The centrifugal modeling technique was used to study the water infiltration distribution in the canal models under WD and WDFT cycles due to the self-weight stress equality [24]. On this basis, the effect of the freezing-thawing (FT) process in the WDFT cycles on water infiltration was also analyzed. Additionally, a field study was conducted for a further analysis of the water infiltration distribution below the canal. Through this study, we expect to provide a preliminary basis for the maintenance and seepage treatment of canals in Xinjiang, China.
2 Centrifugal model test
2.1 Test schemes and methods
Centrifugal model tests, M1 under the WD cycles and M2 under the WDFT cycles, were conducted to investigate the water infiltration characteristics. Both M1 and M2 were performed at an acceleration of 50g at the Nanjing Hydraulic Research Institute, China. The centrifugal equipment was installed on a large-size geotechnical centrifuge, which has a 5.5 m radius. Figure 3 shows the diagrammatic sketch of the centrifugal equipment, which included a WD system and a heat exchanger. The WD system consisted of a water injection and drainage system and two vents switched by pistons, which correspond to the simulation of the wetting process and drying process, respectively. Specifically, the water injection and drainage system was driven by air pressure. That is, water was injected into the canal model by controlling the air pressure in the sealed tank, and the water was drained out by the hydraulic gradient magnified by the centrifugal field as the air pressure in the sealed tank was equal to that in the test room. The vents switched by pistons on both sides of the model box were driven by hydraulic pressure. The moisture in the canal model would be removed through the generated air via the rotation of the centrifuge, which simulates well the air-drying process of on-site canals. Additionally, the heat exchanger consists of semiconductor devices [25, 26]. It produces a linear variation at the temperature after inputting DC power and can realize a temperature variation range from -40 to 30 ��C in the model box, which can simulate well the freezing process and thawing process [27]. All the above processes are performed in the control room after the centrifuge turns on.
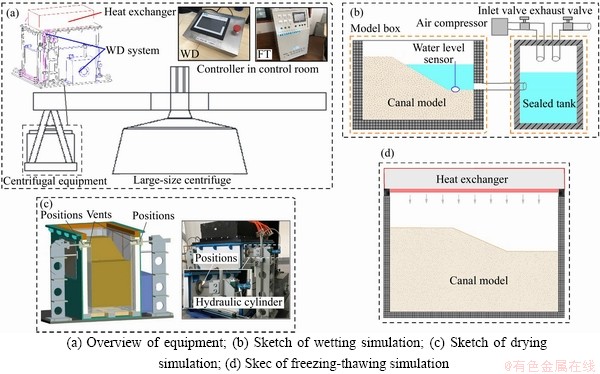
Figure 3 Centrifugal equipment:
In the centrifugal model tests, homogeneous soil was prepared to obtain a dry density of 1.6 t/m3 for both M1 and M2. After a series of measurements [28-31], some fundamental soil properties are shown in Table 1, and the grain size distribution of the soil is shown in Figure 4. According to the studies in Ref. [32], the cohesion and internal friction angel of tested soil are decreased by approximately 33% and 24.7% after the 3rd WDFT cycle, respectively. Additionally, Figure 5 presents the diagrammatic sketch of the canal cross section. Based on the section symmetry, half of the canal model was prepared in the model box.
Table 1 Fundamental properties of soils
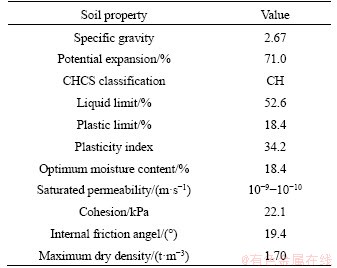
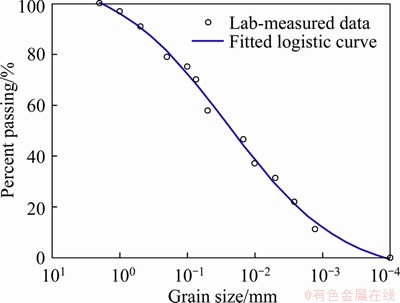
Figure 4 Grain size distribution of fundamental soil

Figure 5 Diagrammatic sketch of canal cross section (Unit: mm)
Specifically, the air-dried soils were ground and sieved through a 2-mm sieve. Then, the prepared soils were sealed in a geomembrane for 48 h for a uniform initial soil moisture content (18.4%). According to the Chinese Energy Administration DL/T-5102 [33], canal models, which have a thickness of 300 mm, were divided into six layers of compaction. During the preparation process, sensors were arranged according to the scheme. Finally, the compacted canal models were excavated for a designated canal slope.
In addition, both M1 and M2 were designed for three cycles with the measurement of pore water pressure. Specifically, pore water pressure sensors (P1-P9) were used to monitor the water infiltration inside the canal models during the wetting process in the WD cycles (M1) or WDFT cycles (M2). These sensors have a diameter of 13 mm and a length of 12.5 mm, and their measuring range and measuring accuracy are 0-100 kPa and ��0.01 kPa, respectively. In addition, three platinum resistance sensors (T1-T3), with diameter of 2 mm and length of 20 mm, were arranged in M2 to monitor the variation in the soil temperature. The measuring range and measuring accuracy of these temperature sensors are -50 to 200 ��C and �� 0.01 ��C, respectively. After the centrifuge stopped, the soil moisture content in the canal model was measured by sampling. The sensor arrangement and measuring points are shown in Figure 6.
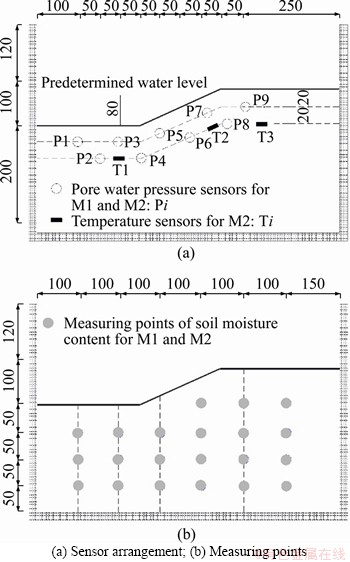
Figure 6 Sensor arrangement and measuring points:
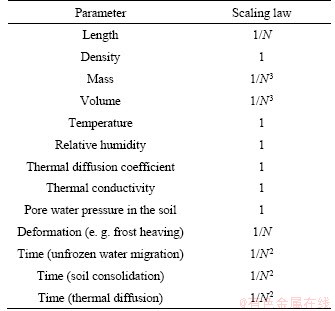
The scaling law is the theoretical basis for the centrifugal model test, which means the ratio (1/N) of model to prototype. BUTTERFIELD [34, 35], ZHANG et al [36] established the scaling laws of frozen soil in centrifugal model tests using dimensional analysis method. The summary of relevant scaling laws in the above literatures is presented in Table 2. It indicates that the time for unfrozen water migration, soil consolidation and thermal diffusion in the models is N2 times greater than the corresponding values in the prototype. On this basis, the wetting processes and drying processes were determined by the simplified WDFT process (Figure 1), which were 80 and 33 min, respectively, for both M1 and M2. The freezing process ended as the frozen depth in the canal model reached 40 mm (T1, T2 and T3 were all below 0 ��C), whereas the thawing process stopped as the entire canal model thawed (T1, T2 and T3 were all above 0 ��C). This termination criterion for the freezing process and thawing process in M2 was adopted for the purpose of obtaining the most unfavorable conditions: a maximum frozen depth of 2 m (40 mm in the models) along the canals, as shown in Figure 7.
Table 2 Summary of relevant scaling laws
In M1, the canal model successively experienced the wetting process and drying process. The wetting process simulated the rise-fall process of the water level in the canal model, and the predetermined water level was 80 mm. First, open the inlet valve by the remote controller to force air into the water tank to inject water into the canal model through the water pipes after the centrifuge was at stable acceleration. In this study, the centrifugal acceleration was 50g, indicating that the ratio (1/N) of model to prototype is 1/50. Then, water started to rise from the canal bottom in the model box. Once the target water level (80 mm) was measured by sensors, the remote controller would automatically close the inlet valve to maintain the water level at the target water level. After 80 min, open the exhaust valve by the remote controller to reduce the pressure value in the water tank. The water in the model box would flow back to the water tank from top to bottom through the hydraulic gradient difference amplified by the centrifugal field. When the wetting process was over, the pistons were retracted through the remote controller and then the air generated via centrifuge rotation flowed above
the canal model, which took moisture out of the model box from the vents. The drying process lasted for 33 min, and then the piston was extended. The cyclic action of WD in M1 was simulated by repeating the above two steps three times.
In M2, the canal model successively experienced the wetting process, drying process, freezing process and thawing process. Specifically, the simulation of wetting process and drying process was the same as that mentioned above in M1. During the freezing process, the canal model was cooled through the heat exchanger with a designed temperature variation curve, which had a freezing temperature of -40 ��C. As the frozen depth in the canal model reached 40 mm (T1, T2 and T3 were all below 0 ��C), the cooling mode of the heat exchanger stopped, indicating that the freezing process ended. Then, the canal model was heated through the heat exchanger according to the designed thawing temperature of 30 ��C. Similarly, the thawing process ended as the entire canal model thawed (T1, T2 and T3 were all above 0 ��C), indicating that a complete WDFT cycle finished. The cyclic action of WDFT was simulated by repeating the above four steps three times.
2.2 Test results
2.2.1 Response of temperature sensors
Figure 8 shows the curves of temperature variation with time in M2. As shown in Figure 8, the readings of the temperature sensors show an upward trend in the wetting process and drying process due to water infiltration. During the freezing process, the readings decreased to a negative temperature and then returned to a positive temperature in the subsequent thawing process. In the cyclic WDFT processes, the responses of the temperature sensors indicated that the temperature field of the on-site canals was simulated well in M2.
2.2.2 Analysis of pore water pressure
Figure 9 shows the curves of the pore water pressure variation with time in M1 and M2 during the wetting process. As shown, the readings of the pore water pressure sensors successively showed an upward trend (I), constant trend (II) and downward trend (III) with the rise-fall process of the water level, which simulated the operation stage of the on-site canals well.
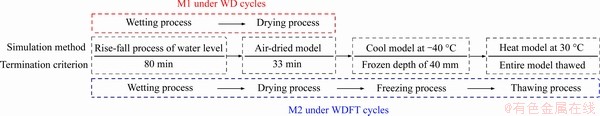
Figure 7 Simulation method and termination criterion for M1 and M2
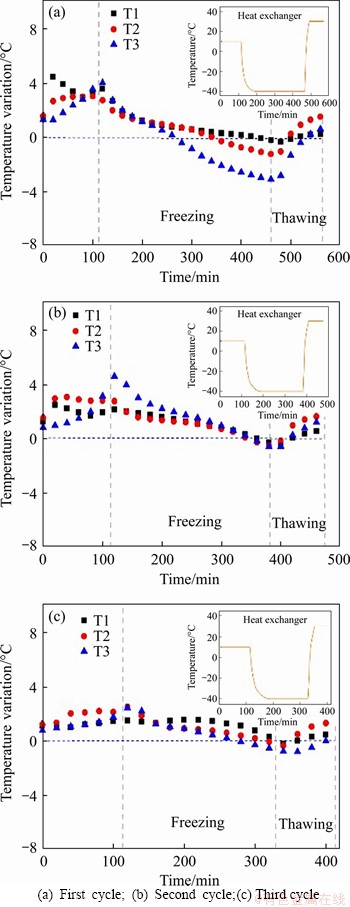
Figure 8 Curves of temperature variation with time in M2 and heat exchanger:
Specifically, in the first wetting process, the readings of P3, P4 and P5 in M1 and P1, P3, P4 and P5 in M2 were approximately consistent with the calculated values of the corresponding hydrostatic pressure, which indicated that the soils at the above positions in the canal model have been close to saturation. It was noted that the readings of P1, P2 and P6 in M1 and P2 and P7 in M2 all increased with decreasing subsequent. It is mainly because the soil was consolidated and compacted due to the wetting deformation. Consequently, the infiltration rate from shallow soil to deep soil in the canal model is greater than that from water above the canal to shallow soil [3, 37], indicating that pore water pressure dissipation occurred at some areas inside the shallow soil during the first wetting process. Similarly, in the second and third wetting processes, the readings of all the sensors except P8 and P9 in M1 and all the sensors in M2 were consistent with the calculated values. This result indicated that the canal models had a further water infiltration behavior with increasing cycles, and the canal model under the cyclic action of WDFT had a more significant water infiltration. Additionally, the phenomenon of pore water pressure dissipation did not occur in the second and third wetting processes. This meant that the shallow soil in the canal model had almost been fully saturated.
2.2.3 Analysis of saturated areas
Based on the measured pore water pressure in the cyclic processes and the measured soil moisture content after the tests, schematic diagrams of saturated areas in the canal model are shown in Figure 10. It is indicated that the saturated areas in the canal model increased with increasing cycles. In the meantime, the maximum depth (hmax) along the vertical direction in the saturated areas was selected for a better analysis of water infiltration. In M1, the maximum depth of the saturated areas appeared below the junction of the bottom and slope in the first wetting process and then transferred toward the bottom in the second and third wetting processes. In M2, the position of the maximum depth of the saturated areas in the first wetting process was similar to that in M1. However, the positions of the maximum depths in the second and third wetting processes developed toward the slope. Meanwhile, the vertical depths of saturated area below the canal bottom in M2 had no significant changes compared with those in M1. The difference between M1 and M2 indicated that to some extent, the freezing-thawing processes in the WDFT cycles promoted the water infiltration behavior below the canal slope.
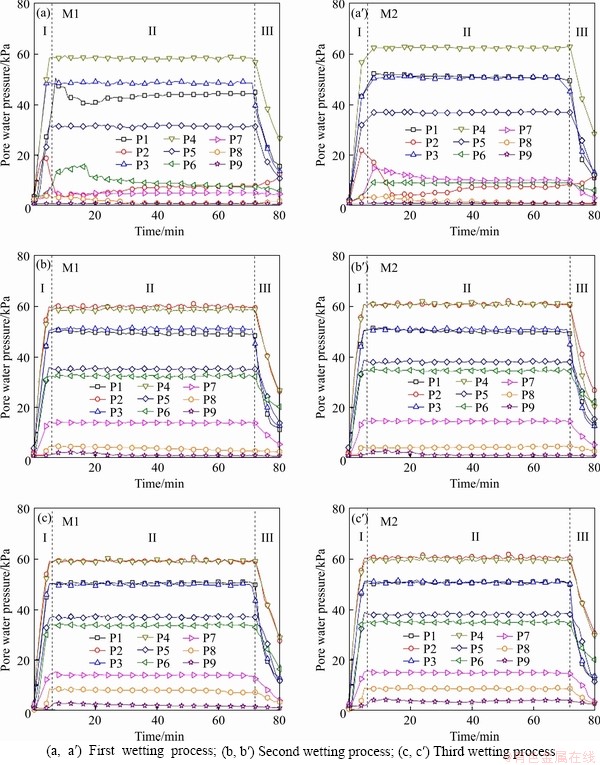
Figure 9 Curves of pore water pressure variation with time in wetting processes:
2.2.4 Analysis of damage characteristics
In the centrifugal model tests, both of the cyclic actions of WD and WDFT caused damage to the canal models, as shown in Figure 11. In M1, a large number of irregular cracks with different sizes appeared on the model surface after three WD cycles. At the slope and the top of the canal model, the surface cracks had a certain connectivity. In M2, the cracks grew on the model surface after three WDFT cycles. However, these cracks in M2 were concentrated at the canal top, which has a typical characteristic of high connectivity. According to the studies in Ref. [38], surface crack ratio is the ratio of the surface cracks area to the total surface area of a specimen. To quantify the cracking extent on the soil surface, surface crack ratio at the canal top was estimated on the basis of the processed images, which was 4.1% in M1 and was higher than that of M1 by 2.4 % in M2. It is indicated that compared with the canal model under WD cycles, the canal model under WDFT cycles presented more significant surface crack characteristics at the canal top, which was consistent with that reported in Refs. [5, 11].
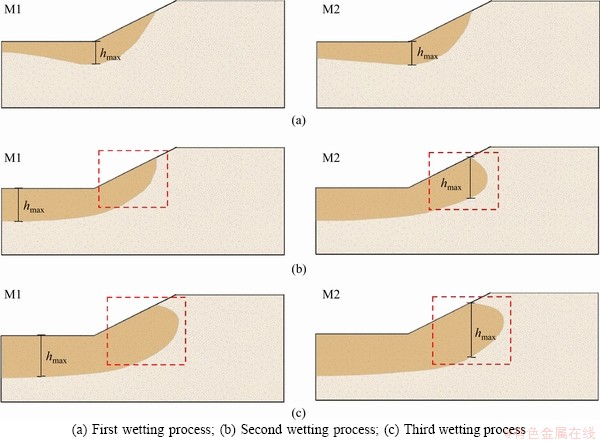
Figure 10 Curves of saturated areas in canal models:
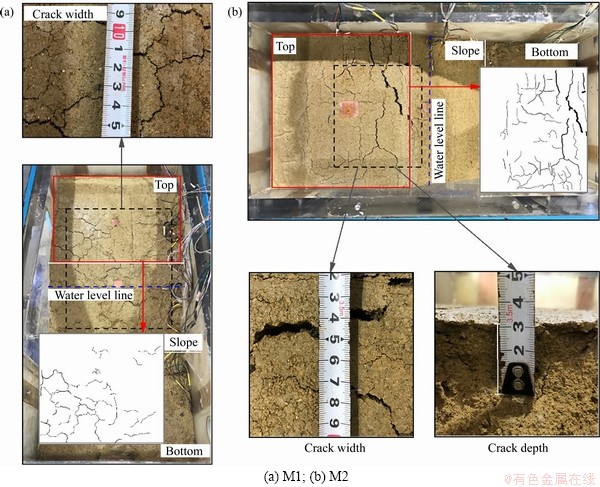
Figure 11 Damage characteristics of canal models:
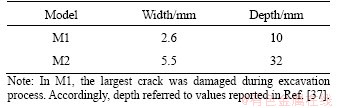
In addition, the largest surface cracks in M1 and M2 were selected for a measurement of width and depth, as shown in Table 3. Among them, the depth was measured after the excavation along the development direction of the crack. The widths and depths of the largest cracks in the canal model under the WDFT cycles were significantly higher than those in the canal model under the WD cycles by approximately 112% and 20%, respectively. This result indicated that the freezing-thawing processes in the WDFT cycles caused a further development of cracks at the canal top, which induced the cracks to develop from the shallow soil to the deep soil. Two reasons for this phenomenon were as follows: 1) the freezing-thawing processes in the WDFT cycles caused a larger WD range of the soils at the canal top due to a significant increase in the water infiltration [39], which resulted in a further attenuation of the mechanical properties in the deep soils; 2) The frozen stress would change the stress field in the canal model, which would make the microcracks in the shallow soils develop and deflect to the deep soil [32]. In the subsequent thawing process, the canal slope would deform toward the free surface, which also promoted crack development at the slope and the top. After three WDFT cycles, a transverse tensile crack across the top of the canal model appeared, resulting in the canal model in M2 having a tendency to instability from this crack [40].
Table 3 Measured widths and depths of largest cracks
3 Field test
3.1 Test scheme
To capture the water infiltration characteristics of the on-site canals in the WDFT processes, a field study on a typical canal in Xinjiang, China, was conducted. The operation time of this canal was similar to that shown in Figure 1, leading to rise-fall processes of the water level every year. The lowest temperature and highest temperature at the site were approximately -40 and 30 ��C, respectively. This result indicated that this canal experienced WDFT processes every year. The test site was selected at a typical section, where slope instability frequently occurred. As already noted, these canals were located in the arid region, leading to a deep groundwater table at the test site. The soil properties are listed in Table 1.
This canal had been repaired several times since it was put into service. The last maintenance of the canal slope at the test site ended in April 2015. Monitoring at the typical section occurred from November 2017 to November 2018 by measurements of the pore water pressure and temperature. Accordingly, the test site had experienced two WDFT cycles and WD cycles before the field test, as shown in Figure 12, where W,D, F and T denote the wetting process, drying process, freezing process and thawing process, respectively. In addition, both the pore water pressure and the temperature were measured by vibrating wire sensors (1#-10#), which have a diameter of 24 mm and a length of 138 mm. The measurement range and measurement accuracy of the pore water pressure are 0-700 kPa and �� 0.1 kPa, respectively, whereas those of the temperature are from -40 to 80 ��C and ��0.5 ��C, respectively. Due to maintenance, some sand and gravel were mixed in the shallow soil of the canal. Thus, these sensors were mainly installed at ten positions along the slope, which are all below a depth of 1.5 m. The installation photographs, sensor layouts and canal section sizes are shown in Figures 13 and 14, respectively. After installation, the data were collected automatically every day via a wireless transmission apparatus.
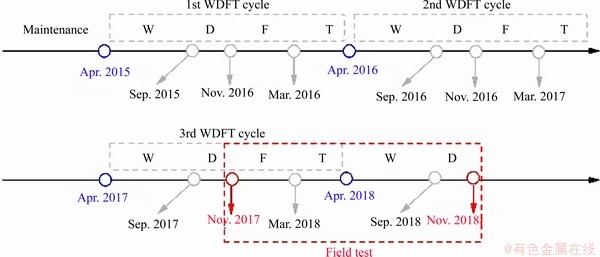
Figure 12 Simplified WDFT processes at test site
3.2 Response of monitoring sensors
Figure 15 shows the curves of temperature variation with time during monitoring. As shown in Figure 15, the surface temperature of the test site was below 0 ��C since November 10, 2017, which is consistent with the downward temperature readings of the sensors. After March 21, 2018, the surface temperature rose above 0 ��C, and the temperature readings of the sensors also increased. In the wetting process and drying process, the temperature readings showed a slightly upward trend. The soil temperature variations of the on-site canal in the WDFT processes were similar to those in M2, which indicated that the simulation of the temperature field in the centrifugal model test was reasonable.
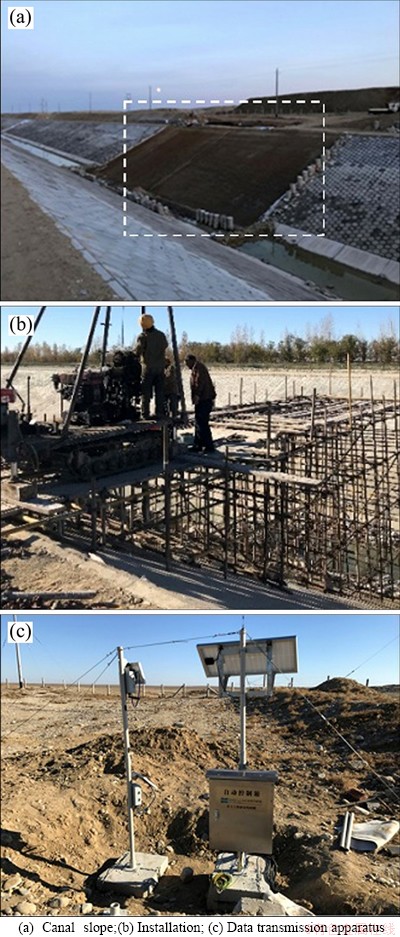
Figure 13 Installation photographs:
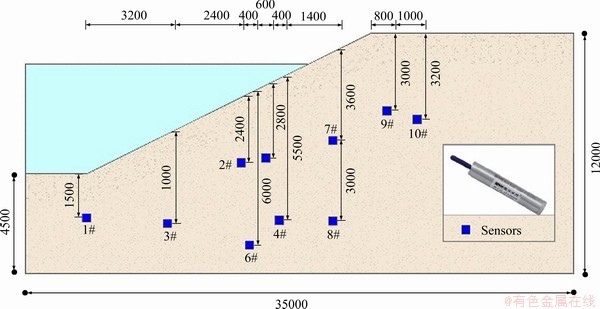
Figure 14 Layout of sensors (Unit: mm)
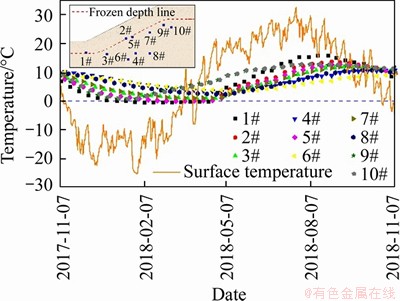
Figure 15 Curves of temperature variation with time during monitoring
In addition, it was noted that most readings of temperature sensors were still positive while the on-site canal was in a cold weather. The main reasons for this phenomenon were as follows: 1) as previous mentioned, the shallow soil below the canal structure was mixed with some coarse sand and gravel due to the maintenance. The buried depths of the sensors were mostly between 1.5 m and 4 m from the perspective of easy installation and ensuring that the sensors work normally, which were all over the average frozen depth (1.5 m) of canals in northern Xinjiang, China; 2) due to the relatively deep buried depth of these sensors, the soil temperature at the monitoring positions has a significant lag effect. In the meantime, the shallow soil below the canal structure has a high saturation, resulting in the fact that the variation rate of soil temperature at the monitoring points decreased due to the high specific-heat-capacity of water.
Figure 16 shows the curves of the variation in pore water pressure with time. During monitoring, the canal successively experienced a freezing process, thawing process, wetting process and drying process. From November 7, 2017, to April 25, 2018, the pore water pressure readings of the sensors exhibited a downward trend and had a slight variation range. It is noted that the temperature variation had little impact on the pore water pressure in the freezing process and thawing process. This is mainly because the depths of the installation positions were over the maximum frozen depth at the test site, resulting in the soil temperature around the sensors remaining positive during the freezing process. As the canal entered the operation period (wetting process), the pore water pressure readings of the sensors increased rapidly in the beginning, then remained constant with some fluctuation, and finally decreased, which corresponded well to the rise-fall process of the water level. All the sensors except 8#, 9# and 10# were close to the calculated hydrostatic pressure at the corresponding positions, indicating that the shallow soil of the typical canal was almost fully saturated, which is consistent with the conditions in the centrifugal model tests. After the water level decreased to 0 m on September 14, 2018, the soil went into the drying process. The pore water pressure readings of these sensors exhibited a significant downward trend due to pore water pressure dissipation.
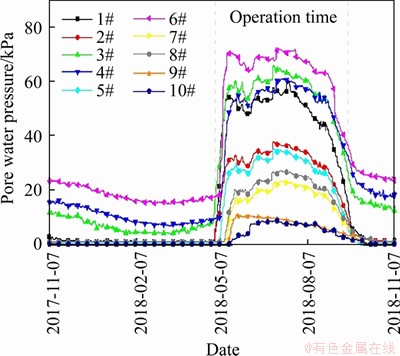
Figure 16 Curves of variation in pore water pressure with time during monitoring
Similarly, according to the monitored pore water pressure in the field test, schematic diagrams of the saturated areas below the canal are shown in Figure 17. For an intuitive comparison between the water infiltration in the centrifugal model tests and field tests, the saturated areas in M1 and M2 after the third wetting process were also determined after the conversion between the models and prototypes. As shown in Figure 17, the saturated areas in the centrifugal model tests and field tests were similar, which demonstrates the accuracy of the centrifugal results. Among them, the boundaries of the saturated area in M2 were almost coincident with those in the field test, and the saturated areas in both of them were significantly larger below the canal top than those in M1. This result indicated that the cyclic action of WDFT also promoted water infiltration below the canal top in the field test. Consequently, the canal at the test site presents significant characteristics of damage, as shown in Figure 18. Similar to M2, transverse cracks also run through the canal top, which presents the conditions for slope instability [42, 43].

Figure 17 Schematic diagram of saturated areas in field test (Unit: mm)
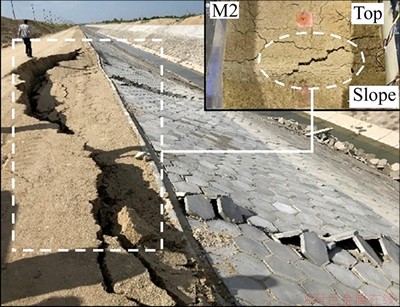
Figure 18 Canal instability characteristics in field test [41]
To understand the failure process better, the schematic diagram of canals under WDFT cycles is presented in Figure 19. 1) In the wetting process, the shallow soil was saturated due to the water infiltration, resulting in a saturated area below the canal structure, as shown in Figures 10 and 17; 2) In the drying process, there was no water in the canal. The excess pore water pressure appeared inside the shallow soil along the slope, which made the slope deform towards the free surface because of seepage force. As a result, the cracks appeared at the top and slope of the canal, as shown in Figures 11 and 18. It would lead to a more significant water infiltration phenomenon in the next wetting process (Figures 9 and 10), which was consistent with that observed in M1 and M2; 3) In the freezing process, the phase transition of water caused the frost heave deformation of shallow soil. In the meantime, the freezing process would also cause the stress concentration at the crack tip, leading to the further development and deflection of the cracks at the slope and top of canal [5, 32]; 4) In the thawing process, the soil thawed from the canal surface first, and the mechanical properties of the shallow soil decreased further after freezing-thawing process [44-47]. As previous mentioned, the water infiltration behavior caused great hidden dangers to the stable operation of the canals. Then, a whole disaster chain of canals under wetting-drying-freezing-thawing cycles formed, contributing to a lower stability of canal slopes.
4 Conclusions
1) The shallow soil of the canal models is fully saturated in the wetting process. Compared with the canal model under the WD cycles, the canal model under the WDFT cycles has larger saturated areas and a higher degree of saturation below the canal top after each cycle, indicating that the FT process in the WDFT cycles promoted the water infiltration behavior below the canal slope.
2) The cracks on the surface of the canal model under the cyclic action of WDFT develop further and have a higher connectivity, which presents the conditions for slope instability from the transverse tensile crack running through the canal top.
3) The water infiltration distribution below the canal and the canal damage characteristics in the field test are similar to those in the centrifugal model tests, which provides a preliminary basis for the maintenance and seepage treatment of canals in Xinjiang.
Contributors
ZHU Rui and CAI Zheng-yin provided the concept. ZHU Rui and HUANG Ying-hao conducted the literature review and wrote the first draft of the manuscript. ZHANG Chen, GUO Wan-li and ZHU Xun edited the draft of manuscript. All authors replied to reviewers�� comments and revised the final version.
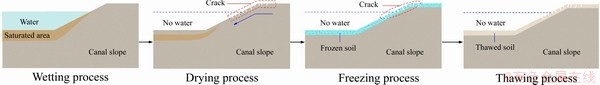
Figure 19 Schematic diagram of canals under WDFT cycles
Conflict of interest
ZHU Rui, CAI Zheng-yin, HUANG Ying-hao, ZHANG Chen, GUO Wan-li and ZHU Xun declare that they have no conflict of interest.
References
[1] CHEN Jia-qi, XIA Jun. Facing the challenge: Barriers to sustainable water resources development in China [J]. Hydrological Sciences Journal, 1999, 44(4): 507-516. DOI: https://doi.org/10.1080/0262 6669909492248.
[2] LU Zhao-hui, ZHAO Li-xin, DAI Jian. A study of water resource management in the Tarim Basin, Xinjiang [J]. International Journal of Environmental Studies, 2010, 67(2): 245-255. DOI: https://doi.org/ 10.1080/00207231003693274.
[3] ZHU Rui, HUANG Ying-hao, ZHANG Chen, GUO Wan-li, CHEN Hao. Laboratory and centrifugal model tests on failure mechanism of canal slopes under cyclic action of wetting-drying [J]. European Journal of Environmental and Civil Engineering, 2020. DOI: https://doi.org/10.1080/19648189. 2020. 1773321.
[4] CAI Zheng-yin, HUANG Ying-hao. Evaluation and treatment technology of frost damage in canals in saline and cold regions [M]. Beijing, China: Science Press, 2015. (in Chinese)
[5] CAI Zheng-yin, ZHU Xun, HUANG Ying-hao, ZHANG Chen. Evolution rules of fissures in expansive soils under cyclic action of coupling wet-dry and freeze-thaw [J]. Chinese Journal of Geotechnical Engineering, 2019, 41(8): 1381-1389. DOI: 10.11779/CJGE 201908001. (in Chinese)
[6] ZHU Xun, LI Guo-ying, CAI Zheng-yin, HUANG Ying-hao, ZHANG Chen, CHEN Hao. Failure modes and slope stability of expansive soil canal under wet-dry cycles [J]. Transactions of the Chinese Society of Agricultural Engineering, 2020, 36(4): 159-167. DOI: 10.11975/j.issn.1002-6819.2020.04. 019. (in Chinese)
[7] LI Shuang-yang, LAI Yuan-ming, PEI Wan-sheng, ZHANG Shu-juan, ZHONG Hua. Moisture-temperature changes and freeze-thaw hazards on a canal in seasonally frozen regions [J]. Natural Hazards, 2014, 72(2): 287-308. DOI: https://doi.org/10.1007/s11069-013-1021-3.
[8] LI Shuang-yang, LAI Yuan-ming, ZHANG Ming-yi, PEI Wan-sheng. Centrifuge and numerical modeling of the frost heave mechanism of a cold-region canal [J]. Acta Geotechnica, 2019, 14(4): 1113-1128. DOI: https://doi.org/10.1007/ s11440-018-0710-1.
[9] LIU Quan-hong, WANG Zheng-zhong, LI Zhan-chao, WANG Yi. Transversely isotropic frost heave modeling with heat-moisture-deformation coupling [J]. Acta Geotechnica, 2020, 15: 1273-1287. DOI: https://doi.org/10.1007/s11440- 019-00774-1.
[10] CAI Zheng-yin, ZHU Xun, HUANG Ying-hao, ZHANG Chen, GUO Wan-li. Research on mechanical properties and damage evolution law of expensive soils under cyclic action of coupling wetting-drying and freeze-thaw [J]. Chinese Journal of Rock Mechanics and Engineering, 2019, 38(6): 1233-1241. DOI: https://doi.org/10.13722/j.cnki.jrme.2018. 1470. (in Chinese)
[11] CAI Zheng-yin, ZHU Rui, HUANG Ying-hao, ZHANG Chen, GUO Wan-li, CHEN Hao. Influences of freeze-thaw process on the deterioration mode of expansive soil canal slope [J]. Journal of Hydraulic Engineering, 2020, 51(8): 915-923. DOI: 10.13243/j.cnki.slxb. 20200064. (in Chinese)
[12] XIAO Heng-lin, HUANG Jie. Experimental study of the applications of fiber optic distributed temperature sensors in detecting seepage in soils [J]. Geotechnical Testing Journal, 2013, 36(3): 360-368. DOI: https://doi.org/10.1520/ gtj20120096.
[13] GENEREUX D P, GUARDIARIO J. A canal drawdown experiment for determination of aquifer parameters [J]. Journal of Hydrologic Engineering, 1998, 3(4): 294-302. DOI: https://doi.org/10.1061/(ASCE)1084-0699(1998)3:4(294).
[14] GOYAL R, CHAWLA A S. Seepage from canals with infiltration from free surface zone [J]. Journal of Irrigation and Drainage Engineering, 1997, 123(4): 257-263. DOI: https://doi.org/10.1061/(ASCE)0733-9437(1997)123:4(257).
[15] RAM S, JAISWAL C S, CHAUHAN H S. Transient water table rise with canal seepage and recharge [J]. Journal of Hydrology, 1994, 163(3, 4): 197-202. DOI: https://doi.org/ 10.1016/0022-1694 (94)90139-2.
[16] SWAMEE P K, MISHRA G C, CHAHAR B R. Design of minimum seepage loss canal sections [J]. Journal of Irrigation and Drainage Engineering, 2000, 126(1): 28-32. DOI: https://doi.org/10.1061/(ASCE)0733-9437(2000)126: 1(28).
[17] ZHAN Liang-tong, NG C W W, FREDLUND D G. Field study of rainfall infiltration into a grassed unsaturated expansive soil slope [J]. Canadian Geotechnical Journal, 2007, 44(4): 392-408. DOI: https://doi.org/10.1139/T07-001.
[18] FU Qiang, LI Yue, LI Tian-xiao, CUI Song, LIU Dong. HYDRUS simulation and verification of canal leakage and its influencing factors analysis [J]. Transactions of the Chinese Society of Agricultural Engineering, 2017, 33(16): 112-118. DOI: 10.11975/j.issn.1002-6819.2017.16.015. (in Chinese)
[19] FU Qiang, HOU Ren-jie, LI Tian-xiao, LI Yue, LIU Dong, LI Mo. A new infiltration model for simulating soil water movement in canal irrigation under laboratory conditions [J]. Agricultural Water Management, 2019, 213: 433-444. DOI: https://doi.org/10.1016/j.agwat.2018.10.021.
[20] YAO Li-qiang, FENG Shao-yuan, MAO Xiao-min, HUO Zai-lin, KANG Shao-zhong, BARRY D A. Coupled effects of canal lining and multi-layered soil structure on canal seepage and soil water dynamics [J]. Journal of Hydrology, 2012, 430-431: 91-102. DOI: https://doi.org/10.1016/j.jhydrol. 2012. 02.004.
[21] SOLOMON F, EKOLU S. Effect of clay-concrete lining on canal seepage towards the drainage region-An analysis using Finite-Element method [C]// International Conference in Construction Materials and Structures. South Africa: University of Johannesburg, 2014: 1331-1341. DOI: https://doi.org/10.1126/science.1249766.
[22] ZHANG Jian, WEI Zhan-min, ZHANG Jin-ding, SU Ri-na. The channel leakage simulation and its influence factors analysis based on HYDRUS model [J]. Journal of Soil and Water Conservation, 2020, 34(1): 141-148. DOI: 10.13870/ j.cnki.stbcxb.2020.01.021. (in Chinese)
[23] FIPPS J G, SKAGGS R W. Effect of canal seepage on drainage to parallel drains [J]. Transactions of the American Society of Agricultural Engineers, 1986, 29(5): 1278-1283. DOI: https:// doi.org/10.13031/2013.30309.
[24] TAYLER R N. Geotechnical centrifuge techology [M]. Glasgow, UK: Blackie Academic and Professional, 1995.
[25] CHEN Xiang-sheng, PU Jia-liu, LUO Xiao-gang, WEI Kun-ting. Centrifuge modelling tests of soil freezing heave [J]. Journal of China Coal Society, 1999, 24(6): 615-619. DOI: CNKI:SUN:MTXB.0.1999-06-012. (in Chinese)
[26] HUANG Ying-hao, CAI Zheng-yin, ZHANG Chen, XU Guang-ming, HONG Jian-zhong, ZHAO Bao-zhong. Development of centrifugal model test facility for frost-heave of channels [J]. Chinese Journal of Geotechnical Engineering, 2015, 37(4): 615-621. DOI: 10.11779/CJGE2015 04006. (in Chinese)
[27] ZHANG Chen, CAI Zheng-yin, HUANG Ying-hao, XU Guang-ming, REN Guo-feng. Centrifuge modelling of frost-heave of canals [J]. Chinese Journal of Geotechnical Engineering, 2016, 38(1): 109-116. DOI: 10.11779/CJGE 201601011. (in Chinese)
[28] ASTM (D6913). Standard test methods for particle-size distribution (gradation) of soils using sieve analysis [S].
[29] ASTM (D4318). Standard test methods for liquid limit, plastic limit, and plasticity index of soils [S].
[30] ASTM (D698). Standard test methods for laboratory compaction characteristics of soil using standard effort [S].
[31] ASTM (D4829). Standard test method for expansion index of soils [S].
[32] ZHU Xun. Failure mechanism and stability analysis for expansive soil canal under cyclic action of coupling wetting-drying and freeze-thaw [D]. Nanjing, China: Nanjing Hydraulic Research Institute, 2019. (in Chinese)
[33] DL/T-5102: Chinese Energy Administration. Specification for geotechnical centrifuge model test techniques [S]. (in Chinese)
[34] BUTTERFIELD R. Dimensional analysis for geotechnical engineers [J]. Geotechnique, 1999, 49(3): 357-366. DOI: https://doi.org/ 10.1680/geot.1999.49.3.357.
[35] BUTTERFIELD R. Scale-modelling of fluid flow in geotechnical centrifuges [J]. Soils and Foundations, 2000, 40(6): 39-45. DOI: https:// doi.org/ 10.3208/sandf.40.6_39.
[36] ZHANG Chen, CAI Zheng-yin, XU Guang-ming, HUANG Ying-hao. Dimensional analysis of centrifugal modeling of frozen soil [J]. Rock and Soil Mechanics, 2018, 39(4): 1236-1244. DOI: 10.16285/j.rsm.2016.1099. (in Chinese)
[37] CHEN Hao. Study on stability of canal slope of expansive soil under drying-weting cycles [D]. Nanjing, China: Nanjing Hydraulic Research Institute, 2019. (in Chinese)
[38] TANG Chao-sheng, SHI Bin, LIU Chun, ZHAO Li-zheng, WANG Bao-jun. Influencing factors of geometrical structure of surface shrinkage cracks in clayey soils [J]. Engineering Geology, 2008, 101(3, 4): 204-217. DOI: https://doi.org/ 10.1016/j.enggeo.2008.05.005.
[39] MU Kun, KONG Lin-wei, ZHANG Xian-wei, YIN Song. Experimental investigation on engineering behaviors of red clay under effect of wetting-drying cycle [J]. Rock and Soil Mechanics, 2016, 37(8): 2247-2253. DOI: 10.16285/j.rsm. 2016. 08.016. (in Chinese)
[40] CHEN Tie-lin, ZHOU Cheng, WANG Guo-li, LIU En-long, DAI Fei. Centrifuge model test on unsaturated expansive soil slopes with cyclic wetting�Cdrying and inundation at the slope toe [J]. International Journal of Civil Engineering, 2018, 16(6): 1341-1360. DOI: https://doi.org/10.1007/s 40999-017-0228-1.
[41] CAI Zheng-yin, ZHU Rui, HUANG Ying-hao, ZHANG Chen, GUO Wan-li. Centrifugal model tests on deterioration process of canal under cyclicaction of coupling wetting-drying and freeze-thaw [J]. Chinese Journal of Geotechnical Engineering, 2020, 42(10): 1773-1782. DOI: 10.11779/CJGE202010001. (in Chinese)
[42] KONRAD J M, AYAD R. Desiccation of a sensitive clay: Field experimental observations [J]. Canadian Geotechnical Journal, 1997, 34(6): 929-942. DOI: https://doi.org/ 10.1139/t97-063.
[43] KHAN M S, HOSSAIN S, AHMED A, FAYSAL M. Investigation of a shallow slope failure on expansive clay in Texas [J]. Engineering Geology, 2017, 219: 118-129. DOI: https://doi.org/10.1016/ j.enggeo.2016.10.004.
[44] LU Yang, LIU Si-hong, ALONSO E, WANG Liu-jiang, XU Lei, LI Zhuo. Volume changes and mechanical degradation of a compacted expansive soil under freeze-thaw cycles [J]. Cold Regions Science and Technology, 2019, 157: 206-214. DOI: https://doi.org/10.1016/j.coldregions.2018.10.008.
[45] TANG Liang, CONG Sheng-yi, GENG Lin, LING Xian-chang, GAN Fa-da. The effect of freeze-thaw cycling on the mechanical properties of expansive soils [J]. Cold Regions Science and Technology, 2018, 145: 197-207. DOI: https://doi.org/10.1016/j. coldregions.2017.10.004.
[46] ZHOU Zhong, LIU Zhuang-zhuang, YANG Hao, GAO Wen-yuan, ZHANG Cheng-cheng. Freeze-thaw damage mechanism of elastic modulus of soil-rock mixtures at different confining pressures [J]. Journal of Central South University, 2020, 27(2): 554-565. DOI: https://doi.org/10. 1007/s11771-020-4316-z.
[47] ZHANG Hong-wei, WANG Xue-ying, ZHAO Xin, LIU Peng-fei. In-situ experiment investigations of hydrothermal process of highway in deep seasonal frozen soil regions of Inner Mongolia, China [J]. Journal of Central South University, 2020, 27(7): 2082-2093. DOI: https://doi.org/10.1007/ s11771-020-4432-9.
(Edited by FANG Jing-hua)
���ĵ���
ʪ�ɶ���ѭ������ˮ�������Ե�����ģ��������ֳ������о�
ժҪ����©��������ɱ�����ˮ��������ʧ�ȵ���Ҫԭ��֮һ������ͨ������ģ������̽����ʪ��ѭ����ʪ�ɶ���ѭ������ˮ���������ԡ�������֣�ģ������dz�������ʪ���������ȫ���͡������ʪ��ѭ���µ�ģ��������ÿ��ʪ�ɶ���ѭ����ģ��������������ı��ͳ̶ȸ��ߣ�����ʪ�ɶ���ѭ���еĶ��ڹ��̴ٽ���ģ���������������ˮ��������Ϊ��ͬʱ��ʪ�ɶ���ѭ����ģ�������ı�����϶�����Լ���ͨ�̶�Ҳ���ߣ��������������������������������϶����ʧ�ȵ����ơ��ڴ˻����ϣ�ͨ���ֳ�����������ˮ�����ֲ������֤������ģ�������ȷ�ԡ����о�Ϊ������ˮ����ά���Լ����������ṩ���ݡ�
�ؼ��ʣ�ʪ�ɶ��ڣ�ˮ����������϶������������ģ������
Foundation item: Project(2017YFC0405100) supported by the National Key Research and Development Program of China; Projects(51879166, 51709185, 51909170) supported by the National Natural Science Foundation of China; Project(SKLFSE201909) supported by the Open Research Fund Program of State Key Laboratory of Permafrost Engineering, China; Project(2018M640500) supported by Postdoctoral Science Foundation of China
Received date: 2020-07-09; Accepted date: 2020-10-28
Corresponding author: CAI Zheng-yin, PhD, Professor; Tel: +86-25-85829501; E-mail: zycai@nhri.cn; ORCID: https://orcid.org/0000-0001-5446-2356

