Reconstructing bubble profiles from gas-liquid two-phase flow data using agglomerative hierarchical clustering method
��Դ�ڿ������ϴ�ѧѧ��(Ӣ�İ�)2019���8��
�������ߣ������� �鶫�� ��С�� �߶���
����ҳ�룺2056 - 2067
Key words��bubble profile reconstruction; gas-liquid two-phase flow; clustering method; surface-resolved computational fluid dynamics (CFD); distorted bubble shape
Abstract: The knowledge of bubble profiles in gas-liquid two-phase flows is crucial for analyzing the kinetic processes such as heat and mass transfer, and this knowledge is contained in field data obtained by surface-resolved computational fluid dynamics (CFD) simulations. To obtain this information, an efficient bubble profile reconstruction method based on an improved agglomerative hierarchical clustering (AHC) algorithm is proposed in this paper. The reconstruction method is featured by the implementations of a binary space division preprocessing, which aims to reduce the computational complexity, an adaptive linkage criterion, which guarantees the applicability of the AHC algorithm when dealing with datasets involving either non-uniform or distorted grids, and a stepwise execution strategy, which enables the separation of attached bubbles. To illustrate and verify this method, it was applied to dealing with 3 datasets, 2 of them with pre-specified spherical bubbles and the other obtained by a surface-resolved CFD simulation. Application results indicate that the proposed method is effective even when the data include some non-uniform and distortion.
Cite this article as: WU Dong-ling, SONG Yan-po, PENG Xiao-qi, GAO Dong-bo. Reconstructing bubble profiles from gas-liquid two-phase flow data using agglomerative hierarchical clustering method [J]. Journal of Central South University, 2019, 26(8): 2056-2067. DOI:https://doi.org/10.1007/s11771-019-4153-0.

ARTICLE
J. Cent. South Univ. (2019) 26: 2056-2067
DOI: https://doi.org/10.1007/s11771-019-4153-0

WU Dong-ling(�鶫��)1, SONG Yan-po(������)1, PENG Xiao-qi(��С��)1, 2, GAO Dong-bo(�߶���)1
1. School of Energy Science and Engineering, Central South University, Changsha 410083, China;
2. Department of Information Science and Engineering, Hunan First Normal University,Changsha 410205, China
 Central South University Press and Springer-Verlag GmbH Germany, part of Springer Nature 2019
Abstract: The knowledge of bubble profiles in gas-liquid two-phase flows is crucial for analyzing the kinetic processes such as heat and mass transfer, and this knowledge is contained in field data obtained by surface-resolved computational fluid dynamics (CFD) simulations. To obtain this information, an efficient bubble profile reconstruction method based on an improved agglomerative hierarchical clustering (AHC) algorithm is proposed in this paper. The reconstruction method is featured by the implementations of a binary space division preprocessing, which aims to reduce the computational complexity, an adaptive linkage criterion, which guarantees the applicability of the AHC algorithm when dealing with datasets involving either non-uniform or distorted grids, and a stepwise execution strategy, which enables the separation of attached bubbles. To illustrate and verify this method, it was applied to dealing with 3 datasets, 2 of them with pre-specified spherical bubbles and the other obtained by a surface-resolved CFD simulation. Application results indicate that the proposed method is effective even when the data include some non-uniform and distortion.
Key words: bubble profile reconstruction; gas-liquid two-phase flow; clustering method; surface-resolved computational fluid dynamics (CFD); distorted bubble shape
Cite this article as: WU Dong-ling, SONG Yan-po, PENG Xiao-qi, GAO Dong-bo. Reconstructing bubble profiles from gas-liquid two-phase flow data using agglomerative hierarchical clustering method [J]. Journal of Central South University, 2019, 26(8): 2056-2067. DOI:https://doi.org/10.1007/s11771-019-4153-0.
1 Introduction
The dispersion of gas bubbles in liquid has become a problem of crucial importance in fluid mechanics. The significance of this problem arises also in numerous technical and industrial processes, as for example in chemical engineering, metallurgical engineering, and biotechnology [1]. In most of these processes, the knowledge of the temporal-spatial distribution of the gas bubbles is crucial as the interphase mass, momentum, and energy transfers take place on the bubble surface. The performance of these interphase transfers is mainly related to the extent of the interfacial area, which depends in turn on bubble size distribution and gas hold-up.
Experimental investigation [2, 3] provides a straight forward way to obtain the dispersion properties. Measurement techniques are partly intrusive using various probe techniques well- known from other applications like electrical and optical needle probes for gas fraction and bubble size [4-6]. Another well-known technique in the last century is the sampling method which allows to determine gas phase observables [7].
Non-intrusive techniques like PIV and PDA can also readily be used to measure bubble velocity [8]. Photographic methods to determine bubble size and shape as well as gas hold-up by image processing have been adapted by lighting with light sources either directly [9, 10] or by inducing fluorescence [11]. All of these non-intrusive methods are based on optical techniques hence useless in the case of dense suspension due to the opacity of the system. More advanced methods like tomography [12, 13] are just about beginning to be applied to this field.
An alternative way is to conduct the surface-resolved CFD simulations [14], based on which, the resolved shapes and motions of the interfaces between gas and liquid are tackled through one of the following three approaches: tracking points, tracking scalar functions, or the immersed boundary method. Such CFD simulations are more challenging than those surface-unresolved approaches, e.g. the point-particle based Eulerian- Lagrangian approach [15] and the Eulerian-Eulerian approach based on interpenetrating continua [16], due to the necessity of accounting for the shape deformation of the dispersed phase in the former. Thanks to the recent advances in both super- computer technologies and numerical methods, it has become feasible to perform the surface-resolved simulations at the laboratory-scale. The availability of results from such simulations advances the development of new and improved closure relations and models of the average or large-scale flows [17-19].
While the past few years have witnessed much progress in dispersion property investigation in the fields of both experiment and surface-resolved simulation, less attention has been paid to provide qualitatively the three-dimensional (3D) bubble profiles as well as the bubble size distribution extracted therein based on the raw data obtained. In most cases, such information has shown only quantitative via animations [20, 21]. One of the exceptions is the 3D tomography experiment of BIEBERLE et al [22], where a 3D level-set reconstruction algorithm was proposed to identify bubble profiles. This work has stimulated subsequent experimental studies [23, 24] to develop a variety of techniques to reconstruct the 3D bubble profiles from the field data. Indeed, these approaches allow the investigation of dynamically changing phase distributions. However, such solutions are still comparatively complex and cost- intensive.
The objective of this paper is to provide an efficient method to extract bubble profiles from a given field data comprising the spatial distribution of the gas holdup. Such field data are accessible generally from either tomography-like experiments or surface-resolved CFD simulations. We select the CFD data obtained by the Volume-of-Fluid (VOF) method as a data sample. The bubble profile reconstruction method proposed here is based on an improved agglomerative hierarchical clustering (AHC) algorithm [25]. To our knowledge, the current work presents the first application of the AHC algorithm in the area of gas-liquid two-phase flows.
The rest of this paper is structured as follows. In the next section we describe the problem and explain briefly the main difficulty to reconstruct bubble profiles by clustering methods. The improved AHC algorithm as well as its implementation details will be introduced in Section 3. Section 4 discusses firstly two preliminary tests, in which the datasets are generated by pre-specifying the distribution of the gas holdup, to access the reliability and accuracy of the proposed bubble profile reconstruction method. Results of a formal test, in which the dataset is obtained by a surface-resolved CFD simulation with the VOF method, will then be discussed. Conclusions and remaining gaps in the proposed method are given in Section 5.
2 Problem description
A raw dataset, S, comprising the spatial distribution of the gas hold-up, takes the form:
 (1)
(1)
where (xi, yi, zi) denotes the central position of the ith data element; Ci denotes the local gas holdup with 0��Ci��1; N is the total number of the elements inside the computational domain.
Figure 1 illustrates a sample of the dataset obtained by the VOF method in two dimensions. The gas phase is described by the node-clusters with 0��Ci��1, which can be separated into two categories: one with Ci=1 indicating that only the gas phase is included there, and the other with 0

Figure 1 2D illustration of gas holdup distribution of a dataset obtained by CFD simulation with VOF method:
Generally speaking, the task to reconstruct bubble profile becomes now to identify all the bubble clusters inside the computational domain. It is, in principle, feasible to fulfill this task by using a certain clustering algorithm. Before addressing the algorithm in detail, several difficulties regarding its implementation have to be announced:
1) The total number of bubbles is not known a priori, and the shape and scale of the bubbles can differ significantly from region to region;
2) As a common feature of the CFD data, the grids can be non-uniform and distorted. Therefore, a common linkage criterion taking into account the spatial distance between pair of clusters only is no longer generally applicable;
3) Some of the pair bubble clusters, like A and B shown in Figure 1, stay too close with each other thus can hardly be split apart by any pre-existing clustering algorithm;
4) The large size of the dataset, which is common for data obtained from both experiments and surface-resolved simulations, increases the computational complexity.
The well-known clustering algorithms offer no solution to the combination of these difficulties. We hereby proposed an improved AHC algorithm. A detailed description as well as the assessment of this algorithm will be given in the following sections.
3 Clustering algorithm: design and implementation
This section describes the clustering method employed. The AHC algorithm with a focus is on the proposal of an adaptive linkage criterion. The stepwise execution strategy, clustering of the gas-only clusters and the mixture clusters are conducted successively. The neighboring clusters obtained therein are then merged to obtain the bubble clusters. Such a procedure enables the separation of attached bubbles. Finally, to decrease the computational complexity, usually a pre-separation of the dataset is necessary.
3.1 AHC algorithm with adaptive linkage criterion
In data mining and statistics, AHC is a ��bottom-up�� approach, which seeks to build a hierarchy of clusters. Within this approach, an input parameter specifying the number of the resulting clusters is not required. Instead, each element starts in its own cluster, and pair of clusters are merged, providing that the dissimilarity specifying the distance between pair of clusters satisfies a given linkage criterion. Definition of the dissimilarity is achieved by use of an appropriate metric, which measures the distance between pair of elements.
The choice of metric will influence the shape of the clusters. The metric used here measures the dimensionless Euclidean distance between the two elements, pi and pj:
 (2)
(2)
where ��(pi) denotes the characteristic length of the element pi and its value is either  (for a 3D element) or
 (for a 2D element); vi (or si) is the volume (resp. surface area) of the element pi. The dissimilarity, i.e. the distance between two clusters Pm and Pn, is given by
 (3)
(3)
Figure 2 illustrates the magnitude of the metric defined by Eq. (2) based on a 2D dataset with non-uniform grid. According to the values indicated in Figure 2, it is straightforward to conclude that the sufficiency and necessity for the statement ��two elements pi��and pj are connected with each other�� is
 and
and  (4)
(4)
respectively. As for a 3D dataset, the sufficiency and necessity for the statement above becomes
and  (5)
(5)
respectively. Moreover, the necessity for the statement ��two elements pi and pj are separated by other element pk�� reads
 (6)
(6)
This necessity statement is valid for both 2D and 3D datasets. For datasets with uniform grids, ��k=(��i+��j)/2, thus the necessity of Eq. (6) becomes d(pi, pj)��2. Based on the findings above we speculate that, for a dataset with uniform grids, the linkage criterion, based on which two clusters Pm and Pn are merged, takes the form:
 (7)
(7)

Figure 2 2D illustration of metric defined by Eq. (1)
However, such a linkage criterion becomes questionable when the grids become non-uniform. As indicated in Figure 2, the elements p1 and p7 are separated by p6 while the metric still satisfies the linkage criterion Eq. (7). To overcome this, we hereby propose the modified linkage criterion:
 (8)
(8)
where
 and
and 

In Eq. (8), �� is a tunable parameter describing the truncation intensity on the clustering tree. ��=0 results in ��full-truncation��, based on which no merge operation would occur during clustering. On the other hand,  results in ��no-truncation��. For datasets with uniform grids, ��=1 always applies. Even for datasets comprising distorted grid that the maximum (normalized equiangular) skewness and edge ratio [24] of the grids are smaller than 0.53 and
 respectively, ��=1 is still applicable in theory. Even though, we suggest the use of ��=0.95 so as to enhance the truncation.
Note that the AHC algorithm proposed here uses an adaptive linkage criterion defined by Eq. (8) to truncate the clustering tree, thus it can deal with datasets comprising non-uniform and distorted grids.
3.2 Stepwise clustering strategy
The AHC algorithm proposed in Section 3.1, enabling reasonable clustering of datasets with non-uniform and distorted grids, is still incapable to separate the attached bubbles directly. We therefore propose a stepwise clustering strategy. An overview of it is given below:
Step 1: Conduct clustering on the elements with gas holdup C=1 by the AHC algorithm indicated to obtain all the gas-only clusters Pgas;
Step 2: Conduct clustering on the elements with gas holdup 0
Step 3: Merge the neighboring clusters (i.e. the pair of neighboring gas-only and mixture clusters) to obtain all the bubble clusters Pbub.
Note that after Step 3 those unmerged ones of both the gas-only and mixture clusters will be treated as bubble clusters as well.
The linkage criterion of the two ��clustering�� operations mentioned in Step 1 and Step 2 are identical with Eq. (8) while that of the ��merge�� operation in Step 3 differs with Eq. (8). Indeed, in Step 3 we first evaluate the dissimilarities between a given mixture cluster  and all the gas-only clusters, and then merge with
 provides that their dissimilarity satisfies both
 (9)
(9)
and Eq. (8). Note that there could be situations where is not unique. For instance, as illustrated in Figure 1, both the gas-only clusters A and B would be merged with the mixture cluster surrounding them. In this case we figure out first all the gas-only clusters satisfying both Eq. (9) and Eq. (8) and then assign all the elements inside the to its nearest neighboring cluster in
 Lastly, element with the non-unique nearest neighboring clusters would be assigned to its nearest neighboring clusters in a random way. Thus, by using this stepwise clustering strategy, bubbles staying too close with each other can be split apart accurately.
3.3 Preprocessing and algorithm implementation
The AHC algorithm has a time complexity of O(n3) and requires O(n2) memory; where n denotes the number of elementary operations, here  For a typical CFD data n has a magnitude of O(106), which makes the algorithm too slow to be implemented. We therefore try to divide the dataset into several sub-datasets with partial overlap according to space division so as to reduce the computational complexity.
Figure 3 gives a demonstration on a binary space division operation. The computational domain Z(or the overall zone) of a given dataset S takes the form:
 (10)
(10)
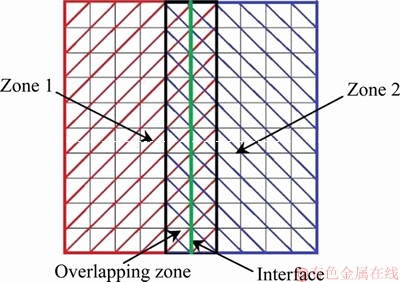
Figure 3 Schematic of a binary space division
The interface that divides the computational domain into two sub-zones is given by f(xi, yi, zi)=0. The resulting sub-zones Z1 and Z2 as well as the overlapping zone Zove can be signed as
 (11a)
(11a)
 (11b)
(11b)

 (11c)
(11c)
The thickness of the overlap �� is suggested to be 2-4 times that of the maximum characteristic length of the grids crossed by the interface.
Correspondingly, the resulting sub-datasets can therefore be obtained by
 (12a)
(12a)
 (12b)
(12b)
 (12c)
(12c)
The overall implementation procedures comprising the additional efforts tackling the space division and sub-zones reconnection become now:
Step 1: Divide the computational domain by the mentioned above to obtain S1, S2 and Sove;
Step 2: Cluster the elements inside S1 and S2, successively, by the stepwise clustering strategy introduced to obtain the bubble clusters P1,bub and P2,bub respectively;
Step 3: Merge those pairs of bubble clusters that were split apart by the interface so as to obtain the overall bubble clusters 
By space division, the time complexity and required-memory of the AHC algorithm become O(m(n/m)3) and O(m(n/m)2) respectively(where m denotes the total number of resulting sub-zones). Obviously, this division will make that the AHC algorithm can deal with big dataset only if m isn��t too large.
For practical purpose, it is sometimes necessary to provide additionally the bubble size distribution based on the bubble clusters obtained. The evaluation of the (volume) equivalent spherical diameter of an irregularly shaped bubble identified by the bubble cluster
  is straight forward:
 (13)
(13)
4 Results and discussion
4.1 Test 1: pre-specified 2D dataset
4.1.1 Data details
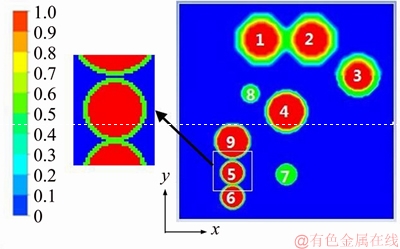
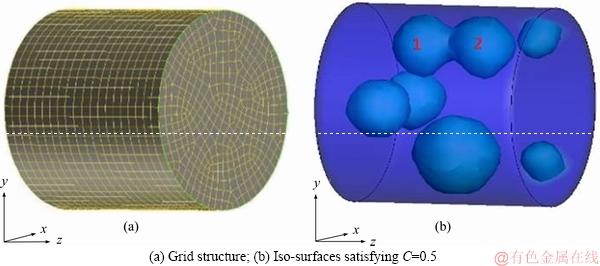
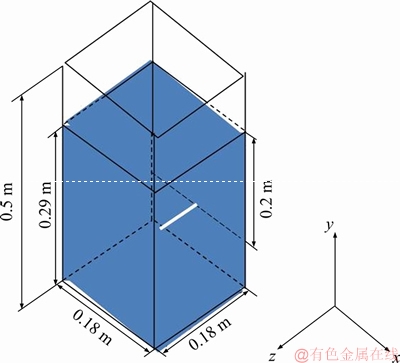
A 2D dataset is considered first to get an idea of the performance that can be expected. The computational domain is square with a side length of 1.2. The grid structure is illustrated in Figure 4. All the grids are square. The side lengths of the grids are respectively 0.005, 0.01, and 0.02 within the region of -0.6 Figure 4 Grid structure of 2D dataset Figure 5 Gas holdup distribution in 2D dataset 4.1.2 Clustering results The interface for space division is defined as x=0. The resulting thickness of the overlap is set as ��=0.04. Figure 6(a) illustrates the shape and location of the resulting sub-zones due to space division. The whole computational domain is separated into two sub-zones (i.e. zone 1 and zone 2) of the same size with partial overlap along the x direction. The overlap among the two zones comprises elements of both single bubble and attached bubbles, which helps to check the performance of the ��merge�� operation described in Step 3. The gas-only clusters, mixture clusters, and bubble clusters inside the two zones are then obtained using the stepwise clustering strategy described. These are illustrated in Figures 6(b), (c) and (d), respectively. The good agreement between the results obtained in zone 1 and zone 2 and the pre-specified gas volume fraction distribution inside the two zones indicated in Figure 6(a) confirms the validity of the clustering algorithm when dealing with datasets with non-uniform grids. The overall bubble clusters are then obtained by merging those pairs of bubble clusters resulting from space division according to the operation Step 3 in section 3.3. The resulting bubble clusters are shown in Figure 6(e). Both the attached bubbles that crossed by the interface, i.e. bubbles 1 and 2, and those attached ones in zone 1, i.e. bubbles 6, 5, and 9 are split part perfectly, which confirms the ability of the clustering algorithm when dealing with datasets involving attached bubbles. 4.2 Test 2: pre-specified 3D dataset 4.2.1 Data details The 3D computational domain considered here is a cylinder with a radius and a height of 0.5 and 1, respectively. The grids discretizing the domain are oblique hexahedrons as shown in Figure 7(a). The overall number of grids involved is 7600. The maximum (normalized equiangular) skewness of the grids is 0.41 and more than half of the grids have a skewness of more than 0.2. Such a dataset helps to check the performance of the clustering algorithm when dealing with datasets with skewed grids. A pre-specified gas holdup distribution is patched into the computational domain via the Patch tool in ANSYS Fluent [26]. Figure 7(b) illustrates the spherical bubble profiles represented by the iso-surfaces satisfying C=0.5 as well as their relative location. Note that the pair of bubbles 1 and 2 are specified to be attached. Figure 6 Schematic of intermediate results obtained during clustering concerning a 2D dataset: Figure 7 Data details of 3D dataset: 4.2.2 Clustering results The interface for space division is defined as z=0. The resulting thickness of the overlap according to Eq. (12) is ��=0.1. As illustrated in Figure 8(a), the whole computational domain is separated into two sub-zones of the same size, i.e. Figure 8 Schematic of intermediate results obtained during clustering concerning a 3D dataset:(note that Figures (b)-(d) comprise a narrow overlap at x=0); (e) Final bubble clusters obtained after merging bubble clusters in overlap. The different- colored dots in Figures (b)-(e) denote different clusters zone 1 and zone 2, with partial overlap along the z direction. Figures 8(b), (c) and (d) illustrate, respectively, the gas-only clusters, mixture clusters, and bubble clusters inside the two zones obtained using the stepwise clustering strategy. Figure 8(e) shows the overall bubble clusters obtained by merging those pairs of bubble clusters resulting from space division according to the operation. The good agreement between the results and the pre-specified gas volume fraction distribution indicated in Figure 7(b) confirms additionally the reliability of the clustering algorithm when dealing with datasets with skewed grids. Figure 8 Schematic of intermediate results obtained during clustering concerning a 3D dataset: 4.3 Test 3: surface-resolved CFD data 4.3.1 Data details In this section, we will assess the performance of the clustering algorithm when dealing with dataset obtained from surface-resolved CFD data, within which, the gas holdup distribution is not pre- specified but obtained from CFD simulations. In this case, bubble profile reconstruction becomes more challenging since the bubble shapes can be highly distorted. The computational domain is a cuboid as illustrated in Figure 9. The bottom has a size of 0.18 m��0.18 m and the overall height is 0.5 m. The liquid phase is pure water which fills the cuboid at a height of 0.29 m. The gas phase is nitrogen which is supplied through a 0.06 m-long tube installed with a bottom clearance of 0.09 m. The mass flow rate of the gas is 1.45��10-4 kg/s. The diameter of the tube is 0.004 m, which requires rather fine grids for discretization. The total number of grids is around 106 and the maximum grid skewness is 0.39. The CFD simulation is performed using ANSYS Fluent release 12.0. The relatively large computational domain makes it infeasible to resolve fully the turbulence involved. Instead, the RNG k-�� model [27] is applied. The resolved shapes and motions of the interfaces between the two phases are computed via the VOF method [28]. Specifically, the volume fraction equation is solved through explicit time discretization. The face flux is interpolated using the geometric reconstruction scheme. The simulation is unsteady with a time step of 5��10-5 s. For more details about the VOF method implemented here we refer to ANSYS Fluent 12.0 [26]. Figure 9 Schematic representation of side blowing tank To confirm the reliability of the CFD models employed, an experiment of the side blowing process described above is conducted as well. The tank geometry and gas supply condition are identical with that in the simulation. The bubble profile is measured by a photographic method. A comparison of the bubble profile around the nozzle between the results obtained by CFD prediction and by experimental investigation is illustrated in Figure 10. The good agreement qualitatively confirms the reliability of the models employed. The simulation could probably be improved by employing refined girds or by using more advanced method to resolve the surface. However, our purpose is mainly to generate CFD data, which has certain physical significance. Thus we will not try to perform further model improvement or validation here. 4.3.2 Clustering results The surface-resolved CFD data at t=1.3 s are then analyzed by the clustering algorithm. A comparison between the iso-surfaces satisfying C=0.5 and the bubble profiles identified by the clustering algorithm is given in Figure 11. The qualitative agreement among them confirms the ability of the clustering algorithm when dealing with datasets involving bubbles with highly distorted shape. Figure 10 Comparison of bubble profile around nozzle between results obtained by iso-surface satisfying C=0.5 of CFD simulation at t=1.3 s (a) and by experiment (b) The bubble (volume) equivalent spherical diameters of each bubble clusters are obtained as well according to Eq. (13), of which the dimensionless number 5 Conclusions This work proposed an efficient clustering method to reconstruct bubble profiles in gas-liquid two-phase flow based on an improved agglomerative hierarchical clustering (AHC) algorithm. This AHC algorithm involves an adaptive linkage criterion which ensures the reasonable clustering when dealing with datasets involving either non-unified or distorted grids. The clustering algorithm is executed in a stepwise manner aiming to separate attached bubbles into their individual clusters. To reduce the computational complexity, a preprocessing to divide the dataset into several sub-datasets with partial overlap according to binary space division was proposed. Figure 11 Comparison of bubble profiles inside tank obtained by iso-surfaces satisfying C=0.5(a) and by clustering method (with different bubble clusters represented by different-colored dots) based on surface-resolved CFD simulation results at t=1.3 s (b) Figure 12 Dimensionless bubble number against bubble (volume) equivalent spherical diameter To get an idea of the performance to be expected, datasets of both 2D and 3D with pre-specified spherical bubble profiles were considered first. The fairly good agreement between the reconstructed and pre-specified bubble profiles confirms the reliability and the accuracy of the clustering method when dealing with spherical bubble profiles. On the basis of this finding, assessment of the clustering method proceeded with a dataset involving highly distorted bubble profiles. This dataset was obtained by conducting a surface-resolved CFD simulation based on the VOF method. The qualitative agreement between the bubble profiles revealed from the iso-surfaces that represent points of a constant gas holdup of 0.5 and that are obtained by the clustering method confirms the ability of the clustering method when dealing with dataset involving highly distorted bubble profiles. Concerning further algorithm development, speed improvement of the algorithm so as to allow the investigation of dynamically changing bubble profiles is clearly needed. The use of hierarchical grid-based algorithm like in the works of MURTAGH et al [29], allows a hierarchical clustering to be constructed in linear time appearing most promising in this direction. The adaptive linkage criterion proposal is still in a preliminary stage. More precisely, it is reliable for grids with a normalized equiangular skewness smaller than 0.53. For CFD data with higher grid skewness, special algorithm is needed to measure the distance between two grids and the linkage criterion should be adjusted as well. Use of the minimum intersection-depth developed by DOBKIN et al [30] could provide a reliable measure of the grid distance but result in turn in higher computational complexity. Overall, the algorithm speed and its reliability are coupled inherently and, therefore, in principle, have to be considered a whole for any further algorithm development. References [1] LIU Gang, LI Meng-si, ZHOU Bing-jie, CHEN Ying-ying, LIAO Sheng-ming. General indicator for techno-economic assessment of renewable energy resources [J]. Energy Conversion and Management, 2018. 156: 416-426. DOI: 10.1016/j.enconman.2017.11.054. [2] BOYER C, DUQUENNE A, WILD G. Measuring techniques in gas�Cliquid and gas�Cliquid�Csolid reactors [J]. Chemical Engineering Science, 2002, 57: 3185-3215. DOI: 10.1016/ S0009-2509(02)00193-8. [3] BESAGNI G, INZOLI F, ZIEGENHEIN T. Two-phase bubble columns: A comprehensive review [J]. Chem Engineering, 2018, 2(2): 13-88. DOI: 10.3390/ chemengineering2020013. [4] MIZUSHIMA Y, SAKAMOTO A, SAITO T. Measurement technique of bubble velocity and diameter in a bubble column via single-tip optical-fiber probing with judgment of the pierced position and angle [J]. Chemical Engineering Science, 2013, 100: 98-104. DOI: 10.1016/j.ces.2013.01. 046. [5] ALWIS L, SUN T, GRATTAN K. Developments in optical fibre sensors for industrial applications [J]. Optics & Laser Technology, 2016, 78: 62-66. DOI: 10.1016/j.optlastec. 2015.09.004. [6] WOROSZ T, BERNARD M, KONG R, TOPTAN A, KIM S, HOXIE C. Sensitivity studies on the multi-sensor conductivity probe measurement technique for two-phase flows [J]. Nuclear Engineering and Design, 2016, 310: 552-563. DOI: 10.1016/j.nucengdes.2016.10.046. [7] BARIGOOU M, GREAVES M. Bubble-size distributions in a mechanically agitated gas-liquid contactor [J]. Chemical Engineering Science, 1992, 47: 2009-2025. DOI: 10.1016/ 0009-2509(92)80318-7. [8] LAAKKONEN M. Development and validation of mass transfer models for the design of agitated gas-liquid reactors [D]. Otaniemi: Helsinki University of Technology, 2006. [9] LIU L, YAN H. ZHAO G. Experimental studies on the shape and motion of air bubbles in viscous liquids [J]. Experimental Thermal and Fluid Science, 2015, 62: 109�C121. DOI: 10.1016/j.expthermflusci.2014.11.018. [10] MA J, ZHOU P, CHENG W, SONG Y, SHI P. Dimensional analysis and experimental study of gas penetration depth model for submerged side-blown equipment [J]. Experimental Thermal and Fluid Science, 2016, 75: 220-227. DOI: 10.1016/j.expthermflusci.2016.01.017. [11] BUSCIGLIO A, GRISAFI F, SCARGIALI F, BRUCATO A. On the measurement of local gas hold-up, interfacial area and bubble size distribution in gas�Cliquid contactors via light sheet and image analysis: Imaging technique and experimental results [J]. Chemical Engineering Science, 2013, 102: 551-566. DOI: 10.1016/j.ces.2013.08.029. [12] GOMEZ-HERNANDEZ J, van OMMEN J R, WAGNER E, MUDDE R F. A fast reconstruction algorithm for time- resolved X-ray tomography in bubbling fluidized beds [J]. Powder Technology, 2016, 290: 33-44. DOI: 10.1016/ j.powtec.2015.08.038. [13] SINGH B K, QUIYOOM A, BUWA V V. Dynamics of gas�Cliquid flow in a cylindrical bubble column: Comparison of electrical resistance tomography and voidage probe measurements [J]. Chemical Engineering Science, 2017, 158: 124-139. DOI: 10.1016/j.ces.2016.10.006. [14] ELGHOBASHI S. Direct numerical simulation of turbulent flows laden with droplets or bubbles [J]. Annual Review of Fluid Mechanics, 2019, 51: 217-244. DOI: 10.1146/ annurev-fluid-010518-040401. [15] SUBRAMANIAM S. Lagrangian-Eulerian methods for multiphase flows [J]. Progress in Energy and Combustion Science, 2013, 39: 215-245. DOI: 10.1016/j.pecs.2012. 10.003. [16] DREW D A. Mathematical modeling of two-phase flow [J]. Annual Review of Fluid Mechanics, 1983, 15: 261-291. DOI: 10.1146/annurev.fl.15.010183.001401. [17] Ma T, SANTARELLI C, ZIEGENHEIN T, LUCAS D, FROHLICH J. Direct numerical simulation�Cbased Reynolds- averaged closure for bubble-induced turbulence [J]. Physical Review Fluids, 2017, 2: 034301. DOI: 10.1103/ PhysRevFluids.2.034301. [18] SHI P, RZEHAK R. Bubbly flow in stirred tanks: Euler-Euler/RANS modeling [J]. Chemical Engineering Science, 2018, 190: 419-435. DOI: 10.1016/j.ces.2018. 06.001. [19] LU Y, HUANG J, ZHENG P. A CFD�CDEM study of bubble dynamics in fluidized bed using flood fill method [J]. Chemical Engineering Journal, 2015, 274: 123-131. DOI: 10.1016/j.cej.2015.03.117. [20] AKHTAR A, PAREEK V, TADE M. CFD simulations for continuous flow of bubbles through gas-liquid columns: Application of VOF method [J]. Chemical Product and Process Modeling, 2007, 2(1): 9. DOI: 10.2202/1934-2659.1011. [21] COLOMBET D, LEGENDRE D, RISSO F, COCKX A, GUIRAUD P. Dynamics and mass transfer of rising bubbles in a homogenous swarm at large gas volume fraction [J]. Journal of Fluid Mechanics, 2015, 763: 254-285. DOI: 10.1017/jfm.2014.672. [22] BIEBERLE M, BARTHEL F, MENZ H J, MAYER H G, HAMPEL U. Ultrafast three-dimensional X-ray computed tomography [J]. Applied Physics Letters, 2011, 98: 034101. DOI: 10.1063/1.3534806. [23] BODEN S, HAGHNEGAHDAR M, HAMPEL U. Measurement of Taylor bubble shape in square channel by microfocus X-ray computed tomography for investigation of mass transfer [J]. Flow Measurement and Instrumentation, 2017, 53: 49-55. DOI: 10.1016/j.flowmeasinst.2016.06.004. [24] DOS SANTOS E N, de PAIVA R L, PIPA D R, MORALES R E M, da SILVA M J. Three-dimensional bubble shape estimation in two-phase gas-liquid slug flow [J]. IEEE Sensors Journal, 2018, 18: 1122-1130. DOI: 10.1109/ JSEN.2017.2777892. [25] MURTAGH F, CONTRERAS P. Algorithms for hierarchical clustering: an overview [J]. Wiley Interdisciplinary Reviews: Data Mining and Knowledge Discovery, 2012, 2: 86-97. DOI: 10.1002/widm.53. [26] ANSYS Inc. ANSYS Fluent 12.0 [M]. USA: Lebanon, 2009. [27] ORAZAG S A, STAROSELSKY I, FLANNERY W S, ZHANG Y. Introduction to renormalization group modeling of turbulence [M]// Simulation and Modelling of Turbulent Flows, New York: Oxford University Press, 1996: 155-183. [28] SCARDOVELLI R, ZALESKI S. Direct numerical simulation of free-surface and interfacial flow [J]. Annual Review of Fluid Mechanics, 1999, 31: 567-603. DOI: 10.1146/annurev.fluid.31.1.567. [29] MURTAGH F, DOWNS G. CONTRERAS P. Hierarchical clustering of massive, high dimensional data sets by exploiting ultrametric embedding [J]. SIAM Journal on Scientific Computing, 2008, 30: 707�C730. DOI: 10.1137/ 060676532. [30] DOBKIN D, HERSHBERGER J, KIRKPATRICK D. SURI S. Computing the intersection-depth of polyhedral [J]. Algorithmica, 1993, 9: 518-533. DOI: 10.1007/bf01190153. (Edited by YANG Hua) ���ĵ��� ������Һ�������������۲�ξ����������̬�ع� ժҪ��������̬����Һ�������еĴ��ȡ����ʵȶ���ѧ���̵�Ӱ���ش��ڼ���������ѧ(CFD)������ģ�����а����д�����Ϣ��Ϊ����ȡ����Ϣ�����һ�ָĽ������۲�ξ����㷨�����ݴ˹�����������̬�ع��������÷�������������Ҫ������1)������ֵ����Ӧ��������������ɢ�߶Ȳ���һ�����������ݣ�2)�ռ����ָ�������㷨�ļ��㸴�Ӷȣ�3)�����Ԫ������Ԫ�ֲ������ִ�в��ԣ�����ȷʶ����ع�ʶ���ڵ�����/����Ⱥ����������Ԥ��������������ݺ�һ�����CFD��������ģ�����ݣ�չʾ�������������ʵ�ֹ��̲�����ع��ܽ����˲��ԡ����Խ������������ķ�������ʵ�֣���Ҫ��Ϊ���õIJ����٣���ʹ����ɢ����߶Ȳ���һ����������Ԫ��һ��Ť���������£��Կɸ�Ч��ʶ����Һ���ع��������е�����ľۼ���̬(����/����Ⱥ)�� �ؼ��ʣ�������̬�ع�����Һ�������������������ֱ����������ѧ�����ݱ��� Foundation item: Projects(51634010, 51676211) supported by the National Natural Science Foundation of China; Project(2017SK2253) supported by the Key Research and Development Program of Hunan Province, China Received date: 2019-05-21; Accepted date: 2019-07-06 Corresponding author: SONG Yan-po, PhD, Associate Professor; Tel: +86-13873117679; E-mail: songyanpo@csu.edu.cn; ORCID: 0000-0003-0246-8566


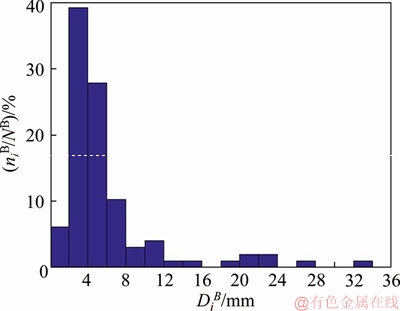
 distribution is illustrated in Figure 12, where
  denotes the number of bubbles identified in the
  -th number group, i.e. the bubble number identified within the diameter gap of (i-1, i+1], and NBdenotes the total number of bubbles identified, here NB=97. The maximum and minimum bubble diameters are 32.23 mm and 1.5 mm, respectively.