Numerical investigation of particle deposition on converging slot-hole film-cooled wall
来源期刊:中南大学学报(英文版)2017年第12期
论文作者:张靖周 周君辉
文章页码:2819 - 2828
Key words:gas–solid flow; particle deposition; film-cooled wall; converging slot film cooling hole; numerical simulation
Abstract: Numerical research on the dilute particles movement and deposition characteristics in the vicinity of converging slot-hole(console) was carried out, and the effect of hole shape on the particle deposition characteristics was investigated. The EI-Batsh deposition model was used to predict the particle deposition characteristics. The results show that the console hole has an obvious advantage in reducing particle deposition in comparison with cylindrical hole, especially under higher blowing ratio. The coolant jet from console holes can cover the wall well. Furthermore, the rotation direction of vortices near console hole is contrary to that near cylindrical hole. For console holes, particle deposition mainly takes place in the upstream area of the holes.
Cite this article as: ZHOU Jun-hui, ZHANG Jing-zhou. Numerical investigation of particle deposition on converging slot-hole film-cooled wall [J]. Journal of Central South University, 2017, 24(12): 2819–2828. DOI: https://doi.org/ 10.1007/s11771-017-3697-0.
J. Cent. South Univ. (2017) 24: 2819-2828
DOI: https://doi.org/10.1007/s11771-017-3697-0

ZHOU Jun-hui(周君辉)1, 2, ZHANG Jing-zhou(张靖周)1, 2
1. College of Energy and Power Engineering, Nanjing University of Aeronautics and Astronautics,Nanjing 210016, China;
2. Jiangsu Province Key Laboratory of Aerospace Power System, Nanjing 210016, China
 Central South University Press and Springer-Verlag GmbH Germany,part of Springer Nature 2017
Abstract: Numerical research on the dilute particles movement and deposition characteristics in the vicinity of converging slot-hole(console) was carried out, and the effect of hole shape on the particle deposition characteristics was investigated. The EI-Batsh deposition model was used to predict the particle deposition characteristics. The results show that the console hole has an obvious advantage in reducing particle deposition in comparison with cylindrical hole, especially under higher blowing ratio. The coolant jet from console holes can cover the wall well. Furthermore, the rotation direction of vortices near console hole is contrary to that near cylindrical hole. For console holes, particle deposition mainly takes place in the upstream area of the holes.
Key words: gas–solid flow; particle deposition; film-cooled wall; converging slot film cooling hole; numerical simulation
1 Introduction
Aircraft engines used for propulsion are often operated under the particulate environment, where particles are ingested into the engine [1–4]. When the sand deposits on the turbine blade surface, it could roughen the blade surface, thus affecting the convective heat transfer rate between the hot gas and the turbine blades. When the sand is present in the cooling air, dust particles could deposit in the cooling passages, thus plug cooling passage and reduce the blade surface cooling effectiveness.
Many numerical and experimental investigations on the erosion and deposition effects of particle ingestion into gas turbines had been reported in Refs. [5–9]. A review of the earlier research on erosion and deposition in turbomachinery was presented by HAMED et al [10]. On the erosion issue, researchers have carried out more in-depth studies on the mechanism of sand erosion. The mass removed from a wall by an impact of a solid particle is determined mainly by two components, that is, deformation wear is due to the velocity normal to the surface and cutting wear is due to the tangential velocity [11]. Compared to sand erosion, the deposition behavior is more complex mainly due to more complicated interaction of small particle and wall. In general, two-step process is involved in the particle–wall interaction, namely, a sticking process and a detachment process. The mechanical interaction or the “sticking process” is associated with the determination of whether the particle sticks to or rebounds from the surface when it comes into contact with a wall. Once the particle sticks to the surface, the next process is to determine whether the particle remains on or detaches from the surface. This step is called the “detachment process” or the fluid dynamic interaction. EI-BATSH [12] developed a reasonable particle deposition model containing sticking process and detach process. Recently, several investigations were performed on the particle deposition in turbomachinery [13–19].
Film cooling is commonly used as external cooling scheme to prevent hot-section components from the hot gases. Over the past thirty years, a considerable number of investigations have been performed in order to understand the fundamental physics in the film cooling and assess the knowledge in the design of new film cooling systems. It is well known that a significant enhancement of the film-cooling effectiveness could be achieved using the shaped film holes [20]. As an alternate geometry of shaped holes, SARGISON et al [21] demonstrated a so-called console film cooling geometry (Converging Slot-Hole). The console is designed to offer the advantages of slot flow, while maintaining a structural strength similar to discrete holes. In this geometry, the hole transits from a near circular shape at the inlet to a slot at the exit with convergence in the axial direction and divergence laterally. Nowadays, this kind of shaped hole has attracted many concerns [22–24].
It was demonstrated that console film cooling geometry is more like a slot film cooling. It is also attractive that good film layer could prevent the particles from impinging the wall, thus reducing particle deposition on the surface. The aim of the present paper is to investigate the particle deposition characteristic in the vicinity of console hole numerically based on the deposition model presented by EI-BATSH [12]. The advantage of console hole on suppressing particle deposition is revealed.
2 Mathematical model
2.1 Gas phase simulation
The flow considered in the present investigation is three-dimensional and compressible. Therefore, the flow field of the gas phase is assumed to be governed by the compressible Reynolds-averaged Navier-Stokes equations. It can be expressed by
 (1)
(1)
 (2)
(2)
 (3)
(3)
where ρf is the gas density; uf is the gas velocity; p is the gas pressure; μe is the fluid effective viscosity, and can be modeled as
 (4)
(4)
where μf is the gas viscosity; μt is the eddy viscosity. The standard k–w equation was used to determine μt in the present study.
The energy conservation equation for gas phase can be expressed by:
 (5)
(5)
where Tf is the temperature of gas phase. The effective thermal conductivity of gas phase, keff, is given as follows:
 (6)
(6)
where kf, cp,f and Prt is the gas thermal conductivity, specific heat capacity and turbulent Prandtl number respectively. Here, Prt=0.5.
2.2 Particle phase simulation
Lagrangian method was used for predicting the trajectory of the dispersed phase. In the present, the particle size region is from 0.2 to 3 mm; the forces considered are the Stokes drag force, rarefaction effect, thermophoresis force and Saffman lift force. The Stokes drag force is the most dominant force on the particle motion, exerting on the particle due to the relative velocity between the fluid and the particle. When the particles are in the submicron region, rarefaction effects are important as there is a reduction in the drag coefficient. The thermophoretic force is caused by the unequal momentum exchange between the particle and the fluid and this force is also important for submicron particle. While the other forces, since the particle concentration is sufficiently low, such as body force, collision force, etc., are neglected.
 (7)
(7)
where  is drag force;
  is Saffman lift force; mp is particle mass; up is the particle velocity;
  is thermophoretic force.
 (8)
(8)
where u is the fluid velocity; Acp is cross-section area of a spherical particle,
 (9)
(9)
where kr is velocity gratitude; r and m are the fluid density and dynamic viscosity, respectively.
 (10)
(10)
where CD is particle drag coefficient with Cunningham correction factor for rarefaction effect; CD,Stokes is particle drag coefficient; Cu is Cunningham correction factor.
 (11)
(11)
where Rep is the particle Reynolds number.
 (12)
(12)
 (13)
(13)
where Dp is the diameter of a particle; Kn is Knudsen number.
 (14)
(14)
where λ is mean free path of the gas molecules.
 (15)
(15)
where kp is particle thermal conductivity;  is temperature gradient; Cs is 1.17; Ct is 2.18; Cm is 1.14.
Phase changes of the particle are not taken into account. The equation of particle temperature is defined as
 (16)
(16)
where Tp is particle temperature; Tf is fluid temperature; Ap is particle surface area; cpp is the specific heat of particle; hc is the convective heat transfer coefficient between the particle and the surrounding fluid, which is determined by the relationship:
 (17)
(17)
where λf is the fluid conductivity; Pr is the Prandtl number of fluid.
2.3 Eddy interaction model
In general, particles reach to a wall surface either through direct inertial impact or boundary layer diffusion. Small particles usually reach the surface mainly by the latter way.
To simulate the effect of the turbulence on the particle trajectories, an Eddy interaction model (EIM) developed by GOSMAN and IOANNIDES [25] is adopted. In the current version of FLUENT, the fluid velocity fluctuations used for particle tracking are assumed isotropic and the value of ui'(t) which prevails during the eddy lifetime is randomly drawn from a Gaussian distribution.
 (18)
(18)
where ζ is a normally distributed random number. In the RANS modeling of turbulence, k is the turbulent kinetic energy. The value of the random number is applied for the characteristic life time of the eddy, defined as
 (19)
(19)
where te is eddy lifetime; le is eddy dissipation length scale.
 (20)
(20)
where e is the turbulent kinetic energy dissipation rate and cm is a constant.
The particle is assumed to interact with the fluid phase eddy over this eddy lifetime. When the eddy lifetime is reached, a new value of the instantaneous velocity is obtained by applying a new value of z. The values of ui and ui' are updated whenever migration into a neighboring cell occurs.
2.4 Particle deposition model
In the present simulation, the particle deposition model presented by EI-BATSH [12] was used to investigate the particle deposition characteristics.
In the sticking process, a semi-empirical model which uses the particle capture velocity was developed by BRACH and DUNN [26] to simulate the sticking process. If the capture velocity is bigger than the particle normal impact velocity, the particle sticks, the deposition mass of wall grid accumulate; otherwise, continues to calculate the particle trajectory. Particle capture velocity, Vcr, is given by:
 (21)
(21)
 (22)
(22)
 (23)
(23)
 (24)
(24)
where E is the elastic modulus; Ep and Es are the elastic modulus of the particle and the surface material, respectively; np and ns are the Poisson ratio of the particles and the surface material, respectively; rp is the particle density.
When the particle sticks on the surface, the next process is to determine whether the particle remains on or detaches from the surface. In the particle detachment model, the critical wall shear velocity uτc is defined by SOLTANI and AHMADI [27]. The particle will be removed from the wall if the wall friction velocity  where tw is the wall shear stress) of turbulent flow is larger than critical wall shear velocity. The critical wall shear velocity is:
 (25)
(25)
where WA is sticking constant number, depending on the nature of the particles material and the surface material; Kc is the composite elastic modulus.
 (26)
(26)
3 Physical model and computational method
3.1 Physical geometry
The physical model is taken from Ref. [7] by AI FLETCHER. A schematic of the computational domain is shown in Fig. 1 Three inclined film cooling holes with a 30° is located 24d downstream of the flat plate leading edge and 30d upstream of the fluid outlet. The hole diameter (d) is 1 mm and hole spacing is 3d. The thickness of the plate is 2 mm. A high temperature circular gas jet with a diameter of 17d impinges on the flat plate with a 45°. The coolant fluid is injected from a tube with a diameter of 9d to a plenum located beneath the plate. The origin of the coordinates is located at the center of the central film cooling hole.
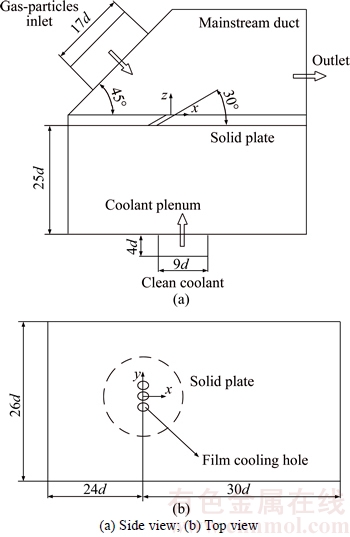
Fig. 1 Schematic of physical model [18]:
The scheme of converging slot-hole is shown in Fig. 2. The inlet is of a near circular shape, and the diameter is 1 mm. The outlet geometry is rectangular, and rectangular exit width is 0.3 mm and the length l is 2.8 mm.
3.2 Boundary conditions and parameters
The boundary conditions of computational domain are specified as follows.
1) The mainstream passage. The mainstream inlet is defined as velocity-inlet with 173 m/s. The temperature of the primary flow at the inlet is 1453 K. The turbulent kinetic energy (k) and specific dissipation rate (w) profiles are specified corresponding to a turbulence intensity of 4.7%. And flow outlet condition is set as pressure-outlet with the static pressure Pout=101325 Pa.
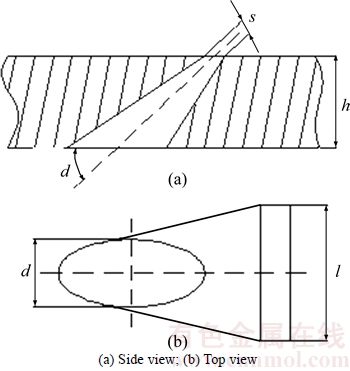
Fig. 2 Schematic of console model:
2) Coolant plenum. The coolant jet is injected from a tube to the coolant plenum by adopting velocity-inlet. The total temperature of secondary flow is set as 300 K, and the inlet velocity is determined according to the blowing ratio.
 (27)
(27)
where rc and uc are density and velocity of the coolant flow at the inlet of film hole, respectively;ρ∞ and u∞ are density and velocity of the mainstream at the entrance, respectively. It is noted that the cross-sectional area of console decreases or the coolant stream flow accelerates from the inlet to the outlet. Therefore, the coolant parameters are defined at the inlet of film hole to ensure that the consoles have the same coolant mass flow rate as that of cylindrical holes under the same blowing ratio.
3) Walls. The solid plate thermal conductivity is 9 W/(m·K). The top and the bottom of the solid are set as couple condition to account for heat transfer between solid and fluid and other wall is adiabatic condition.
10000 particles with mass flow rate of 0.0005 kg/s are released on the particle inlet surface. The temperatures and velocities of the particles are initially set to the same values as the hot gas. The average size of particles in the simulation is 2 mm and the particle size bins complied with a Rosin–Rammler logarithm distribution with the smallest particle size of 0.2 mm and the largest particle size of 5 mm. The particle properties are set as density (rp) of 990 kg/m3, specific heat capacity of 984 J/(kg×K) and thermal conductivity coefficient (lp) of 0.5 W(m×K). Sticking constant number WA is assumed as 0.039 J/m2 [27]. The composite elastic modulus is computed by setting the Poisson ratio to a constant value of 0.27 for both the particle and the surface. The elastic modulus of the surface material is assumed equal to the particle elastic modulus. The dependence of elastic modulus on the temperature is [17]
 (28)
(28)
3.3 Computational method
Figure 3 shows the cut-section view of the volume mesh, and Fig. 4 shows the surface mesh on the plate. The grid generation is realized by using Gambit software. The mainstream duct is divided as near-wall region and far-away-wall region. In the near-wall region, a layer of locally structured grids near the solid surface is generated using a hexahedral mesh. The other region in the mainstream zone is modeled with a tetrahedral mesh. The film-holes and coolant plenum are modeled using a tetrahedral mesh. These two meshes are merged together to form a “hybrid” mesh, with a non-conformal interface boundary between them. The meshes are non-uniform with fine grids in the regions where the complicated flow occurs, especially near the viscous walls. Viscous clustering is employed at all solid walls with a wall neighboring-cell y+ value approximately 1 at all locations. And the mesh is stretched away from the viscous wall using a stretching ratio less than 1.2. The final grid adopted for calculations is obtained after a series of grid sensitivity tests.

Fig. 3 Cut-section view of volume mesh
Figure 5 shows the grid sensitivity test result. Approximately 2.2×10⁶ computational nodes are involved in the whole computational domain.
Numerical computations are conducted by using FLUENT. User-defined subroutines are linked with FLUENT to present the deposition model. The computational steps are the follows.
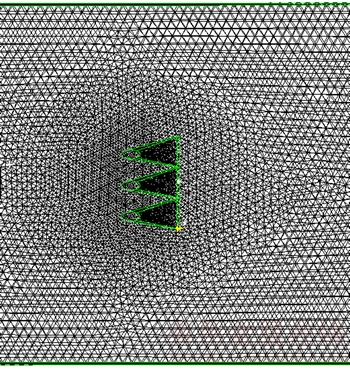
Fig. 4 Surface mesh on plate
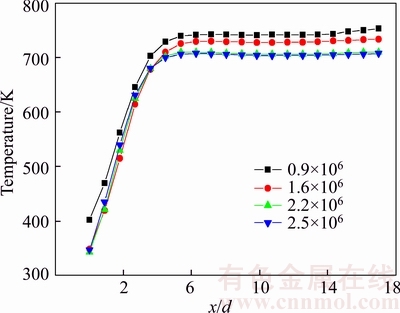
Fig. 5 Effect of grid number on wall temperature
Firstly, the single-phase flow field is calculated by using the SST k-w turbulence model.
Secondly, use the Lagrangian method to the particle trajectories method and use stochastic random-walk model to investigate the effect of turbulence on the particle.
Thirdly, use formula (21) to judge whether the particle is captured by the wall. If the particle is not captured, the particle trajectory is continued to track.
The next is to determine whether the particle sticks on the wall surface according to formula (25) for the captured particles. If it is stuck on the wall, the particle is accounted for the accumulation. Otherwise, the particle moves away from the wall surface, and the particle trajectory is continued to track.
Each particle in the deposition simulation is tracked as it is carried through the computational domain by a combination of mean velocities and turbulent velocities calculated from k and w.
3.4 Computational method validation
Figure 6 shows the particle deposition efficiency in the selected sampling region (circular zone with diameter of 25.4 mm) as seen in Fig. 1(b). The deposition efficiency is defined as the mass of particle deposited on the surface to the total mass of particles entering the domain. In this figure, the experimental data are taken from Ref. [18]. By comparing the present calculation results with the experiments results, it is seen that the particle predicted deposition efficiency varying the blowing ratio is consistent with the experimental results. As the blowing ratio increases, the deposition efficiency in the selected sampling region decreases. For lower blowing ratio, the predicted values are somewhat less than the experimental data. While for the higher blowing ratio, the predicted values are somewhat bigger than the experimental data. The maximum error is 1.3% and the error may be due to the assumption for the experimental condition. For example in the present calculation, we use Rosin–Rammler logarithm distribution to describe the particle size distribution, and in fact, the particle size distribution which the experimental employ is more complicate, and the particle size distribution are hard to describe. In generally, the present calculation results are in reasonable agreement with the experimental results.
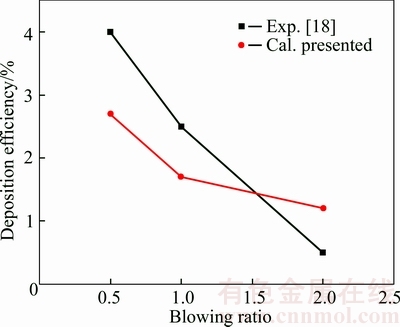
Fig. 6 Comparison between present calculation and experimental data taken from AI et al [18]
4 Results and discussion
4.1 Particle motion
Figure 7 shows the effect of film hole shape on the local volumetric concentration of particles in x–z section (y/d=0). It is seen that the existence of the coolant jet has great influence on the concentration distribution of particles. For cylindrical hole, the coolant jet covers the downstream surface well, as seen in Fig. 7(a). The coolant jet issuing from cylindrical film hole appears to lift off at the downstream edge under the blowing ratio of 2, as seen in Fig. 7(b). In this situation, the hot mainstream air is forced to enter beneath the coolant jet, thus producing higher local volumetric concentration of particles near the wall. The coolant jet issuing from console holes can better cover the wall, preventing particles from impacting the wall, as seen in Fig. 7(c). Due to in the lateral direction the console hole jet expand, so the ability of coolant jet penetrating to the mainstream is reduced, and the ability of coolant jet extending to the hole downstream is enhanced. Simultaneously, a more like slot film is also contributed to suppressing the ingress of particulate mainstream into the beneath of the coolant jet, so that the local volumetric concentration of particles in the near-wall zone is very low.
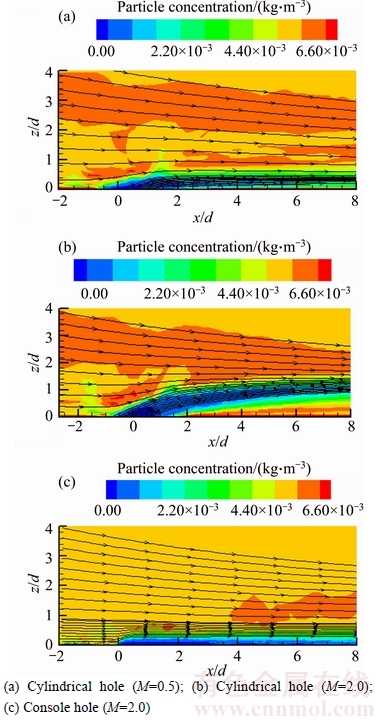
Fig. 7 Particle concentration distribution in x–z section:
Figure 8 shows the effect of film hole shape on the local volumetric concentration of particles in y–z section. For the cylindrical holes, the interaction between coolant jet from inclined cylindrical holes and the mainstream flow results in the formation of kidney vortices (Fig. 8(b)). These vortices are not only detrimental to film cooling, but also induce particulate mainstream air forced to enter beneath the coolant jet. But for the console cooling geometry, the interaction between coolant jet and the mainstream flow results in reasonable vortices configuration (Fig. 8(c)). The coolant jet expands in the lateral direction and flows out of the hole from the converging slot sides, not from the centerline of film holes as seen in the cylindrical hole case. The change of coolant jet flow direction in the hole passage causes the difference of vortices configuration, and the console hole vortice is more flatter, better extends in the lateral direction, and the film outflow flows upward to prevent the particle from entering the area between two holes; So, the area between the two holes has not high particle concentration; the console hole configuration is beneficial to improve the deposition characteristic of the near film cooled wall.

Fig. 8 Particle concentration distribution in y–z section:
Figure 9 shows the particle impacting angel. Particle impacting angle is defined as angle of particle motion trajectory to the impacting surface. As can be seen from the figure, for the cylindrical hole, its impacting angle increases as the blowing ratio increases, indicating that there is suction function in the upstream area of the hole due to the interaction between film jet and mainstream. The suction function of the film cooling hole changes the particle trajectory and increase the particle impacting angle and at the same blowing ratio, the particle impacting angle of cylindrical hole is larger than the console hole, because the console hole film jet height is lower than the cylindrical hole film jet; the suction function is smaller than the cylindrical hole. So, the particle is easier to be changed trajectory in the console hole upstream area.
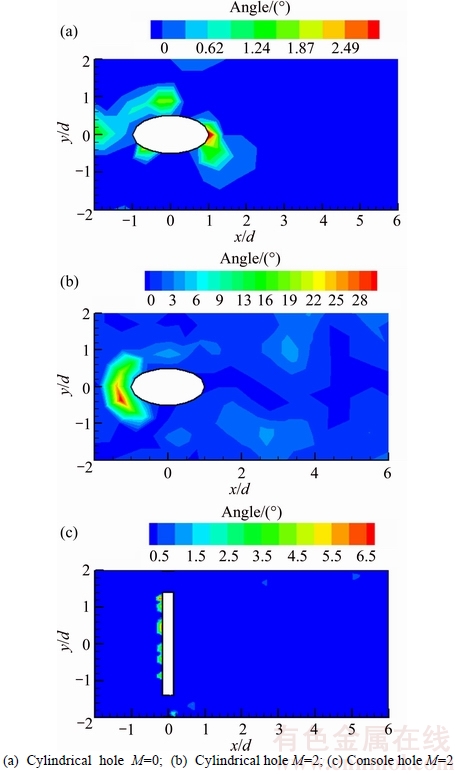
Fig. 9 Particle impacting angle distribution on 2.54 cm (1 inch) diameter coupon:
4.2 Particle deposition
Figure 10 shows the effect of particle size and blowing ratio on the particle deposition efficiency and the deposition efficiency is defined as the mass of particle deposit on the surface to the mass of the particles enter the calculation domain. It reveals that for the particle size below 1 mm, as the blowing ratio increases, film hole suction function is strengthened, and the deposition efficiency increase. but the particles with size above 1 mm have the opposite trend, as blowing ratio increases, the deposition efficiency decrease because as blowing ratio increases, the temperature on the surface fall rapidly results in deposition near the film hole decreasing.
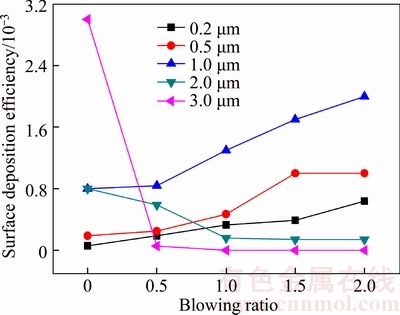
Fig. 10 Effects of particle size and blowing ratio on deposition efficiency of cylindrical hole
Figure 11 shows the effect of particle size and blowing ratio on deposition efficiency of console hole. From Fig. 11 we can see that the deposition efficiency increases as the blowing ratio increases, but compared with cylindrical hole, the effect of blowing ratio is smaller and the deposition efficiency is smaller than the cylindrical hole.

Fig. 11 Effects of particle size and blowing ratio on deposition efficiency of console hole
Figure 12 shows the particle deposition efficiency contour on the local wall zone in the vicinity of film cooling holes under blowing ratio of M=2. The deposition efficiency is defined as ratio of the particles mass deposit on the surface to the total mass of the particles entering the domain. For the cylindrical holes, as seen in Fig. 12(a), the more sticking zones appeared at front zone upstream of film hole, interval zone between adjacent jets, and downstream zone of film hole. As the smaller size particle with little momentum is prone to being influenced by the gas flow, these smaller particles will be easier to be suctioned into the vortices structure near the film cooling holes. While in the central zone beneath the film hole, due to larger wall shear velocity, the particle could be removed from the wall.
From Fig. 12(b), it is seen that the more sticking zone in the vicinity of console hole appeared at front zone upstream of film hole. As the console film hole is more like a slot, more continuous coolant layer could be produced in the lateral direction. Besides, vortices rotation direction from console hole is opposite to that from cylindrical hole, preventing the particle from impacting the wall. Therefore, the console hole shows its advantage of suppressing particle deposition on the film-cooled wall.
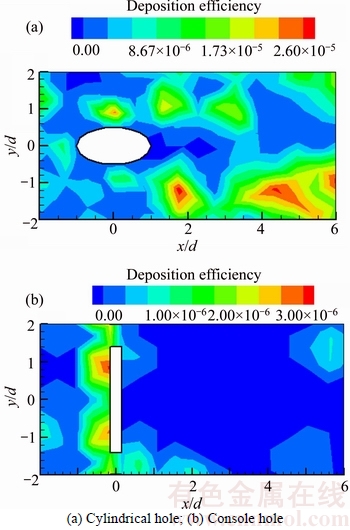
Fig. 12 Particle deposition efficiency distribution in film cooled wall under M=2:
Figure 13 shows the effect of blowing ratio on the particle deposition efficiency in a specific zone defined in Fig. 6. This specific zone is bounded by x/d=–2 upstream of film hole, x/d=6 downstream of film hole, and y/d=±2. It is interesting to find that the predicted varying tendency of particle deposition efficiency vs the blowing ratio is on the contrary to that as illustrated in Fig. 6 where the deposition efficiency in the selected sampling region decreases as the blowing ratio increases. This is because the case illustrated in Fig. 6 uses more bigger particle size and average particle size is 13.4 mm, This is consistent with the particle size that the experimental results use, and particle size that the present case use is with average size 2 mm, thus once again revealing that when the particle size is bigger than 1 mm, as particle size increases, the deposition efficiency decreases.
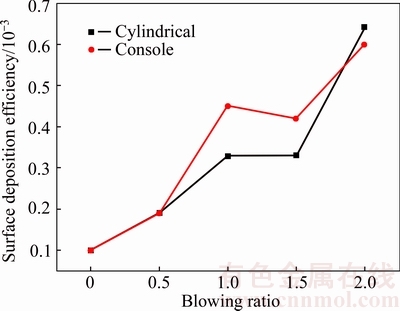
Fig. 13 Particle deposition efficiency in a specific zone
It is also obviously that the deposition efficiency for converging slot hole is less than that for the cylindrical hole at all blowing ratio, especially under higher blowing ratio. When the blowing ratio is equal to 2, the deposition efficiency for converging slot hole is only half of that for the cylindrical hole.
5 Conclusions
1) The coolant jet issuing from cylindrical film hole appears to lift off the wall under higher blowing ratio, producing higher local volumetric concentration of particles near the wall. For cylindrical hole, smaller particle deposits mainly in the upstream zone of the hole and the zone between adjacent holes.
2) Compared with cylindrical holes, the coolant jet from console holes attaches more closely to the wall. Furthermore, the rotation direction of vortices near console hole is contrary to that near cylindrical hole. Console holes yield low particle deposition efficiency, especially under higher blowing ratio.
3) The deposition efficiency of particles with small diameter (<1 mm) increases with the rise of blowing ratio. However, for large particle (>1 mm), the deposition efficiency decreases as blowing ratio increases.
References
[1] LUO K, NIX AC, KANG B S. Effects of syngas particulate fly ash deposition on the mechanical properties of thermal barrier coating on simulated film-cooled turbine vane components [J]. International Journal of Clean Coal & Energy, 2014, 3(1): 54–64.
[2] HAMED A, TABAKOFF W C, WENGLARZ R. Erosion and deposition in turbomachinery [J]. Journal of Propulsion & Power, 2006, 22(2): 350–360.
[3] SUNDARAM N, THOLE K A. Effects of surface deposition, hole blockage, and thermal barrier coating spallation on vane endwall film-cooling [J]. ASME Journal of Turbomachinery, 2006, 129(3): 599–607.
[4] BRUN K, NORED M, KURZ R. Particle transport analysis of sand ingestion in gas turbine engines [J]. ASME Journal of Engineering for Gas Turbines and Power, 2011, 134(1): 141–146.
[5] LAWSON S A, THOLE K A. Effects of simulated particle deposition on film cooling [J]. Journal of Turbomachinery, 2009, 133(2): 41–51.
[6] SREEDHARAN S S, TAFTI D K. Effect of blowing ratio on early stage deposition of syngas ash on a film-cooled vane leading edge using large eddy simulations [J]. Journal of Turbomachinery, 2013, 135(6): 522–535.
[7] DAVIDSON F T, KISTENMACHER D A, BOGARD D G. A study of deposition on a turbine vane with a thermal barrier coating and various film cooling geometries [J]. Journal of Turbomachinery, 2014, 136(4): 1769–1780.
[8] LAWSON S A, THOLE K A. Simulations of multi-phase particle deposition on endwall film-cooling holes in transverse trenches [J]. Journal of Turbomachinery, 2011, 134(5): 157–172.
[9] TANG Chan, ZHANG Jing-zhou. Deposition characteristics of tube bundles in particulate cross-flow [J]. Journal of Central South University: Science and Technology, 2015, 46(12): 4679–4685. (in Chinese)
[10] HAMED A, TABAKOFF W, WENGLARZ R. Erosion and deposition in turbomachinery [J]. Journal of Propulsion and Power, 2006, 22(2): 350–360.
[11] DOBROWOLSKI B, WYDRYCH J. Evaluation of numerical models for prediction of areas subjected to erosion wear [J]. Applied Mechanics and Engineering, 2006, 11(4): 735–749.
[12] EI-BATSH H. Modeling particle deposition on compressor and turbine blade surfaces [D]. Vienna: Vienna University of Technology, 2001.
[13] SHAH A, TAFTI D K. Transport of particulates in an internal cooling ribbed duct [J]. ASME Journal of Turbomachinery, 2007, 129: 816–825.
[14] WAMMACK J E, CROSBY J, FLETCHER D, BONS J P, FLETCHER T H. Evolution of surface deposits on a high pressure turbine blade, part I: Physical characteristics [J]. Journal of Turbomachinery, 2008, 130(2): 53–59.
[15] ROZATI A, TAFTI D K, SREEDHARAN S S. Effects of syngas ash particle size on deposition and erosion of a film cooled leading edge [J]. Journal of Turbomachinery, 2008, 133(133): 589–598.
[16] AI W G, MURRAY N, FLERCHER T H, HARDING S, LEWIS S, BONS J P. Deposition near film cooling holes on a high pressure turbine vane [J]. Journal of Turbomachinery, 2008, 134(4): 825–835.
[17] AI W G, FLETCHER T H. Computational analysis of conjugate heat transfer and particulate deposition on a high pressure turbine vane [J]. ASME Journal of Turbomachinery, 2012, 134(134): 74–89.
[18] AI W G, MURRAY N, FLETCHER T H. Effect of hole spacing on deposition of fine coal fly ash near film cooling holes [J]. ASME Journal of Turbomachinery, 2009, 134(4): 0141021.
[19] ZHOU Jun-hui, ZHANG Jing-zhou. Numerical investigation on particle deposition inside turbine cascade [J]. Acta Aeronautica et Astronautica Sinica, 2013, 34(11): 2492–2499. (in Chinese).
[20] BUNKER R S. A review of turbine shaped film cooling technology [J]. ASME Journal of Heat Transfer, 2005, 127(4): 441–453.
[21] SARGISON J E, OLDFIELD M L G, GUO S M,LOCK D, RAWLINSON A J. Flow visualization of the external flow from a converging slot-hole film-cooling geometry [J]. Experiments in Fluids, 2005, 38(3): 304–318.
[22] YAO Yu, ZHANG Jing-zhou. Investigation on film cooling characteristics from a row of converging slot-holes on flat plate[J]. Science in China: Technology Science, 2011, 54(7): 1793–1800.
[23] LIU Cun-liang, ZHU Hui-ren, BAI Jiang-tao, XU Du-chun. Film cooling performance of converging slot-hole rows on a gas turbine blade[J]. International Journal of Heat and Mass Transfer, 2010, 53(23): 5232–5241.
[24] YAO Yu, ZHANG Jing- zhou, TAN Xiao-ming. Numerical study of film cooling from converging slot-hole on a gas turbine blade suction side [J]. International Communications in Heat and Mass Transfer, 2014, 52(2): 61–72.
[25] GOSMAN A D, IOANNIDES E. Aspects of computer simulation of liquid fuelled combustor [J]. Journal of Energy, 1983, 7(6): 482–490.
[26] BRACH R, DUNN P. A Mathematical model of the impact and adhesion of microspheres [J]. Aerosol Science and Technology, 1992, 16(1): 51–64.
[27] SOLTANI M, AHMADI G. On particle adhesion and removal mechanism in turbulent flows [J]. Journal of Adhesion Science and Technology, 1994, 8(7): 763–785.
(Edited by YANG Hua)
Cite this article as: ZHOU Jun-hui, ZHANG Jing-zhou. Numerical investigation of particle deposition on converging slot-hole film-cooled wall [J]. Journal of Central South University, 2017, 24(12): 2819–2828. DOI: https://doi.org/ 10.1007/s11771-017-3697-0.
Foundation item: Project(51276090) supported by the National Natural Science Foundation of China; Project(CXLX13_166) supported by Funding of Jiangsu Innovation Program for Graduate Education; Project supported by the Fundamental Research Funds for the Central Universities, China
Received date: 2016-03-14; Accepted date: 2016-07-13
Corresponding author: ZHANG Jing-zhou, PhD, Professor; Tel: +86–25–84895909; E-mail: zhangjz@nuaa.edu.cn

