Trans. Nonferrous Met. Soc. China 26(2016) 2313-2319
Mechanical and metallurgical characterization of AA6061 friction stir welded joints using microhardness map
Iman HEJAZI, Seyyed Ehsan MIRSALEHI
Department of Mining and Metallurgical Engineering, Amirkabir University of Technology (Tehran Polytechnic), 424 Hafez Ave, Tehran, Iran
Received 19 September 2015; accepted 20 January 2016
Abstract: The relationships between microhardness and microstructure, macrostructure and mechanical properties of friction stir welded joints AA6061-T913 were studied. Three equations were suggested to predict the grain size, ultimate tensile strength and yield strength from the hardness throughout the weld. Two-dimensional contour of grain size and three-dimensional maps of ultimate tensile and yield strengths were plotted according to the proposed equations. Also, the location of macroscopic zones was estimated based on hardness distribution. The modeling results were compared with the results obtained from microscopy and tensile tests. The modeling results show good agreement with the experimental findings, and the average differences between them for the ultimate tensile strength and yield strength were about 8% and 3%, respectively.
Key words: AA6061 alloy; friction stir welding; microhardness; macrostructure; microstructure; mechanical properties
1 Introduction
After two decades of development, friction stir welding (FSW) has become a viable and important manufacturing alternative or fabrication component, especially in aerospace or aeronautics applications and large tank for launch vehicles involving aluminum alloys [1-3]. FSW technology requires a thorough understanding of the process, and the evaluation of consequent weld mechanical properties is needed in order to use the FSW process for the production of components. The heat caused by the friction between the tool shoulder and the workpiece results in an intense local heating that does not melt the plates to be joined, but softens and plasticizes the material around the tool [4,5].
Thus, the distributions of temperature and plastic strain are non-uniform and will result in different microstructures and residual stresses in the welded workpiece [6,7]. Residual stress produced by various manufacturing methods is a crucial factor when assessing the integrity of engineering components and has attracted attention all the time [8]. Hence, certain associated defects have to be eliminated, and non-uniform temperature distributions along the welding line should be improved. It shows the significant importance of investigation on microstructure and mechanical distribution through the weld joints. CAVALIERE et al [9] stated that detailed research and qualification work in this field are required. However, despite the widespread growth of FSW as a commercial joining process, the relationship between microstructure and properties of joint is not well understood [10]. The hardness of a material is dependent on its microstructure [11]. Thus, hardness measurement would be an acceptable method to investigate the inhomogeneous microstructures. Correlations between the microstructure and the hardness in weld joints, and the relationship between hardness and strength have been established for engineering materials.
OM images of different areas show a significant difference in the microstructure of the regions which exhibit high and low hardness values [12]. There are a number of researches and reports regarding the relationship between the hardness profile and microstructure and/or mechanical properties. For example,  and ROSENBERG [13] described the correlation between hardness and tensile properties in ultra-high strength dual phase steels, and SHEN [14] studied the relation between hardness and tensile strength in particle reinforced metal matrix composites [14]. ZHAO et al [15] studied the relationship between hardness and grain size using the Hall�CPetch relation in the stir zone of FSW joints. Also, JONES et al [16] investigated the correlation between microstructure and microhardness in friction stir welded 2024 aluminum alloy. However, limited works have been performed about application of hardness map.
A number of disadvantages are associated with the conventional methods of observing the microstructures of materials. The conventional methods such as optical microscopy and scanning electron microscopy show the microstructures of only a few selected points of surface and these methods are not appropriate for investigating the inhomogeneity of microstructures. Furthermore, the proper preparation of metallographic specimens of such materials using classical etching methods possesses numerous difficulties and sometimes proves to be impossible [17]. Surface hardness mapping method provides an easy way to observe the microstructure of whole weld zone and investigation on distribution of mechanical properties and microstructure.
The aim of this study is to explore the utilization of hardness maps for research on microstructure and macrostructure, and mechanical properties of the friction stir welded joints, and to evaluate the changes occur in hardness due to the welding thermomechanical effects.
2 Experimental
The material used was AA6061-T913 aluminum sheet with 4 mm in thickness. The results of chemical analysis and mechanical testing of the base metal are presented in Tables 1 and 2, respectively. Before FSW butt joining, the sheets were cut into pieces with dimensions of 200 mm �� 300 mm. The welding experiments were performed with a tool tilt angle of 1��, travel speed of 18 mm/min, and rotating speed of 940 r/min. The tool had a concave shoulder with a diameter of 16 mm and a tapered cone pin with a base diameter of 4 mm and a length of 3.7 mm. The pin and shoulder concavity angles were 20�� and 12��, respectively. The material of the FSW tool was H13 tool steel. The hardness of the tool after heat treatment was around HRC 54.
Table 1 Chemical composition of base metal (mass fraction, %)
Table 2 Mechanical properties of base metal
Zwick/SP1200 universal testing machine was used to perform the tensile test of the specimens longitudinally to the rolling direction at a cross head speed of 1 mm/min. The tensile specimens were prepared as per standard ASTM E8/E8M [18]. The photographs of the welded joint and the specimens before and after the tensile testing are shown in Fig. 1.
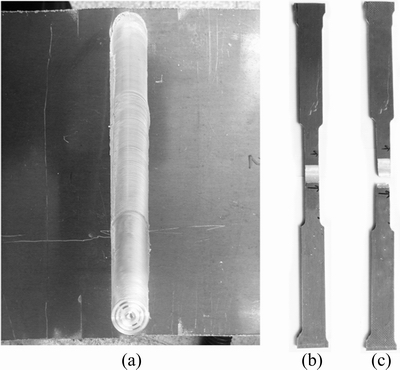
Fig. 1 Photographs of welded joint (a), specimens before (b) and after (c) tensile testing
Optical microscopy (OM) observation of the welded sheets was carried out using an Olympus B202 microscope, and the micrographs were taken at different magnifications. For metallurgical investigations, the specimens were prepared according to the ASTM E3-01 [19]. Sample surfaces were polished with 200, 1000, and 2000 grit silicon carbide paper and then etched for a few seconds, using a Keller��s reagent consisting of 2 mL HF, 3 mL HCl, 5 mL HNO3 and 190 mL H2O.
The mean grain size was evaluated by the line intercept method according to the ASTM E112 [20].
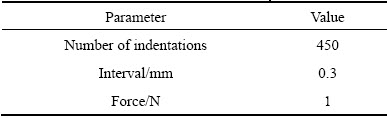
The surface hardness measurements were started at a distance of 8 mm from the weld center to cover all friction stir welding areas. The hardness map was obtained with a diamond indenter. Figure 2 shows the sketch of the hardness map zone specified for the used sample. The surface hardness measurement condition is presented in Table 3.
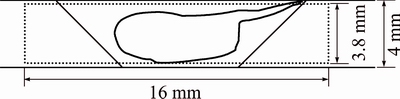
Fig. 2 Sketch of hardness map zone and cross section of FSW joint
Table 3 Microhardness measurement condition
3 Results and discussion
3.1 Correlation between macrostructure and microhardness
The hardness map of the entire weld is shown in Fig. 3(a). It is obvious that hardness distribution is not uniform across the weld. Hardness mapping allows for visual observation of different zones. It clearly shows different FSW zones including stir zone (SZ), thermo- mechanically affected zone (TMAZ), and heat affected zone (HAZ) by showing each zone by its color. The hardness map shown in Fig. 3(a) demonstrates that the SZ is harder than the surrounding TMAZ and HAZ and the ultimate low point of microhardness occurs at the boundary of the HAZ and TMAZ on the advancing side. The HAZ on the retreating side has a similarly low hardness. Hardness map allows to represent the hardness profile in any direction through the weld area. For example, Fig. 3(c) shows hardness profile of the sample. This microhardness profile shows the typical ��W�� shape for precipitation strengthened alloys. The outer edges of this distribution would be expected to increase continuously in microhardness until reaching the unaffected base material hardness value. According to Fig. 3(c), the SZ has the highest hardness compared with the adjacent regions. It seems that the relatively high hardness of the SZ is due to its fine and equiaxed grains (resulting from dynamic recrystallization) and the related grain boundary strengthening; while the low hardness of the TMAZ can be resulted from dissolution of strengthening precipitates, or over aging, occurring due to elevated temperatures experienced during the FSW process, and the low hardness of the HAZ can be a result of grain coarsening and over aging taken place in this zone.

Fig. 3 Hardness map of entire FSW joint (a), macrostructure of welded sample and its zones (b), and hardness profile across dashed line (c)
From the macroscopic studies (Fig. 3(b)), different regions of the weldment are identified. These boundaries well-matched with areas obtained from hardness map indication.
3.2 Microstructural analysis using microhardness map
To facilitate understanding of grain size change in different FSW zones, grain size distribution mapping is one of the best practices. Hardness and strength of materials with conventional grain size (grain diameter d>1 ��m) are a function of grain size. For ductile polycrystalline materials, the empirical Hall-Petch equation has been found to express the grain-size dependence of flow stress at any plastic strain out to ductile fracture. In terms of yield stress, this expression is [21]:
 (1)
(1)
where ��0 is the yield stress, ��i is the friction stress opposing dislocation motion, k is a constant, and d is grain diameter. Similar results are obtained for hardness:
 (2)
(2)
where H0 is the hardness, A and k are constants. The equation constants can be calculated by substituting average hardness and related average grain size of different welding zones in Eq. (2). According to Fig. 4 which represents the microstructure of different joint zones, the average grain size of each zone could be determined. According to Table 4 which shows average grain sizes and relative mean hardness values, the final equation would be
 (3)
(3)
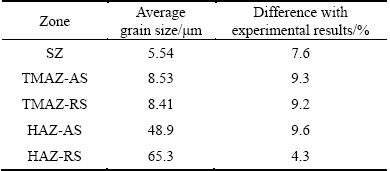
The grain size values can be determined employing the Hall-Petch equation with known constants. The grain sizes were calculated using the hardness values corresponding to each indent in the welded area. Figure 5, which represents the predicted grain size distribution map, indicates significant differences between the weld nugget, the TMAZ on advancing side, and the TMAZ on retreating side. The nugget zone is characterized by a relatively homogeneous micro- structure with smaller grains, whereas the TMAZ on advancing and retreating sides has larger grains. The retreating side of the FSW joint has a more complex microstructure and slightly smaller grain size than the advancing side. The mean grain size of each welding area and its difference with those obtained from microstructural images are presented in Table 5.
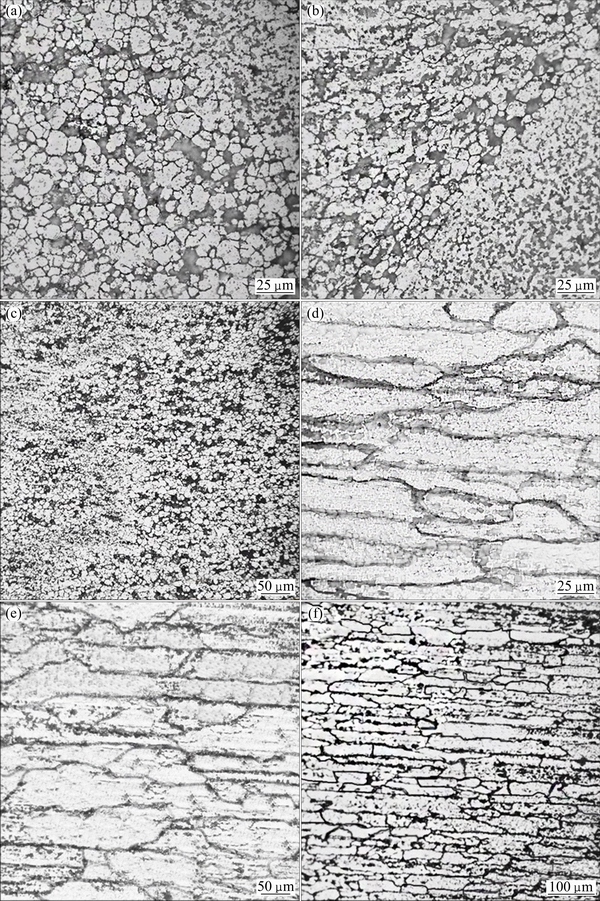
Fig. 4 Microstructures of SZ (a), TMAZ on AS (b), TMAZ on RS (c), HAZ of AS (d), HAZ of RS (e), and base metal (f) of friction stir welded AA6061-T913
Table 4 Average grain size of different FSW zones obtained from microscopy
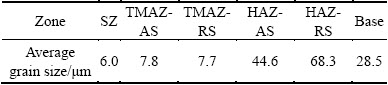
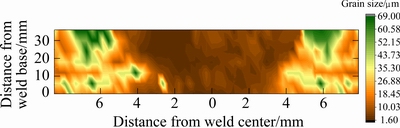
Fig. 5 Grain size distribution map based on Hall-Petch equation
Table 5 Average grain sizes of different FSW zones predicted using Eq. (3)
3.3 Correlation between strength and microhardness
Ultimate tensile strength and yield strength of any point could be determined using suitable relations between hardness and these strengths. The calculated data can then be plotted as distribution maps for easy visualization of strength variations. CAHOON et al [22,23] offered two equations to correlate hardness of materials with their yield and tensile strengths by using strain hardening coefficient, which were based on the total strain instead of true plastic strain:
 (4)
(4)
 (5)
(5)
where H is the Vickers hardness, n is the strain hardening coefficient, ��Y is the yield strength and ��UTS is the ultimate tensile strength in MPa �� 10-1.
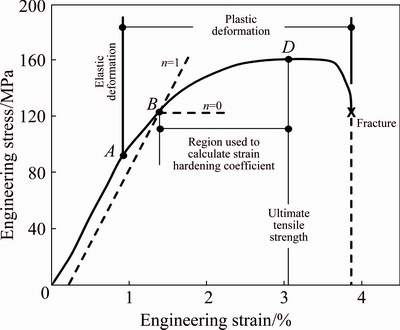
Fig. 6 Stress-strain curve obtained for FSWed AA6061-T913, with UTS and YS values of 161 and 121 MPa, respectively
CAHOON et al [22] suggested that the H/3 coefficient is a suitable value in determining ��Y for aluminum; however, some assumptions must be considered to revise H/2.9 coefficient for aluminium in determining ��UTS. According to CAHOON [23], H/2.9 is the value of true stress at the peak of the stress�Cstrain diagram. The true stress and strain can be calculated using their engineering quantities. The obtained true stress of 1.685 MPa and corresponding measured hardness of HV 84 will result in the coefficient of H/5.06. Hence, the final ��UTS equation would be
 (6)
(6)
Strain hardening coefficient, n, could be calculated according to ASTM E646-07e1 standard [24]. ASTM E646 is a tensile test that measures the stress-strain response in the plastic region prior to necking (d��=0) that is the region of the curve between yield strength at point B and ultimate strength at point D in Fig. 6 [25]. In the B-D strain hardening region, the stress-strain relationship is approximated by the following equation:
 (7)
(7)
where ��t is the true stress, K is the strength coefficient, ��t is the true strain, and n is the strain hardening coefficient. Equation (7) is a power function and requires conversion to a logarithmic form in order to calculate the strain hardening coefficient n:
 (8)
(8)
The exponent, n, is obtained from the true stress-true strain curve which is derived from the engineering stress-engineering strain curve. Assuming being constant of specimen volume, the relations between true stress and engineering stress and true strain and engineering strain are as follows:
 (9)
(9)
 (10)
(10)
where �� is engineering stress, and �� is engineering strain.
Equation (8) is presented in the form of a straight line where n is the slope of the line and lg K is the intercept in axis y. Using linear regression analysis, the equation for the strain hardening exponent, n, becomes
 (11)
(11)
where

In order to calculate n, at least 5 data pairs between points B and D should be selected. According to Eq. (11) and Fig. 6, strain hardening exponent, n, would be equal to 0.329.
The determined ultimate tensile strength and yield strength values using this technique are in good agreement with the experimental values; however, the predicted yield strength has somewhat better accuracy. The relative error between calculated ultimate tensile strengths and experimental values was 8%; however, the relative error between calculated yield strengths and experimental data was 3%. This approach was also used to determine the ultimate tensile strength and yield strength throughout the FSW zones. Figures 7 and 8 show the yield strength and ultimate tensile strength distribution maps of the weld area, respectively. As it is apparent in 3D models, the boundary between TMAZ and HAZ on advancing side has lower tensile and yield strengths, which is also the failure location of experimental tensile test specimens. It seems that the experimental and theoretical data match reasonably well for both the ultimate tensile and yield strengths.
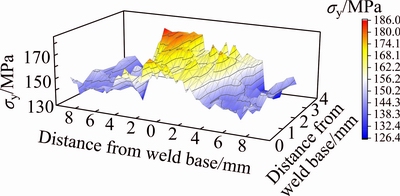
Fig. 7 Yield strength distribution map of FSWed joint predicted by Eq. (4)
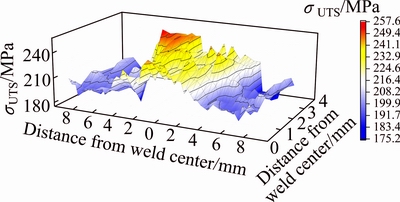
Fig. 8 Ultimate tensile strength distribution map of FSWed joint predicted by Eq. (6)
4 Conclusions
1) Some equations were proposed to calculate the grain size, ultimate tensile strength and yield strength of friction stir welded AA6061-T913 joints from the hardness across the FSW joint. A good agreement was found between the results obtained from microscopy and tensile tests, and the calculation results.
2) The maximum hardness of HV 119 was obtained for the SZ, while the boundary between the HAZ and the TMAZ on the advancing side (failure location in the tensile testing) exhibited the lowest hardness value of HV 81.
3) The places of different FSW zones were estimated using hardness map of the joint cross-section. The SZ, TMAZ, and HAZ were clearly distinguished based on the hardness distribution. Thus, it was shown that microhardness map can be employed as a supplementary or alternative method for macroscopy in many situations.
4) Grain size distribution of the joint area was modeled according to the proposed equation. The modeling results showed suitable conformity with those obtained from microscopic observations (with an average difference of ~8%).
5) Ultimate tensile and yield strengths�� maps were provided taking into account the correlation between hardness and these strengths. Good agreement was observed between the experimental results obtained from the tensile test and the predictions (with an average difference of ~6%).
6) Totally, the present investigation showed successful applicability of hardness map for prediction of macrostructure and microstructure, and strength properties of aluminum alloy FSW joints.
Acknowledgment
The support of Iran National Science Foundation (INSF) (Grant No. 91051732) is gratefully acknowledged.
References
[1] BALASUBRAMANIAN V. Relationship between base metal properties and friction stir welding process parameters [J]. Materials Science and Engineering A, 2008, 480: 397-403.
[2] ILANGOVAN M, BOOPATHY S R, BALASUBRAMANIAN V. Microstructure and tensile properties of friction stir welded dissimilar AA6061�CAA5086 aluminium alloy joints [J]. Transactions of Nonferrous Metals Society of China, 2015, 25: 1080-1090.
[3] HRISHIKESH D, CHAKRABORTY D, PAL T K. High-cycle fatigue behavior of friction stir butt welded 6061 aluminium alloy [J]. Transactions of Nonferrous Metals Society of China, 2014, 24: 648-456.
[4]  G, MISTIKOGLU S. Recent developments in friction stir welding of Al-alloys [J]. Journal of Materials Engineering and Performance, 2014, 23(6): 1936-1953.
[5] WAN L, HUANG Y, LV Z, LV S, FENG J. Effect of self-support friction stir welding on microstructure and microhardness of 6082-T6 aluminum alloy joint [J]. Materials & Design, 2014, 55: 197-203.
[6] HARIHARAN A. Friction stir welding (FSW) process modeling and FSW joint design for blast survivable structures [D]. Clemson: Clemson University, 2011.
[7] WAN L, HUANG Y, GUO W, LV S, FENG J. Mechanical properties and microstructure of 6082-T6 aluminum alloy joints by self-support friction stir welding [J]. Journal of Materials Science and Technology, 2014, 30: 1243-1250.
[8] CHUAN L, DONG C L. Internal residual stress measurement on linear friction welding of titanium alloy plates with contour method [J]. Transactions of Nonferrous Metals Society of China, 2014, 24: 1387-1392.
[9] CAVALIERE P, SQUILLACE A, PANELLA F. Effect of welding parameters on mechanical and microstructural properties of AA6082 joints produced by friction stir welding [J]. Journal of Materials Processing Technology, 2008, 200: 364-372.
[10] HE Z B, PENG Y Y, YIN Z M, LEI X F. Comparison of FSW and TIG welded joints in Al-Mg-Mn-Sc-Zr alloy plates [J]. Transactions of Nonferrous Metals Society of China, 2011, 21: 1685-1691.
[11] RAJAKUMAR S, BALASUBRAMANIAN V. Correlation between weld nugget grain size, weld nugget hardness and tensile strength of friction stir welded commercial grade aluminium alloy joints [J]. Materials & Design, 2012, 34: 242-251.
[12] GHAZANFARI H, NADERI M, IRANMANESH M, SEYDI M, POSHTEBAN A. A comparative study of the microstructure and mechanical properties of HTLA steel welds obtained by the tungsten arc welding and resistance spot welding [J]. Materials Science and Engineering A, 2012, 534: 90-100.
[13] M, ROSENBERG G. Correlation between hardness and tensile properties in ultra-high strength dual phase steels [J]. Materials Engineering, 2011, 18: 155-159.
[14] SHEN Y L. On the correlation between hardness and tensile strength in particle reinforced metal matrix composites [J]. Materials Science and Engineering A, 2001, 297: 44-47.
[15] ZHAO Y H, LIN S B, HE Z Q, WU L. Microhardness prediction in friction stir welding of 2014 aluminium alloy [J]. Science and Technology of Welding and Joining, 2006, 11: 178-182.
[16] JONES M, HEURTIER P, DESRAYAUD C, MONTHEILLET F, ALLEHAUX D, DRIVER J. Correlation between microstructure and microhardness in a friction stir welded 2024 aluminium alloy [J]. Scripta Materialia, 2005, 52: 693-697.
[17]  M S. Electrolytic etching in welding metallography [J]. Institute of Welding Bulletin, 2013, 2: 5-10.
[18] ASTME8/E8M-13a, standard test methods for tension testing of metallic materials [S]. West Conshohocken, PA: ASTM International, 2013.
[19] ASTME3-01, standard practice for preparation of metallographic specimens [S]. West Conshohocken, PA: ASTM International, 2001.
[20] ASTME112-13, standard test methods for determining average grain size. [S]. West Conshohocken, PA: ASTM International, 2013.
[21] SIEGEL R W, HU E. R&D status and trends in nanoparticles, nanostructured materials, and nanodevices [M]. Heidelberg: Springer, 1999.
[22] CAHOON J R, BROUGHTON W H, KUTZAK A R. The determination of yield strength from hardness measurements [J]. Metallurgical Transactions, 1971, 2: 1979-1983.
[23] CAHOON J R. An improved equation relating hardness to ultimate strength [J]. Metallurgical Transactions, 1972.
[24] ASTME646-07e1, standard test method for tensile strain-hardening exponents (n-Values) of metallic sheet materials [S]. West Conshohocken, PA: ASTM International, 2007.
[25] ADMET. ASTM E646 strain-hardening exponent testing [EB/OL]. http:// www.admet.com. 2013.
������Ӳ��ͼ��AA6061�Ͻ����Ħ�����ӽ�ͷ����ѧ��ұ�����ܱ���
Iman HEJAZI, Seyyed Ehsan MIRSALEHI
Department of Mining and Metallurgical Engineering, Amirkabir University of Technology (Tehran Polytechnic), 424 Hafez Ave, Tehran, Iran
ժ Ҫ���о�����Ħ�����ӽ�ͷAA6061-T913����Ӳ����������֯�������֯����ѧ���ܵĹ�ϵ����������������Ӳ�ȣ����3������ʽ�ֱ�Ԥ�⺸���Ͻ�ľ����ߴ硢��������ǿ�Ⱥ�����ǿ�ȡ������������ķ���ʽ�����ƹ��ھ����ߴ�Ķ�άͼ�Լ����ڼ�������ǿ�Ⱥ�����ǿ�ȵ���άͼ������Ӳ�ȷֲ����ߣ�ȷ����������λ�ã�����ģ�����ý�������۲켰�������������бȽϡ����������ģ������ʵ�����ǺϽϺá����ڼ�������ǿ�Ⱥ�����ǿ�ȣ���ģ������ʵ������ƽ�����ֱ�Ϊ8%��3%��
�ؼ��ʣ�AA6061�Ͻ𣻽���Ħ��������Ӳ�ȣ������֯������֯����ѧ����
(Edited by Wei-ping CHEN)
Corresponding author: Seyyed Ehsan MIRSALEHI; Tel: +98-21-64542978; E-mail: mirsalehi@aut.ac.ir
DOI: 10.1016/S1003-6326(16)64351-0

