Risk assessment of lead emissions from anthropogenic cycle
Jing LIANG, Jian-su MAO
State Key Joint Laboratory of Environment Simulation and Pollution Control, School of Environment,
Beijing Normal University, Beijing 100875, China
Received 4 November 2014; accepted 23 January 2015
Abstract: The risk assessment right from the source of emissions can effectively guide the pollution control. A model was established, consisting of four part: source estimation, environmental fate analysis, exposure analysis and risk assessment. The human health risk, ecological risk and total risk of lead emissions were assessed. The factors were estimated to indicate the environmental decrease and exposure probability. Of all the 1887 t emissions in China in 2010 (quantified in the previous work), it is turned out 1.3 t reached human bodies (0.9 mg/ca), and 2.7 t reached the ecosystem. Lead mainly came from the Use stage for the source while lead causing risk mainly came from the Waste Management & Recycling and Production stages. As for chemical forms, PbO contributed most to the human health risk and PbSO4 contributed most to the ecological risk. PbSO4, PbO and Pb altogether contributed 71% to the total risk, indicating these three chemicals should be taken priority for the risk management.
Key words: lead; source; human health risk; ecological risk; total risk; life cycle
1 Introduction
Lead is one of the most abundant and toxic heavy metals in the environment [1]. There are both natural and anthropogenic sources for lead emissions, and the anthropogenic sources dominate the emissions [2]. According to study, more than 95% of the lead within the biosphere is of anthropogenic origin [3]. Although the lead abatement programs are provided in many developed countries, lead risk is still an important concern in the developing countries such as China [4]. Threaten imposed by lead pollution to human health and ecosystem still deserves our intensive attention. In this context, the risk assessment can be used to support the decision making in lead pollution management.
A wide variety of studies are already done on lead risk assessment, which can roughly be classified into the human health risk assessment and the ecological risk assessment. Human health risk assessment is defined as the process which estimates the likelihood of adverse health effects on humans who may be exposed to chemicals in contaminated environmental media [5]. Up to date, the human health risk assessment is generally determined by gauging the concentration in the environment, applying the method recommended by US environmental protection agency (EPA) [6,7]. On the other hand, the ecological risk assessment evaluates the likelihood that adverse ecological effects may occur or are occurring as a result of exposure to one or more stressors [8]. For the ecological risk assessment, the method of hazard quotient is most widely applied [9-11]. All the present studies provide a clear way to measure lead risk. However, they fail to take the pollution sources into account, which is an integral part of risk formation. A study attempted to assess the risk of lead losses, but it lacks a detailed speciation as well as the analysis of environmental fate and exposure [12]. Thus, the information on which process (or life cycle stage) should be paid attention to, and which chemical forms should be taken priority is still missing. This kind of knowledge is significant in helping direct limitation of social consumption and governmental resources management.
In this study, a model to assess lead risk was established. The source emissions were estimated and the environmental fate and exposure were analyzed. The factors were applied to estimate the environmental decrease and exposure probability. Finally, the risk scores showing the levels of risk were calculated.
2 Methodology
2.1 Framework for lead risk assessment
The framework for lead risk assessment consists of four components: source estimation, environmental fate analysis, exposure analysis and risk assessment (Fig. 1). The source estimation refers to the quantification and speciation of emissions from anthropogenic cycle. The environmental fate analysis refers to the analysis of the move and transformation of chemicals in the environment. The exposure analysis estimates the likelihood of exposure to chemicals in contaminated environmental media. And the risk assessment includes three types of risk: the human health risk, the ecological risk and the total risk.
The risk of lead emissions (R) can be influenced by four factors:
 (1)
(1)
where Q is the emission quantity from the source with the unit of t, fe is the fate coefficient indicating the quantity decrease in the environment, fx is the exposure coefficient indicating the likelihood of lead exposure, E is the effect factor showing the toxicity of lead emissions, represented by the unit risk score in the Indiana Relative Chemical Hazard (IRCH) ranking system [13]. The IRCH ranking system provides the unit human health risk score, unit ecological risk score and unit total risk score for various lead chemicals. As the scores in the IRCH ranking system were obtained from the sum of the points assigned, therefore they do not have any units. In this study, the risk was calculated by multiplying the unit score by the emission quantities with a unified unit of t (ton). For easy comparison, the outcomes of the calculation were defined as scores without units.

Fig. 1 Framework for lead risk assessment
The total risk for lead emissions integrates both the human health risk and the ecological risk. According to the definition of total risk in the IRCH ranking system, the total risk RT is defined as:
 (2)
(2)
where RH is the human health risk and RE is the ecological risk. The coefficients of 1.15, 3.5 and 2 are applied by the IRCH ranking system based on how much the human health risk and the ecological risk contribute to the total risk.
2.2 Model for lead risk assessment
2.2.1 Source estimations
The anthropogenic cycle includes all the stages in lead life cycle: Production, Fabrication & Manufacture (F&M), Use and Waste Management & Recycling (WM&R). At the Production stage, the primary lead is refined from lead ores, and the secondary lead is refined from lead waste. At the F&M stage, lead product is manufactured. The Use stage is the phase where lead product provides service to human and satisfies the demands. At the Waste Management & Recycling stage, lead discards are recycled, disposed or landfilled. Due to the differences between the four stages, the lead chemical forms emitted vary from stage to stage. In our previous research, we have studied the quantities and chemical forms emitted from lead life cycle in 2010 for China, the detailed calculation can be referred to Refs. [14,15]. The chemical forms and their quantities are shown in Table 1.
2.2.2 Environmental fate analysis
In this section, what media the chemicals enter are firstly analyzed, and then the technological treatment and natural decrease are considered, which together result in a decrease of emissions quantity.
The environmental fate depends on the receiving media as well as the chemicals themselves. The types of lead wastes discharged from the life cycle stages have already been analyzed in the previous study [15]. In this study, the fate of chemical forms is estimated according to the possible fate of the wastes. For example, the tailings are emitted and mainly go to soil at the Production stage. As PbSO4 mainly exists in the tailings, we assume that at the production stage, 80% of PbgSO4
goes into soil, and the rest goes into water and air with an equal proportion of 10%. The fate of all other chemicals can be obtained with similar analysis.
Due to the human treatment methods, some emissions are removed technologically when introduced into air, water and soil. According to China Statistical Report on Environment in 2010 [16], the removal rate from effluents by standard waste water treatment methods is 90%, with 10% still left in water. The removal rate of lead in soil is estimated to be 30% based on the treatment rate of multiple solid wastes recorded in the China Statistical Yearbook on Environment [17]. For the removal rate in the air, 95% of the total is assumed to be removed because the collection efficiency of dust collector in China is about 95% [18].
For lead emissions that stay in the environment, some have little mobility, and therefore they have minimal exposure potential and pose little or no danger to human and ecosystem. The decrease factors are used here to measure how much emissions exactly have the risk potential. For lead in the water, the precipitation reactions, along with strong absorption by suspended particle, cause a sharp decrease in quantity. The soluble lead is deduced from the solubility product constant [19]. For lead in the soil, lead is immobilized through sorption or precipitation processes, and usually remains on the surface. The soluble lead in soil is estimated from the absorption rate in soil [20]. For lead in the air, the atmospheric deposition, a transport process from air to water or soil, causes a quantitative decrease of lead in the atmosphere. This decrease factor is estimated based on the information that atmospheric deposition is about 1mg/d in polluted areas [21].
2.2.3 Exposure analysis
Exposure analysis includes the analysis of exposure endpoint, routes and likelihood. The endpoint of health risk is human body. The main routes for human exposure are the consumption of contaminated food and drinking water, the ingestion of soil and dust, the inhalation and dermal absorption. Lead in the soil can be exposed by food consumption or soil ingestion. For the food consumption, the exposure likelihood is represented by dietary absorption rate, which is 50% [22]. For the soil ingestion, as the bioavailability of lead in soil is about 60% of that in water and food, therefore, the absorption rate of soil lead is 30% [23]. The inhalation and dermal intake are estimated based on the absorption coefficient [24] and the skin permeability [25], respectively. As for lead in the water, human can be exposed by water consumption or having bath. As a study on the drinking water in China showing that there is no health risk caused by lead [26], this work considers that the risk from drinking water is insignificant.
Table 1 Chemical forms and their quantities emitted from anthropogenic lead cycle in 2010 in China
![˵��: C:\Users\Administrator\AppData\Roaming\Tencent\Users\943171351\QQ\WinTemp\RichOle\S1%2~]3C]{7B1}7WDZH{%AL.png](/web/fileinfo/upload/magazine/12511/310842/image008.jpg)
The endpoints of ecological risk include the animals and plants in ecosystem. Due to the richness of biodiversity and the complexity of ecosystem, the studies on ecological risk assessment just starts. The ecological exposure risk is related to many factors, such as body weight, contact route, and population dynamics. Some detailed exposure factors have been given for some specific animal species [27], however, a general factor has not been given for all the animals and plants. This work will not give the exposure factors for the ecological risk assessment, and just assume that all the lead emissions remaining in environment are to pose an ecological risk in the long run.
All the environmental decrease factors and exposure factors in the risk assessment model can be seen in Table 2.
2.3 Risk assessment
The risk scores were calculated for all three kinds of risks based on the unit risk scores from the IRCH ranking system [13]. The unit scores for chemicals such as PbSO4, PbS and Pb are already available from this ranking system, however, the scores for PbCO3, PbO2 and PbO cannot be obtained. Estimations were made by applying the assignment principles of this ranking system, which indicates that the risk score of a chemical relies on its presence on the regulatory lists and target lists of the government.
According to the IRCH ranking system, the lowest ecological risk score is 75 for lead thiocyanate. Lead thiocyanate exists in the government regulation list of Dangerous for the Environment [28] while PbCO3 does not. This indicates that PbCO3 has a lower risk than lead thiocyanate according to the principals of this system. The PbCO3��s risk score is assumed to be 74. As PbO and PbO2 are on this very list, the score 76 is assigned to them.
Then, the unit human health risk scores for PbO, PbO2 and PbCO3 were estimated. Some information regarding the chemical��s health effects was obtained from International Chemical Safety Card [29], using Pb as a reference. Pb, PbO and PbO2 are similar in many properties except that PbO2 is more active than Pb with strong oxidability. The unit risk scores of PbO and PbO2 are estimated to be 22 and 23, respectively. As PbCO3 has a low capacity to impact human health, its score is set as 11, using the scores for other metals in this system as the reference. All the unit risk scores for lead chemicals are shown in Table 3.
Table 2 Fate factors and exposure factors for lead emissions in risk assessment

Table 3 Unit risk scores for lead chemicals according to IRCH ranking system

3 Results and discussion
3.1 Human health risk assessment
Based on the model of lead risk assessment, the lead intake from food consumption was the most while the dermal intake was the least in 2010. It is known from the previous study that lead emissions were 1887 t from the source in 2010 for China, mainly from the Use stage (39%) [14]. However, after the processes of environmental fate and risk exposure, the lead emissions that reached human bodies were mainly from the Waste Management & Recycling stage (42% of the total) and the Production stage (33% of the total). The health risk also mainly came from the Waste Management & Recycling stage and the Production stage.
In terms of chemical forms, PbO (523 t) and PbSO4 (437 t) were the most in the source emissions, occupying 28% and 23%, respectively [14]. After the processes of environmental fate and risk exposure, the quantity of lead emissions that reached human bodies was 1.3 t, which equaled 0.9 mg on per capital level, with PbSO4, PbO and PbCO3 were 0.29, 0.22 and 0.10 mg/ca, respectively. (the population in China was set as 1.36 billion). Based on Eq. (1) and the unit risk scores, the total human health risk score was calculated to be 30. For PbO and PbSO4, their health risk scores were 12 and 7, respectively. Altogether, these two chemicals occupied 63% of the total. This fraction was higher than the quantitative fraction in the source emissions (51%). The distribution of human health risk among different life cycle stages and chemical forms are shown in Fig. 2.

Fig. 2 Human health risk distribution for lead emissions in 2010 in China (F&M: Fabrication & Manufacture; WM&R: Waste Management & Recycling)
3.2 Ecological risk assessment
Following the assessment model, the lead emissions that reached the ecosystem were quantified as 2.7 t. For the source emissions, they mainly came from the Use stage (as mentioned above), while the emissions posing an ecological risk mainly came from the Waste Management & Recycling stage and the Production stage (altogether occupied 65% of the total). Based on the unit ecological risk scores and Eq. (1), the ecological risk score was calculated to be 255, with the stages of Waste Management & Recycling and production contributing most.
In terms of chemical forms, the most chemicals emitted were PbO (523 t, 28%) and PbSO4 (437 t, 23%). The most chemical quantitatively reached ecosystem was PbSO4. For the total risk score, PbSO4 (87 t, 38%), PbO (48 t, 28%) and Pb (42 t, 22%) contributed most. The distribution of ecological risk among the production and chemical forms are shown in Fig. 3.

Fig. 3 Ecological risk distribution for lead emissions in 2010 in China
3.3 Total risk assessment
With Eq. (2), the total risk was calculated as 54. The total risk mainly came from the Waste Management & Recycling stage (43%) and the Production stage (32%). As for the chemical forms, the total risk was mainly caused by PbSO4 (36%), PbO (20%) and Pb (14%). The ecological risk was larger than the human health risk, and the total risk score was between them (Table 4). The total lead risk score is significant in that the risk score of lead can be compared with the scores of other metals such as copper and zinc to measure their overall risks.
Table 4 Human health risk, ecological risk and total risk score in 2010 in China based on IRCH ranking system
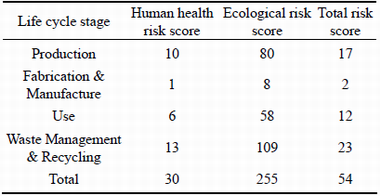
The quantity of emissions that caused an ecological risk was twice that caused the health risk, but the total ecological risk was over eight times the health risk, which probably resulted from the higher unit ecological risk scores (Fig. 4). For both risks, PbSO4 and PbO were the primary chemicals that contributed most. Although the emission quantity of PbCO3 causing risk was no less than that of Pb, its human and ecological risks were less. By applying Eq. (2), the chemicals�� contribution to the total risk can be obtained from the chemicals�� contribution to the human health risk and ecological risk. Pb contributed more than PbCO3 to the total risk. To conclude, PbSO4, PbO and Pb altogether occupied 71% of the total risk, which implies that these three chemicals should be taken priority for pollution control.
3.4 Uncertainty analysis
In this section, the main sources of uncertainty are identified:
1) The uncertainty of the hypothesis in the environmental process. When lead emissions entered the environment, their chemical forms will definitely change due to the interactions between them. In this study, the chemical forms from the source were applied to evaluate the risk, without considering the specific changes of chemicals in the environment, which may lead to some imprecision. In addition, the environmental fate of chemicals was estimated by assigning factors, which only showed a possible scenario in the environment.
2) Uncertainty in the exposure process. As the technology differs greatly from one area to another, the lead pollution is at different levels. In addition, some people are more vulnerable to lead pollution and thus are exposed to more risk.
3) Uncertainty in source estimation. The quantities of chemicals are quoted from the previous work, in which the chemical forms emitted perhaps experience one transformation.

Fig. 4 Risk assessment of lead emissions in China in 2010
4) Uncertainty in factor estimation. Because this work tries to estimate the lead risk with a new method, the studies that can be referred to are limited. The determination of factors such as the decrease factors and exposure factors are attempted, and their precision remains to be check in the future.
5) Uncertainly in the unit risk scores. The scores in the IRCH ranking system does not cover all the chemicals, and the estimation for the unlisted ones cannot be as precise as the listed ones.
4 Conclusions
1) A model for lead risk assessment is established, and the human health risk, ecological risk and total risk are assessed. The source emissions were 1887 t in 2010 for China. The lead that reached human body was quantified to be 1.3 t (0.9 mg/ca) while the lead that reached ecosystem was 2.7 t. Based on the unit risk score obtained from the IRCH ranking system, the human health risk is calculated to be 30, the ecological risk is 255 and the total risk is 54.
2) In terms of life cycle stages, lead emissions mainly come from the Use stage, while lead emissions reached human and ecosystem mainly come from the Waste Management & Recycling and Production stages. These two stages also contribute most to the total risk.
3) In terms of chemical forms, the most chemicals discharged from the source are PbO and PbSO4. The most significant chemical for the health risk is PbO while the major chemical for the ecological risk is PbSO4. For the total risk assessment, PbSO4, PbO and Pb altogether contribute 71%, which implies that those three forms should be taken priority for lead pollution control.
References
[1] NIISOE T, HARADA K H, HITOMI T, WATANABE T, HUNG N N, ISHIKAWA H, WANG Z F, KOIZUMI A. Environmental ecological modeling of human blood lead levels in east Asia [J]. Environmental Science and Technology, 2011, 45(7): 2856-2862.
[2] KLEE R J, GRAEDEL T E. Elemental cycles: A status report on human or natural dominance [J]. Annual Review of Environment and Resources, 2004, 29: 69-107.
[3] SMITH D R, FLEGAL A R. Lead in the biosphere: Recent trends [J]. AMBIO, 1995, 24(1): 21-23.
[4] HE K M, WANG S Q, ZHANG J L. Blood lead levels of children and its trend in China [J]. Science of the Total Environment, 2009, 407(13): 3986-3993.
[5] NAS/NRC (National academy of sciences/national research council). Risk assessment in the federal government: Managing the process [M]. Washington, DC: National Academy Press, 1983.
[6] LI Z Y, MA Z W, KUIJP T J, YUAN Z W, HUANG L. A review of soil heavy metal pollution from mines in China: Pollution and health risk assessment [J]. Science of the Total Environment, 2014, 468-469: 843-853.
[7] LIU G N, YU Y J, HOU J, XUE W, LIU X, LIU Y Z, WANG W H, ALSAEDI A, HAYAT T, LIU Z T. An ecological risk assessment of heavy metal pollution of the agricultural ecosystem near a lead-acid battery factory [J]. Ecological Indicators, 2014, 47: 210-218.
[8] EPA U S. Framework for ecological risk assessment [EB/OD]. 2014-03-03. http://www.epa.gov/raf/publications/pdfs/FRMWRK_ ERA.PDF.
[9] LIU Jin-ling, WU Hao, FENG Jiang-xiang, LI Zheng-jie, LIN Guang-hui. Heavy metal contamination and ecological risk assessments in the sediments and zoobenthos of selected mangrove ecosystems, South China [J]. Catena, 2014, 119: 136-142.
[10] EL-SAID G F, YOUSSEF D H. Ecotoxicological impact assessment of some heavy metals and their distribution in some fractions of mangrove sediments from Red Sea, Egypt [J]. Environmental Monitoring and Assessment, 2013, 185: 393-404.
[11] LUO W, LU Y L, WANG T Y, HU W Y, JIAO W T, NAILE J E, KHIM J S, GIESY J P. Ecological risk assessment of arsenic and metals in sediments of coastal areas of northern Bohai and Yellow Seas, China [J]. AMBIO, 2010, 39: 367-375.
[12] MAO J S, CAO J, GRAEDEL T E. Losses to the environment from the multilevel cycle of anthropogenic lead [J]. Environmental Pollution, 2009, 157: 2670-2677.
[13] Green media toolshed, scorecard: The pollution information site [EB/OD]. 2013-12-11. http://scorecard.goodguide.com/chemical- profiles/
[14] LIANG Jing, MAO Jian-su. A dynamic analysis of Environmental losses from anthropogenic lead flow and their accumulation in China [J]. Transactions of Nonferrous Metals Society of China, 2014, 24(4): 1125-1133.
[15] LIANG Jing, MAO Jian-su. Speciation analysis of lead losses from anthropogenic flow in China [J]. Environmental Science, 2014, 35(3): 1191-1197. (in Chinese)
[16] LUO Yi. China statistical report on environment in 2010 [M]. 1st ed. Beijing: China Environmental Science Press, 2011. (in Chinese)
[17] National bureau of statistics of PRC, ministry of environmental protection of PRC. China statistical yearbook on environment [M]. Beijing: China Statistics Press, 2011.
[18] DENG Shuang, ZHANG Fan, LIU Yu, SHI Ying-jie, WANG Hong-mei, ZHANG Chen, WANG Xiang-feng, CAO Qing. Lead emission and speciation of coal-fired power plants in China [J]. China Environmental Science, 2013, 33(7): 1199-1206. (in Chinese)
[19]  Migration and speciation of lead in a river system heavily polluted from a smelter [J]. Water Research, 1985, 19(1): 1-6.
[20] MA Liang, XU Ren-kou, JIANG Jun. Adsorption and desorption of Cu (II) and Pb (II) in paddy soils cultivated for various years in the subtropical China [J]. Journal of Environmental Science, 2010, 22(5): 689-695.
[21] RENBERG I, BRANNVALL M, BINDLER R, EMTERYD O. Atmospheric lead pollution history during four millennia (2000 BC to 2000 AD) in Sweden [J]. AMBIO, 2000, 29(3): 150-156.
[22] UNEP (United nations environment programme). Final review of scientific information on lead [EB/OD]. 2013-12-11. http://www. unep.org/chemicalsandwaste/Portals/9/Lead_Cadmium/docs/Interim_reviews/UNEP_GC26_INF_11_Add_1_Final_UNEP_Lead_review_and_apppendix_Dec_2010.pdf
[23] EPA U S. Estimation of relative bioavailability of lead in soil and soil-like materials using in vivo and in vitro methods [EB/OD]. 2013-12-11. http://www.epa.gov/superfund/bioavailability/lead_tsd _main.pdf
[24] CHEN L G, XU Z C, LIU M, HUANG Y M, FAN R F, SU Y H, HU G C, PENG X W, PENG X C. Lead exposure assessment from study near a lead-acid battery factory in China [J]. Science of the Total Environment, 2012, 429: 191-198.
[25] EPA U S. Dermal exposure assessment: Principles and applications [EB/OD]. 2013-12-11. http://rais.ornl.gov/documents/DERM_EXP. PDF
[26] GU Chuan-ling, WANG Jun-ping, WANG Shuo. Exposure assessment for heavy metals in drinking water [J]. Science and Technology of Food Industry, 2011, 32(11): 374-376. (in Chinese)
[27] EPA U S. Wildlife exposure factors handbook [EB/OD]. 2013-12-11. http://ofmpub.epa.gov/eims/eimscomm.getfile?p_download_id=489605
[28] Nordic Council of Ministers. Dangerous for the environment: List of chemicals [EB/OD]. 2013-11-09. http://scorecard.goodguide.com/ chemical-groups/one-list.tcl?short_list_name=dfe
[29] National Institute for Occupational Safety and Health. International chemical safety card [EB/OD]. 2013-12-26. http://www.cdc.gov/ niosh/ipcsneng/neng1001.html
ǦԪ����Ϊѭ���ͷ���ķ�������
�� �������
����ʦ����ѧ ����ѧԺ ����ģ������Ⱦ���ƹ����ص�����ʵ���ң����� 100875
ժ Ҫ����չ��Դͷ�ͷŵ����ղ���ȫ���̵����ۿ���Чָ��Ǧ��Ⱦ�Ŀ��ơ�ͨ�����������ͷ���Դͷ���������̡���¶;��������ֵ�����Ǧ�������۵�ģ�ͣ�����Ϊѭ����ǦԴͷ�ͷ���Ľ������ա���̬���ռ��ۺϷ��ս������ۡ�����ϵ������ֵ������Ǧ�ͷ����ڻ�����˥���ͱ�¶ˮƽ�����������2010���й���������1887 tǦ�ͷ���(����ǰ���о����)����������˥���ͱ�¶���̺��γɽ������յ�Ǧ�ͷ�����Ϊ1.3 t(�˾�ˮƽΪ0.9 mg/ca)�������γ���̬���յ�Ǧ�ͷ�����Ϊ2.7 t��Ǧ�ͷŵ�Դͷ������ʹ�ýΣ��������ķ�����Ҫ�����ڷ����������սκ������Ρ�����̬������������������������̬ΪPbO����PbSO4Ϊ�����̬�������Ļ����Ǧ�ͷ����е�PbSO4��PbO��Pb��̬�����µķ���ռ�ܷ��յ�71%���ڷ��չ�����Ӧ��ע��������̬��
�ؼ��ʣ�Ǧ��Դͷ���������գ���̬���գ��ۺϷ��գ���������
(Edited by Mu-lan QIN)
Foundation item: Project (41171361) supported by the National Natural Science Foundation of China
Corresponding author: Jian-su MAO; Tel: +86-10-58806369; E-mail: maojs@bnu.edu.cn
DOI: 10.1016/S1003-6326(16)64148-1
