Modeling and experimental verification of tubular product formation during spray forming
来源期刊:中国有色金属学报(英文版)2009年第3期
论文作者:LIU Dong-ming 赵九洲 李木森
文章页码:661 - 667
Key words:spray forming; tube; shape evolution; modeling; processing parameter
Abstract: A mathematical model is formulated to predict the shape evolution and the final geometry of a tubular product prepared by spray forming. The effects of several important processing parameters on the shape evolution of the tube are investigated. The model is validated against experiments of spray formed large diameter tubes. The experimental and the modeling results show that there are three distinct regions in the preform, i.e., the left transition region, the middle uniform diameter region and the right transition region. The results show that the atomization parameters as and bs, traversing speed v of the substrate, the outer diameter D0 of the substrate, and the initial deposition distance d0 play important roles in the contour and the wall thickness of the spray formed tube. But the angular velocity ω of the substrate has little effect on the buildup of the deposit. After a certain time from the beginning of the process, the deposit will come into a steady growth state. In addition, an equation is provided to estimate the wall thickness of the deposit under the steady growth state based on the mass conservation.
基金信息:the Grant for New Teachers from the PhD Programs Foundation of the Ministry of Education of China
China Postdoctoral Science Foundation

LIU Dong-ming(刘东明)1, 2, ZHAO Jiu-zhou(赵九洲)3, LI Mu-sen(李木森)1, 2
1. Key Laboratory of Liquid Structure and Heredity of Materials of Ministry of Education, Shandong University,
Ji’nan 250061, China;
2. School of Materials Science and Engineering, Shandong University, Ji’nan 250061, China;
3. Institute of Metal Research, Chinese Academy of Sciences, Shenyang 110016, China
Received 16 September 2008; accepted 3 February 2009
Abstract: A mathematical model is formulated to predict the shape evolution and the final geometry of a tubular product prepared by spray forming. The effects of several important processing parameters on the shape evolution of the tube are investigated. The model is validated against experiments of spray formed large diameter tubes. The experimental and the modeling results show that there are three distinct regions in the preform, i.e., the left transition region, the middle uniform diameter region and the right transition region. The results show that the atomization parameters as and bs, traversing speed v of the substrate, the outer diameter D0 of the substrate, and the initial deposition distance d0 play important roles in the contour and the wall thickness of the spray formed tube. But the angular velocity ω of the substrate has little effect on the buildup of the deposit. After a certain time from the beginning of the process, the deposit will come into a steady growth state. In addition, an equation is provided to estimate the wall thickness of the deposit under the steady growth state based on the mass conservation.
Key words: spray forming; tube; shape evolution; modeling; processing parameter
1 Introduction
During spray forming, a liquid metal stream is disintegrated into a spray of droplets by high-pressure gas jets and the droplets are subsequently propelled toward a substrate where they impinge on and consolidate to form a deposit. By properly controlling the processing parameters, the near net shape products, such as strip, plate, tube, roll and cylinder, can be produced [1-4]. Spray forming possesses the advantage of rapid solidification and thus can provide alloys with refined microstructure, extended solubility of alloying elements and reduced segregation[5-8]. In addition, a comparison of the technologies for manufacture of large diameter pipe, bimetallic tube, and bimetallic roll, shows that spray forming can lower the cost of the products by reducing the number of processing steps, or can be used to make new products not viable by conventional methods[9]. But exploring the optimal processing parameters by experimentation is usually time- consuming and not economical. Numerical modeling, therefore, has been conducted to predict the shape evolution, heat flow and solidification as well as porosity distribution of the tubular products prepared by spray forming, providing significant insight into and quantitative guidance for the optimization of the process [10-13].
However, in the previous work modeling the buildup of the tubular preform, the growth rate of an arbitrary point on the substrate and the subsequent preform is the one parallel to the spray axis. In fact, the growth direction, i.e., the normal vector of the point, is seldom parallel to the spray axis in most circumstances. The growth rate is fundamental to an accurate prediction of the shape evolution which is crucial to calculate the heat transfer precisely of a tubular preform during spray forming. Thus, further improvement of the present models is needed to meet the requirement for attaining near-net shape products and accurate controlling the process.
In this work, a model, in which the deposition rate is corrected, is developed to predict the shape evolution of the tubular product prepared by spray forming. Based on the numerical results, the effects of the main processing parameters on the shape evolution of the deposit are investigated. In addition, an equation is provided to estimate the wall thickness of the tubular products under the steady growth state based on the mass conservation, which may be helpful to accelerating the optimization of the process.
2 Model formation
During the spray forming process, the distribution of the droplet flow rate![]() in a plane perpendicular to the spray axis satisfies the Gaussian function[14] as
in a plane perpendicular to the spray axis satisfies the Gaussian function[14] as
![]() (1)
(1)
where r is the distance between a point and the spray axis (see Fig.1); a1 (mm?s-1) and b1 (mm-2) are the maximum deposition rate and the spray distribution coefficient in the plane, respectively. They change with the distance (d1) from the atomizer to the plane according to Refs.[15-16]
![]() (2)
(2)
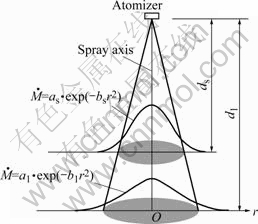
Fig.1 Schematic illustration of spatial distribution of droplet flow rate during spray forming
where ds is the distance from the atomizer to the reference plane; as and bs, which are associated with the configuration of the atomizer, the diameter of the metal melt delivery nozzle, the gas pressure[17] as well as the alloy, are the maximum deposition rate and the spray distribution coefficient in the reference plane, respectively. They are determined by experiments.
When the spray forming technology is used to fabricate a tubular product, the droplets are deposited onto a rotating mandrel substrate that is traversing horizontally meanwhile. If a metal tube or rod bar is used as the substrate, a bimetallic tube or roll will be produced (as shown in Fig.2). In this work, a tubular substrate is employed. For convenience, in the modeling process, we assume the substrate is fixed, and the atomizer rotates around the substrate and moves in the reverse direction of the substrate simultaneously.
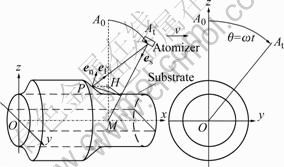
Fig.2 Schematic illustration of spray forming process for production of tube in the present model
In the previous model for modeling the shape evolution of tubes during spray forming, the growth rate (G) of a generic point P on the surface of the billet is usually calculated by equation in Refs.[10,12]:
![]() (3)
(3)
where x is the shadowing coefficient; SE is the sticking efficiency; ![]() is the droplet flow rate in the plane perpendicular to the spray axis, whose calculation methods may be different in different models. It should be noted that the growth direction in Eq.(3) is parallel to the spray axis, i.e., the axis of the atomizer, in which the point has the largest growth rate in comparison with other directions. In general, the growth direction of a point, which is usually supposed as its normal direction, might be inclined to the spray axis at any angle. Therefore, in the present model, an factor en・ef/(es・ef) is introduced to convert the growth rate from the spray axis direction into the normal direction of the point[16], i.e.,
is the droplet flow rate in the plane perpendicular to the spray axis, whose calculation methods may be different in different models. It should be noted that the growth direction in Eq.(3) is parallel to the spray axis, i.e., the axis of the atomizer, in which the point has the largest growth rate in comparison with other directions. In general, the growth direction of a point, which is usually supposed as its normal direction, might be inclined to the spray axis at any angle. Therefore, in the present model, an factor en・ef/(es・ef) is introduced to convert the growth rate from the spray axis direction into the normal direction of the point[16], i.e.,
![]() (4)
(4)
where en is the unit normal vector of the point P; es is the unit vector of the spray axis; ef is the unit vector of the line PAt with point A0 and At denoting the positions of the atomizer at time 0 and time t, respectively. In this work, SE is taken as unity and x is calculated by
![]() (5)
(5)
In a time interval from time t to t+Dt, the deposited height in the direction normal to the surface (en in Fig.2) can be estimated by
![]() (6)
(6)
Assuming that (x, y, z) represent the coordinates of the point P at time t, the new position (xnew, ynew, znew) of the point at time t+Dt can be calculated as
 (7)
(7)
where ex, ey and ez are the unit positive vectors of the x-axis, y-axis and z-axis, respectively.
In addition, in the following calculation, the position of the atomizer is (100, 0, z) at time t=0. The z-coordinate is not fixed because different size substrates are employed in the simulation.
3 Experimental procedures
The nominal compositions of the alloy used in the present study were (in mass fraction): 12%Zn, 2%Cu, 2%Mg and Al(Bal.). In order to determine as and bs, the alloy was melted and superheated to 800 ℃ in the induction furnace. The melt was then delivered to an atomizer where it was broken into droplets by nitrogen gas at a pressure of 0.8 MPa. Following the atomization, the droplets were deposited on a plane which was located at 400 mm under the atomizer. The spray parameters as and bs under these conditions were 2.36 mm/s and 0.000 5 mm-2, respectively.
To manufacture a tube, about 20 kg of the alloy was melted and deposited on the tubular substrate under the conditions that the melt temperature was 800 ℃, the atomization gas pressure was 0.8 MPa, the traversing velocity(v) of the substrate tube was 1.8 mm/s, the initial deposition distance(d0) was 400 mm, the outer diameter (D0) of the substrate tube was 180 mm, and the angular velocity(w) of the substrate tube was 360 (?)/s.
4 Experimental and numerical results
4.1 Comparison of modeling and experimental results
Fig.3(a) shows the picture of the tubes prepared by spray forming. The comparison between the modeling result and the experimental one (the front in Fig.3(a)) is shown in Fig.3(b), which indicates that they agree well with each other. Moreover, it is apparent that there are three distinct regions in the tube, i.e., the left transition region, the middle uniform diameter region and the right transition region.
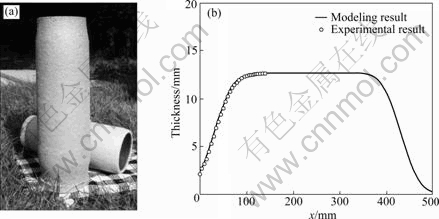
Fig.3 Tubes prepared by spray forming (a) and comparison between modeling result and experimental one (b)
4.2 Effects of atomization parameters as and bs on shape of deposit
Fig.4 demonstrates the effect of the as on the shapes of tube after 300 s when the perform has involved in the stable growth. It is apparent that increasing as, meaning that raising the amount of the droplets deposited on the substrate as πas/bs is equal to the melt flow rate [15], will lead to an increase in the wall thickness of the tube if other parameters are assumed unchangeable.
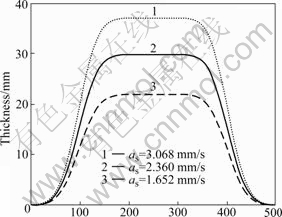
Fig.4 Calculated wall thickness of tube at different maximum deposition rate as in reference plane (bs=0.000 5 mm-2, ds=400 mm, v=1.0 mm/s, d0=400 mm, D0=120 mm, w=360 (?)/s, t= 300 s)
Fig.5 reveals the spay distribution parameter bs on the shape evolution of the deposit when the melt flow rate πas/bs is a constant. bs is a parameter denoting the spreading characteristics of the spray. A larger value of bs, indicating a narrower spray and most of the droplets distribute around the spay axis, results in a steeper inclination of the left- and the right-transition region. On the other hand, an over-wide distribution of the droplets gives rise to extra overspray of the droplets, and thus a reduced wall thickness in the middle region, such as the case that bs=0.000 5 mm-2 in Fig.5. In addition, it also causes longer transition regions in both sides. Under the circumstance that bs is large enough, the difference of the thickness in the middle region is negligible, as the cases bs=0.000 8 and bs=0.001 2 mm-2 in Fig.5.
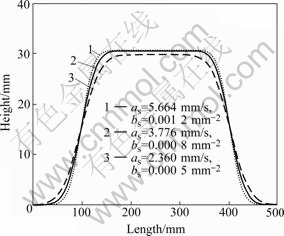
Fig.5 Calculated wall thickness of tube at different spray distribution coefficients in reference plane with constant as/bs (4 720 mm3/s) (ds=400 mm, v=1.0 mm/s, d0=400 mm, D0= 120 mm, w=360 (?)/s, t=300 s)
4.3 Effect of traversing speed v on shape of deposit
Fig.6 shows the effect of the traversing speed v on the wall thickness of the deposit. For a given set of processing parameters, the higher traversing speed results in a thinner tube.
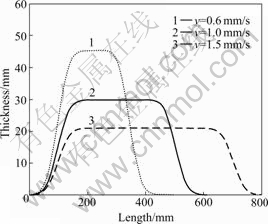
Fig.6 Calculated wall thickness of tube at different traversing speed v of substrate (as=2.360 mm/s, bs=0.000 5 mm-2, ds=400 mm, d0=400 mm, D0=120 mm, w=360 (?)/s, t=400 s)
4.4 Effect of outer diameter of substrate on wall thickness of deposit
The effect of the outer diameter(D0) of the substrate on the wall thickness of the deposit is shown in Fig.7. On one hand, a larger D0 will be helpful to reducing the overspray to some extent, especially in the case that a smaller bs is employed in an atomizer. On the other hand, a larger D0 will result in additional deposit surface. Because the latter is dominant, a larger D0 leads to a thinner wall thickness.
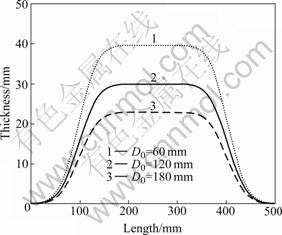
Fig.7 Calculated wall thickness of tube at different outer diameter D0 of substrate (as=2.360 mm/s, bs=0.000 5 mm-2, ds= 400 mm, v=1.0 mm/s, d0=400 mm, w=360 (?)/s, t=300 s)
4.5 Effect of initial deposition distance on shape of deposit
Decrease of the initial deposition distance will result in a reduction in overspray and thus a slight increase in the wall thickness of the deposit under steady growth state (Fig.8). For instance, the wall thickness of the deposit decreases from 30.4 mm to 28.6 mm when the initial deposition distance(d0) increases from 300 mm to 500 mm. In fact, the initial deposition distance plays an important role in the spray forming process as it influences the thermal behaviors of the droplets[18] as well as the spray cone[19], which further affects the microstructures and properties of the deposit. The selection of initial deposition distance is usually based on experimental and modeling results.
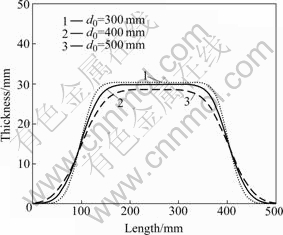
Fig.8 Calculated wall thickness of tube at different initial deposition distance d0 (as=2.360 mm/s, bs=0.000 5mm-2, ds=400 mm, v=1.0 mm/s, , D0=120 mm, w=360 (?)/s, t=300 s)
4.6 Effect of angular velocity of substrate on wall thickness of deposit
The angular velocity(w) of the substrate tube has little effect on the shape of the deposit if it is not extremely slow or fast as shown in Fig.9.
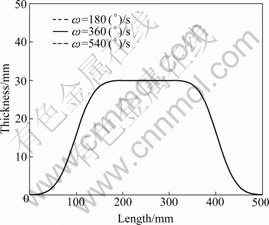
Fig.9 Calculated wall thickness of tube at different angular velocity w of substrate (as=2.360 mm/s, bs=0.000 5mm-2, ds= 400 mm, v=1.0 mm/s, d0=400 mm, D0=120 mm, t=400 s)
5 Discussion
5.1 Growth behaviors of arbitrary point on substrate
An average growth rate ![]() is introduced to describe the growth rate change of an arbitrary point on the substrate and the subsequent preform, which is defined as
is introduced to describe the growth rate change of an arbitrary point on the substrate and the subsequent preform, which is defined as
![]() (8)
(8)
where T=2π/ω is the rotation period of the substrate, and n is a positive integer.
During spray forming operation, the shape evolution of the tubular preform is closely associated with the growth rate and directions of the points on the preform. In order to trace the growth process of an arbitrary point, the average growth rates as well as the displacements in both x direction and y direction of some points are recorded during computation. For instance, the ![]() and the displacement of the point, whose initial coordinates are (210, 0, 60), are shown in Fig.10. This point has a near-zero growth rate at the early stage of the process. Then the growth rate shows a rapid increase trend and reaches its maximum value at the time interval between 100 s and 120 s; after that, it drops to near zero again. On the basis of the present formation, the growth rate at any point is mainly dependent on the distance(r) between the point and the spray axis. So, it is easy to understand the change in the growth rates at this point. It grows faster when it is close to the atomizer; accordingly, the displacement changes quickly while the deposit rate and the displacement is negligible when r is large enough. The growth characteristics of this point are a representative of all the points on the substrate. In general, all points have similar growth features since the substrate and the subsequent preform are symmetrical.
and the displacement of the point, whose initial coordinates are (210, 0, 60), are shown in Fig.10. This point has a near-zero growth rate at the early stage of the process. Then the growth rate shows a rapid increase trend and reaches its maximum value at the time interval between 100 s and 120 s; after that, it drops to near zero again. On the basis of the present formation, the growth rate at any point is mainly dependent on the distance(r) between the point and the spray axis. So, it is easy to understand the change in the growth rates at this point. It grows faster when it is close to the atomizer; accordingly, the displacement changes quickly while the deposit rate and the displacement is negligible when r is large enough. The growth characteristics of this point are a representative of all the points on the substrate. In general, all points have similar growth features since the substrate and the subsequent preform are symmetrical.
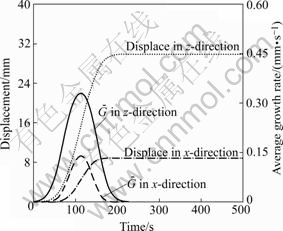
Fig.10 Displacement of point with initial coordinates of (210, 0, 60) vs time under conditions of as=2.360 mm/s, bs=0.000 5 mm-2, ds=400 mm, v=1.0 mm/s, d0=400 mm, D0=120 mm, w= 360 (?)/s
5.2 Shape evolution of deposit during spray forming
Fig.11 shows the calculated wall thickness of the tubular preform during spray forming. With the progression of the process, the wall thickness of the deposit increases from zero to its maximum value, and thereafter involves a steady growth state and the right surface of the deposit moves at the same speed as the traversing velocity of the substrate.
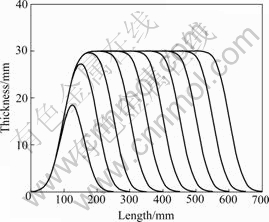
Fig.11 Calculated wall thickness of tube during spray forming under conditions of as=2.360 mm/s, bs=0.000 5 mm-2, ds=400 mm, v=1.0 mm/s, d0=400 mm, D0=120 mm, w=360 (?)/s, Δt= 50 s
The wall thickness of the tube under the steady growth state can be estimated by the conservation of the mass. Neglecting the difference of the volume between the solid and the melt during solidification, one can get
![]() (9)
(9)
where D and D0 are the outer diameters of the growing
deposit and the substrate, respectively; Y is the deposition efficiency under the steady growth stage. The right side describes the volume of the alloy consolidated on the deposit and the left one is the volume change of the deposit in a very short time interval dt. Then, the wall thickness of the preform in the middle uniform diameter region can be expressed as
![]() (10)
(10)
5.3 Comparison between modeling result calculated by Eq.(3) and that by Eq.(4)
Fig.12 shows the tubular contours of preform calculated by Eq.(3) and by Eq.(4), respectively, when same parameters are applied. The wall thickness in the middle uniform diameter region of the former is 36.7 mm while that of the latter is 29.9 mm owing to that en・ef/(es・ef) is a factor not larger than 1. Nonetheless, the maximum value of the thickness calculated by Eq.(10) is 31.2 mm (y=1). Therefore, some errors appear when Eq.(3) is used to calculate the shape evolution of a preform prepared by spray forming and it is necessary to correct the growth rate equation. After the amendment, the model is more accurate.

Fig.12 Comparison between tubular preform calculated by Eq.(3) and that by Eq.(4) under conditions of as=2.36 mm/s, bs=0.000 5 mm-2, ds=400 mm, v=1.0 mm/s, d0=400 mm, D0= 120 mm, w=360 (?)/s
6 Conclusions
1) A model is established to describe the shape evolution of the tubular product during spray forming. The measured profiles of the spray-formed tube are in good agreement with the calculated data from the mathematical model. Both the experimental and the modeling results show that there are three distinct regions in the preform, i.e., the left transition region, the middle uniform diameter region and the right transition region.
2) The atomization parameters as and bs, the traversing speed(v) of the substrate, the outer diameter (D0) of the substrate, and the initial deposition distance (d0) play important roles in the contour and the wall thickness of the tube prepared by spray forming. But the angular velocity (w) of the substrate tube has little effect on the buildup of the deposit unless it is extremely slow or fast.
3) After a certain time from the beginning of the spray forming, the deposit will enter a steady growth state. The wall thickness of the tubular deposit under steady state can be estimated by w= ![]()
References
[1] YUAN Wu-hua, CHEN Zhen-hua, HUANG Pei-yun. Preparation of heat-resistant aluminum alloy pipe blanks by multilayer spray deposition [J]. Trans Nonferrous Met Soc China, 2000, 10(4): 460-464.
[2] LIU Dong-ming, ZHAO Jiu-zhou, YE Heng-qiang. Modeling of the shape evolution of the rod-billet and optimization of the processing parameters in spray forming [J]. Acta Metallurgica Sinica, 2004, 40(8): 873-881. (in Chinese)
[3] LIN Y J, FENG W, BOBROW J E, LAVERNIA E J. Modeling of spray-formed plate using an X-Y moving substrate [J]. Mater Trans, 2001, 32A: 831-840.
[4] WANG Zi-xing, ZHANG Yong-an, ZHU Bao-hong, LIU Hong-wei, WANG Feng, XIONG Bai-qing. Tensile and high-cycle fatigue properties of spray formed A110.8Zn2.9Mg1.9Cu alloys after two-stage aging treatment [J]. Trans Nonferrous Met Soc China, 2006, 16(4): 808-812.
[5] KANG Fu-wei, ZHANG Guo-qing, LI Zhou, SUN Jian-fei. Hot deformation of spray formed nickel-base superalloy using processing maps [J]. Trans Nonferrous Met Soc China, 2008, 18(3): 531-535.
[6] XIAO Yu-de, WANG Wei, LI Wen-xian. High temperature deformation behavior and mechanism of spray deposited Al-Fe-V-Si alloy [J]. Trans Nonferrous Met Soc China, 2007, 17(6): 1175-1180.
[7] WANG Xiao-feng, ZHAO Jiu-zhou, HE Jie, HU Zhuang-qi. Hot rolling characteristics of spray-formed AZ91 magnesium alloy [J]. Trans Nonferrous Met Soc China, 2007, 17(2): 238-243.
[8] YANG B, WANG F, ZHANG J S. Microstructural characterization of in situ TiC/Al and TiC/Al-20Si-5Fe-3Cu-1Mg composites prepared by spray deposition [J]. Acta Materialia, 2003, 51(17): 4977-4989.
[9] CHESNEY P F, MASCOLINO J J. Markets and opportunities for tubular and bimetallic spray formed products [J]. Powder Metallurgy, 1997, 40(1): 31-33.
[10] CUI Cheng-song, FRITSCHING U, SCHULZ A, LI Qing-chun. Mathematical modeling of spray forming process of tubular preforms: Part 1. Shape evolution [J]. Acta Materialia, 2005, 53(9): 2765-2774.
[11] CUI Cheng-song, FRITSCHING U, SCHULZ A, LI Qing-chun. Mathematical modeling of spray forming process of tubular preforms: Part 2. Heat transfer [J]. Acta Materialia, 2005, 53(9): 2775-2784.
[12] MI J, GRANT P S. Modelling the shape and thermal dynamics of Ni superalloy rings during spray forming. Part 1: Shape modeling―Droplet deposition, splashing and redeposition [J]. Acta Materialia, 2008, 56(7): 1588-1596.
[13] MI J, GRANT P S. Modelling the shape and thermal dynamics of Ni superalloy rings during spray forming. Part 2: Thermal modeling―Heat flow and solidification [J]. Acta Materialia, 2008, 56(7): 1597-1608.
[14] MATHUR P, APELIAN D, LAWLEY A. Analysis of the spray deposition process [J]. Acta Metallurgica, 1989, 37: 429-443.
[15] SEOK H K, YEO D H, OH K H, LEE H I, RA H Y. A three-dimensional model of the spray forming method [J]. Metall Mater Trans, 1998, 29B: 699-708.
[16] LIN Y J, BOBROW J E, WHITE D R, LAVERNIA E J. Modeling of spray-formed materials: Geometrical considerations [J]. Metall Mater Trans, 2000, 31A: 2917-2929.
[17] XU Q, CHENG D, TRAPAGA G, LAVERNIA E J. Fundamental fluid dynamics during liquid metal atomization [C]// COOPER K P, ANDERSON I E, RIDDER S D, BIANCANIELLO F S. Liquid Metal Atomization and Fundamentals and Practice. Warrendale: Minerals, Metals & Materials Society, 2000: 37-60.
[18] LIU D M, ZHAO J Z, YE H Q. Modeling of the solidification of gas-atomized alloy droplets during spray forming [J]. Mater Sci Eng A, 2004, 372(1/2): 229-234.
[19] GRANT P S, CANTOR B, KATGERMAN L. Modelling of droplet dynamic and thermal histories during spray forming―II. Effect of process parameters [J]. Acta Metall Mater, 1993, 41(11): 3109-3118.
Foundation item: Project(20070422009) supported by the Grant for New Teachers from the PhD Programs Foundation of the Ministry of Education of China; Project(20080441133) supported by China Postdoctoral Science Foundation
Corresponding author: LIU Dong-ming; Tel: +86-531-88395614; E-mail: dongmingliu@sdu.edu.cn
DOI: 10.1016/S1003-6326(08)60330-1
(Edited by YANG Hua)

