Capacity-based performance measurements for loading equipment in open pit mines
来源期刊:中南大学学报(英文版)2019年第6期
论文作者:Amin MONIRI-MORAD Mohammad POURGOL-MOHAMMAD Hamid AGHABABAEI Javad SATTARVAND
文章页码:1672 - 1686
Key words:capacity; performance; maintainability; mining equipment; risk assessment
Abstract: The purpose of this study is to develop an integrated framework for capacity analysis to address the influence of systematic hazardous factors on the haulage fleet nominal capacity. The proposed model was made to capture unexpected risks for mining equipment based upon data-driven method considering different scenarios. Probabilistic risk assessment (PRA) was employed to quantify the loss of production capacity by focusing on severity of failure incidents and maintainability measurements. Discrete-event simulation was configured to characterize the nominal capacity for mining operation. Accordingly, the system capacity was analyzed through the comparison of nominal and actual capacity. A case study was completed to validate the research methodology. The past operation and maintenance field data were collected for shovel operation. The discrete-event simulation was developed to estimate the rate of shovel nominal capacity. Then, the effects of undesirable scenarios were assessed by developing the PRA approach. The research results provide significant insights into how to enhance the production capacity in mines. The analyst gets a well judgment for the crucial elements dealing with high risk levels. A holistic maintenance plan can be developed to mitigate and control the losses.
Cite this article as: Amin MONIRI-MORAD, Mohammad POURGOL-MOHAMMAD, Hamid AGHABABAEI, Javad SATTARVAND. Capacity-based performance measurements for loading equipment in open pit mines [J]. Journal of Central South University, 2019, 26(6): 1672-1686. DOI: https://doi.org/10.1007/s11771-019-4124-5.

ARTICLE
J. Cent. South Univ. (2019) 26: 1672-1686
DOI: https://doi.org/10.1007/s11771-019-4124-5

Amin MONIRI-MORAD1, Mohammad POURGOL-MOHAMMAD2,Hamid AGHABABAEI1, Javad SATTARVAND3
1. Department of Mining Engineering, Sahand University of Technology, Tabriz 51335-1996, Iran;
2. Department of Mechanical Engineering, Sahand University of Technology, Tabriz 51335-1996, Iran;
3. Department of Mining and Metallurgical Engineering, University of Nevada, Reno 89557, United States
 Central South University Press and Springer-Verlag GmbH Germany, part of Springer Nature 2019
Abstract: The purpose of this study is to develop an integrated framework for capacity analysis to address the influence of systematic hazardous factors on the haulage fleet nominal capacity. The proposed model was made to capture unexpected risks for mining equipment based upon data-driven method considering different scenarios. Probabilistic risk assessment (PRA) was employed to quantify the loss of production capacity by focusing on severity of failure incidents and maintainability measurements. Discrete-event simulation was configured to characterize the nominal capacity for mining operation. Accordingly, the system capacity was analyzed through the comparison of nominal and actual capacity. A case study was completed to validate the research methodology. The past operation and maintenance field data were collected for shovel operation. The discrete-event simulation was developed to estimate the rate of shovel nominal capacity. Then, the effects of undesirable scenarios were assessed by developing the PRA approach. The research results provide significant insights into how to enhance the production capacity in mines. The analyst gets a well judgment for the crucial elements dealing with high risk levels. A holistic maintenance plan can be developed to mitigate and control the losses.
Key words: capacity; performance; maintainability; mining equipment; risk assessment
Cite this article as: Amin MONIRI-MORAD, Mohammad POURGOL-MOHAMMAD, Hamid AGHABABAEI, Javad SATTARVAND. Capacity-based performance measurements for loading equipment in open pit mines [J]. Journal of Central South University, 2019, 26(6): 1672-1686. DOI: https://doi.org/10.1007/s11771-019-4124-5.
1 Introduction
Commonly, mining machineries are considered as one of the most important elements in mining industries and particularly material production processes. Nowadays, these become more complex and expensive assets in which they require delicate maintenance. Loading and hauling equipment play a crucial role in material production process and operating costs. Therefore, inaccessibility and maintenance actions such as technical surveys, preventive and corrective maintenance have a direct effect on the fleet target capacity in open pit mines. Accordingly, investigation is viable for the failures of equipment and risk assessment of operation interruptions.
Different researches have been developed for assessment and analysis of the risk in mining industry. They are associated with qualitative and quantitative risk methods. However, the majority are devoted to human safety and health issues. Limited attention has been paid to the investigation of production capacity risk during mining processes. Literature survey is composed of three categories in this paper. In the first category, the capacity modeling is presented for both surface and underground cases. In the second category, mining hazards and risk analysis are described for mining equipment and operations. The mining equipment failures and reliability modeling are denoted in the third category. WOLSTENHOLME et al [1] conducted a research about capacity modeling in underground coal mines. The authors attempted to model the dynamic behavior for the mine production system. Thus, stochastic events (e.g., hardness of the coal, roof and floor conditions, operator skills, storage bunkers states (full or empty), operation breakdowns and inappropriate production planning) were investigated to address their impacts on the material production rate. To deal with this, operation cycles were formulated for the mine activities using proper distribution functions. Thus, the output rates were estimated for the working faces. Another research was developed by SONTAMINO et al [2] for the mine production planning system in open pit mines. In this study, a system dynamics model was made to analyze the influence of mine variables on the optimal number and size of the equipment. Some of the variables were involved in production rate, amount and quality of reserves, recovery, digging rates, truck speeds, distances, investments and net cash flows. In addition, BARABADI et al [3] have developed a research in the area of capacity analysis considering failure rate and environmental conditions for open pit mining equipment. The paper demonstrated that the equipment throughput is influenced by the system characteristics (i.e., reliability and material) and the conditional environment (i.e., temperature and dust). In the study, the effect of mine geology (different mining regions) was investigated on the equipment failure rate by using proportional hazard model (PHM). Several studies were conducted to assess the risk assessment for the mining sectors. MD-NOR et al [4] evaluated the risk of fatal incidents dealing with loaders and dozers in US mining industry. The preliminary hazard assessment (PHA) technique was employed to identify and quantify the risk scenarios. The historical data were collected from US mine safety and health administration (MSHA) reports. The results revealed that the hazards of mechanical/ electrical/ hydraulics components of the loaders were the most severe and with frequent hazards (high-risk components). For the dozers, the failure fell into the high-risk category, due to adverse site/geological conditions. PAITHANKAR [5] investigated different hazards of the mining industry to assess their risks. In this project, hazard identification and risk analysis were performed for iron and coal mines. Various mining activities were categorized into three levels of risk (high, medium and low risks) with regard to their likelihood and consequences. Consequently, for the iron mine, the face stability and person blasting the shots were the high-risk activities. Whereas, the high risk issues were fly rocks, inrushes of water into the mine and inappropriate haulage roads in the coal mine. According to the study outcomes, the number of high-risk problems were specified in the coal mine more than the iron mine. Another paper described machine-related injuries and fatalities, which occurred in United States [6]. Analyzing the existing database revealed that the machine-related accidents were accounted to around 41% of all the severe accidents. The machineries dealing with the incidents were conveyors, rock bolting equipment, mill and haul equipment. The most common accidents occurred during the machine operation and repair activities. To mitigate the accidents, the research recommended utilization of new control technologies, training materials and dissemination of information. In the field of failure and reliability modeling, a research was carried out by ROY [7]. The evaluation was applied for a fleet of electric rope shovel. In the paper, failure and repair data were recorded for four shovels to determine their reliability and maintainability characteristics by decomposing the system into different sub-systems. Results revealed that the reliability of all shovels dropped below 50% after 24 operation hours. So, maintenance intervals such as servicing, replacement and preventive maintenance were calculated based on various reliability levels. Moreover, researchers such as SAMANTA et al [8], and PATNAYAK et al [9], worked in the area of shovel reliability.
This paper is aimed to integrate the risk assessment with the haulage fleet operation in order to investigate the impact of systematic risk factors on the productivity. The paper focuses on challenges of modeling the equipment failure behavior and maintainability for the capacity analysis. In this approach, the capacity is characterized based on severity of the failure incidents, which occur in the system. As a matter of fact, most events are frequent, with lower consequences of short repair times and low repair costs (mild events). Conversely, some events occasionally occur on the systems, whereas they spend long repair times and high maintenance costs (severe events). According to the study structure, the discrete event simulation (DES) is utilized to model the haulage fleet operation and determination of the fleet nominal capacity without capturing systematic risk examination. The PRA is developed as a quantitative risk assessment technique to evaluate the risk scenarios on the capacity analysis process. Finally, a compromise between nominal and actual capacity is carried out for the equipment. This step by step approach would be helpful for development of a maintenance strategy in order to control the system production capacity considering the crucial elements and reducing the mine operating costs.
The paper is outlined as follows. In Section 2, methodology structure and solution techniques are presented. In Section 3, a case study is extended to estimate mining fleet actual capacity. Discrete event simulation is modeled to compute the fleet nominal capacity. Afterwards, PRA is conducted to examine the impact of systematic risk scenarios on the equipment nominal capacity. Finally, research findings and discussions are described.
2 Methodology and structure of research
Nominal capacity is described as the maximum amount of material, which is potentially achieved subject to constraints (i.e., physical design, operational, time schedule limitations). However, different factors and undesirable incidents affect the nominal capacity, leading to reduction of the operational output, so-called actual capacity. Therefore, capacity analysis is considered as one of the most important metrics in mine operation so that the difference between the two kinds of capacity is determined to develop a holistic plan for the future operation. There are several factors and systematic risks affecting mine nominal capacity. The conceptual framework for capacity analysis is configured in Figure 1. The capacity analysis is initially categorized into nominal and actual capacity (Phase I). The nominal capacity is computed through the production rate of the fleet operation. The production rate is evaluated by modeling loader-truck cyclic operation subject to operational constraints. The cycle is composed of loading truck with material at the loader, then, hauling truck to a dumpsite or ore crusher for unloading the material and subsequently, traveling truck back to the loader. Time durations are considered as one of the most important factors in loader-truck operation system. The probabilistic distribution functions are utilized to fit an appropriate distribution function for load, haul, dump, and return processes. The loader mean service time is dependent on loader bucket size, truck payload and geological conditions including hardness of rocks. The truck mean cycle time is influenced by travel distance, truck unloading times and queue at dumpsites or crushers. Moreover, selection of dispatching strategy is taken into account as another significant factor in the production rate so that the operation efficiency and utilization measurements are considerably related into the dispatching strategies in open pit mines. Finally, the steady state expected production rate can be calculated through queueing theory [10, 11] or simulation methods [12].
According to Figure 1, the actual capacity is a function of production rate as well as systematic risk factors (Phase II). Several elements may lead to equipment break down or operation interruptions such as equipment failure occurrence, delays in logistic and spare part supplement, type of maintenance strategies (inspections, preventive and corrective maintenance), maintainability and repair times. In this study, equipment failure behavior and maintainability are modeled as the systematic risk factors. Their effect is analyzed on the nominal capacity. Usually, restoration and repair times are neglected in the reliability evaluation problems due to small period of time. However, in this research, the downtimes are considered as a significant factor in the capacity analysis. The maintainability and restoration time are dependent on complexity of the failed element and the severity of failure incidents so that the severe events require more repair times and costs than mild failure events. Probabilistic failure analysis is utilized to recognize and predict the equipment breakdown behavior (Phase III). Hence, failure data trend is tested to distinguish the repairable and non-repairable sub-systems. The PRA is used as one of the prevalent techniques to conduct the risk assessment procedure for undesirable factors (Phase IV).
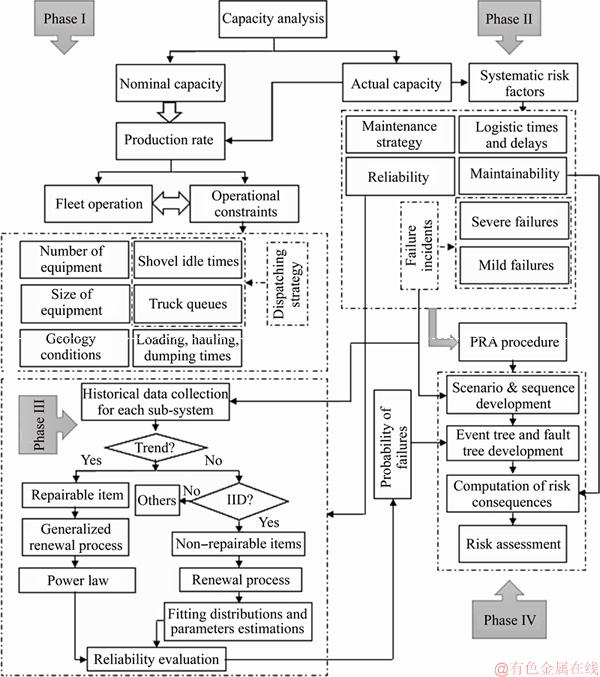
Figure 1 A step by step study algorithm for capacity analysis
2.1 Discrete event simulation
Discrete event simulation (DES) is commonly applied in mining restricts, due to its flexibility and capability of modeling dynamic structures, complexities and uncertainties. It is usually developed to model networks of queues, activities and events in various systems. The state of the systems change at discrete points of times such as failure and inaccessibility of resources or elements, change of shifts. These models have stochastic nature with distinct entities, specific activities, schedules, queues and decision making scenarios [13]. According to the procedure, individual elements (entities) pass through a set of activities and they may wait in the queues prior to begin an activity.
In the mine haulage system, the entities are trucks, the resources are loaders, and the activities include loading, hauling and delivering of materials. The decision rules are composed of choosing appropriate destinations such as waste dump or ore crusher and suitable working benches.
The required data sets for modeling and formulating queueing systems are arrival rates (associated with inter-arrival times and characterized by probabilistic distributions for random arrivals), system capacity (a limitation for the number of trucks, in the waiting lines or system), queue behavior and disciplines (the logical ordering of trucks in a queue determines which truck is chosen for loading when a loader becomes idle), shovel service rates for loading trucks (it is also quantified by probabilistic distributions).
Figure 2 depicts a queueing system for loader-truck operation in open pit mines. The cycle is composed of loading empty trucks with material at the shovel, then, hauling full trucks to the waste dump or ore crusher (the decision is made according to the type of material) and subsequently, traveling the truck back to the loader.

Figure 2 Typical single server for shovel-truck system
The formulations for average number of entities (trucks) are defined for system and queues by
 (1)
(1)
 (2)
(2)
where L and LQ are average number of trucks in system and queues during mission time T, respectively; Ti and  denote the period of time [0, T] in which the system and queues contain exactly i trucks, respectively.
The average total times that the haulage trucks spent in the system and queues are introduced by
 (3)
(3)
 (4)
(4)
where wi and are the period of times that each of the N trucks spent in the system and queues at a specific span of time, respectively. In addition, loader utilization is described as the proportion of time period when a shovel loads a truck. Therefore, shovel expected production (T) is computed by [14]
T=μ(1-P(D))L (5)
where μ is shovel service rate, P(D) is shovel idle probability which is affected by the number of trucks (D) allocated to and L is the truck payload.
2.2 Probabilistic risk analysis (PRA)
Risk is defined as the measurement of the likelihood and magnitude of any loss. In general, risk analysis is composed of three stages including risk assessment, risk management and risk communications [15]. In the risk assessment, the probability (or frequency) of losses or scenarios are estimated. In the second stage, the analysts would generate the possible ways and road maps in order to control and mitigate the risk frequency or consequences. Risk communications are also related into spreading outcomes of the risk for people. This paper has only been organized based on the risk assessment method. A quantitative representation of the risk is attained by a set of triplets (Eq. (6)). The mathematical equation for the risk assessment is followed by Eq. (7) [16].
 i=1, 2, …, n (6)

 (7)
(7)
where R is the risk of scenario i; Si is defined as a scenario, leading to exposure of hazard; Pi is likelihood of the scenario i; Ci is the consequence dealing with occurrence of events in the scenario i.
The PRA procedure is depicted in Figure 1 (Phase IV). The PRA is a systematic and comprehensive method, which considers different aspects including system logic, human factors, risk ranking and uncertainty sources. In the beginning of the PRA process, it is required to clarify the objectives and risk acceptability ranges. The next step is concerned with identification of system, data collection for sub-systems, boundaries, requirements, functionalities, human errors, maintenance and failures. In this step, the major obstacle is related to quality and precision of the compiled data, affecting extremely on the output results. Afterwards, it is essential to recognize and classify undesirable incidents and scenarios, which occur in the system. An event tree is then modeled for each risk scenario. Logic modeling step is also employed due to quantification of the event tree branch points. In general, the most popular ways for estimation of failure probability are fault trees [17] and master logic diagrams [18] (decision is made based on the required accuracy). Finally, several outputs could be derived for analysis procedure inclusion of sensitivity and uncertainty analyses, risk ranking and importance measures. For more information see [19].
2.2.1 Event tree and fault tree analysis
Event tree [20] is developed to analyze the occurrence of a scenario by using several main functions or sub-systems. Event tree branches are characterized by logical expressions and Boolean algebra paradigms. However, in order to quantitative evaluation of the event trees, it is necessary to integrate it with the fault tree analysis. A static fault tree is supposed to be comprised of events, binary gates (i.e. AND, OR gates) and transfers that the lower events connected to upper events via binary gates. In addition, there are other forms of logical gates such as Functional Dependency (FDEP) and Priority AND (PAND) [21] for dynamic fault trees. Generally, static fault trees are utilized for system modeling process, however, it has not the ability to model the systems with sequential relationships among their component failures. The probability of occurrence of a top event (event tree heading) is systematically deduced by combinations of different main functions or sub-systems (basic events). The fault tree itself is also a logical model and it makes a qualitative representation for the model. The quantitative algorithms such as cut sets can be employed to compute the top event failure probabilities [16]. A cut set is defined as a set of sub-systems (basic events), interrupting all possible connections between the input and output points. A minimal cut set is also described as the smallest combination of basic events failures that guarantee the occurrence of failure for the top event.
2.2.2 Failure stochastic processes
According to Figure 1 (Phase III), the statistical analyses are performed to investigate the failure time data behaviors for each system. In fact, failure and maintenance data set are usually gathered for the sub-systems. There are different available failure data sources comprising generic data (i.e. OREDA [22], military standardization handbook [23], NPRD95 [24] etc.), test and maintenance data, historical field data and expert judgments [25]. Basically, data collection is considered as a critical phase in engineering problems. Regardless of type of data, it is required to pay a great attention to accuracy and precision of the data sets. Consequently, the qualified database can lead to rational, trustworthy and convincing statistical analyses. Thereafter, trend of failure time data is tested and interpreted for the sub-systems. The trend analysis is employed to recognize and predict the failure behavior for the sub-systems. There are several methods in order to testing trends including probability plotting [26], time test on plot [27] and Laplace test [28]. The probability plotting method is conducted by drawing a plot of mean cumulative number of failures versus service lifetime for each sub-system [29, 30]. The plot outcomes are either a straight line or nonlinear curve so that the straight line expresses that there is no evidence for existence of trend in the available failure data, whereas the curved line exhibits an increasing or decreasing failure intensity. As a result, two different kinds of sub-systems are created entailing repairable and non-repairable.
The concept of non-repairable sub-system is introduced as an element is discarded and replaced after occurrence of first failure. Hence, renewal process (RP) technique [31] is considered for probabilistic evaluations of the elements. Based on statistical rules, these elements follow identical and independent distribution (IID) conditions. In general, the IID condition is fulfilled as long as the failure data have neither trend (characterized by testing trend) nor dependency (revealed through serial correlation test). The serial correlation test provides information regarding the independency of the failure data. In this method, a plot is drawn based on the ith TBF against the (i-1)th one [32]. If all plot’s points generate a single cluster, then, the data are independent, whereas the multi-clusters (two or more clusters) or a straight line lead to data dependency and violate the iid conditions.
For non-repairable items, a parametric method is employed to make a decision about the optimal fit for the failure time data (time to failure (TTF) data). Alternatively, the goodness of fit tests (i.e. Kolmogorov-Smirnov test [33]) contribute to select an appropriate probabilistic distribution function for the data set.
The repairable sub-system means that after occurrence of failure, the element is repaired at least for one time. In other words, repair and restoration of the element is preferred to replacement of the entire system. In this situation, the evidence exhibits a possible trend (increasing or decreasing trend) in the failure data. Therefore, the IID condition is not satisfied and it is necessary to choose a model with the capability of considering trends and failure intensity. Various approaches have been extended for modeling failure intensity such as linear, exponential (log-linear) and power law process. These models are denoted in Eqs. (8) to (10), respectively.
 (8)
(8)
 (9)
(9)
 (10)
(10)
where λ(t) is intensity function; t is time; λ, θ1, θ2 are model parameters; β is Weibull parameter.
However, the power law process is more interesting than others. This model is addressed based on non-homogeneous Poisson process (NHPP) [31]. In this technique, the system is minimally repaired after the failure occurrence and state of the system immediately returns to prior the repair action. The failure intensity formulated as a deterministic function, depending only on global time t and no further information such as failure and maintenance history is used.
2.2.3 Importance measure
Importance measure is considered as one of the outputs of for the PRA technique. The approach has the capability of recognizing and ranking the risk-significance of the elements. This technique is defined as one-at-a-time method so that the components or parameters change individually to measure the result of entire system. According to literature, there are several well-known importance measures encompassing Birnbaum [34], Fussell- Vesely [35, 36], risk reduction worth (RRW) and risk achievement worth (RAW) [37], all of which express the level of contribution for the system components in the PRA. Birnbaum importance measure is defined as the rate of changes in the total risk to the changes in a risk element. Fussell-Vesely is introduced as fraction of a risk element per total risk of the system (Eqs. (11) and (12)).
 (11)
(11)
 (12)
(12)
where R is the total risk of the system and it is assumed that the probability of all risk scenarios are introduced as a linear function for probability events (R=aP+b); aP is represented as all the cut sets involving a specific event “P”; b denotes all other cut sets.
3 Case study
Shovels are employed as loading assets in open pit mines. The loading systems are located at active working benches and utilized for continuous loading of the fragmented material to haul trucks.Unavailability and inaccessibility of shovels lead to operation interruption and reduction of the haulage system productivity.
In this paper, input data were provided through the compiled field data for shovels at Sungun copper mine. The database was comprised of operation times, truck haul times, shovel loading times, maintenance and failure data recorded for shovel’s sub-systems such as failure time data and time to repairs data.
A detailed analysis in the failure data revealed that two distinguish types of incidents occurred on the shovel’s sub-systems. The capacity analysis was performed to determine the actual versus nominal capacity for the scenarios by focusing on mild or severe failure scenarios. The shovel risk was addressed here based on the classification of the scenarios. The PRA has been developed to compute the loss of haulage fleet production capacity due to the failure incidents and their maintainability.
3.1 Shovel system modeling and statistical analyses
Sungun mine equipment fleet was included in trucks, loaders, shovels and drilling equipment. In this case, the influence of the shovel performance was evaluated on the haulage fleet production capacity. Accordingly, risk factors and undesirable scenarios were addressed for all sub-systems in the shovel. The shovel system was decomposed into six sub-systems in this study as shown in Figure 3. The categorization was carried out because, majority of the failures occurred on these elements.
The trend analysis was conducted to determine the rate of failure occurrence (ROCOF) function of the historical time between failure data for each sub-system (based on severe and mild failure incidents). The ROCOF is a function of working age for the repairable sub-systems, indicating decreasing or increasing failure intensity, whereas the non-repairable sub-systems reveal no trend. Figure 4 demonstrates a trend analysis procedure for bucket sub-system when the risk scenario is associated with mild failures. The plot points produce a straightforward line, then the data set does not have trend. The serial correlation test was developed according to the Section 2.2.2. It considers an independency examination for the time data (Figure 5). The analyses clearly illustrated that the IID condition was satisfied when the mild failures occured on the bucket sub-system (the item is classified as a non-repairable sub-system).

Figure 3 Decomposing shovel system into its sub-systems

Figure 4 Testing trend for Bucket sub-system when an initiating event leads to mild failure

Figure 5 Serial correlation test for bucket sub-system (mild initiating events)
The step by step process was implemented for each sub-system. It is performed based on both mild and severe risk scenarios. The best fitting distribution function was chosen in the next stage. In this regard, the classical distribution functions and power law process were employed for non-repairable and repairable items, respectively. Kolmogorov-Smirnov test was utilized to choose the proper distribution function for non-repairable sub-system. The best fitted distribution functions are given for each sub-system in Table 1.
Table 1 Optimal fit for each sub-system and according to two types of initiating event

3.2 Event tree development and quantification
In this work, event tree was constructed based on occurrence of two kinds of risk scenarios (mild and severe failure events) for the shovel system. Three simultaneous headings were extended for the event trees. The headings were composed of section EE (Engine and Electrical sub-systems), section TH (Transmission and Hydraulics sub-systems) and section BC (Bucket and Chassis sub-systems). Figure 6 depicts the event tree for the severe initiating event. According to Figure 6, after occurrence of the risk scenario (severe initiating event (IE)), then one of the headings EE or TH or BC is failed. In this figure, the upper branches show the success of the event tree headings, whereas the lower branches describe their failures. Consequently, the shovel system will be in operation while all the sub-systems (minimal cut sets) operate simultaneously. In contrast, if one of the sub-systems does not work correctly, the shovel system will be out of service and it will need to be repaired.

Figure 6 An event tree development with severe initiating event
The fault tree was developed for the event tree headings and thus the event tree branches were quantified based on failure or success probability values. The event tree heading and its sub-systems were configured as top and basic events in the fault tree, respectively. As an example, Figure 7 shows the fault tree structure with transmission and hydraulics basic events for the TH top event. According to the figure, the top event is associated with TH and the required basic events are coincided with its sub-systems including transmission and hydraulics. From reliability point of view, the shovel sub-systems are configured as series system. Thus, occurrence of failure of the TH top event is involved in failure of transmission (A), hydraulics (B) or both sub-systems. Consequently, OR gate was utilized to model the fault tree analysis  The failure probability of the TH top event is computed as

Figure 7 Fault tree analysis for TH top event under severe risk scenario
The next step was concerned with quantification of failure probability for the top events by employing minimal cut sets. The minimal cut sets are defined as the smallest combinations of the basic events in such a way that they guarantee the failure of the top event. For example, there are two minimal cut sets C1=A and C2=B with the probability of P(C1)=P(A) and P(C2)=P(B) for the TH top event.
To calculate the failure probability for the top events, it is essential to compute the mean failure probability for each sub-system (minimal cut sets). To achieve this, cumulative distribution function (CDF) was developed for the fitted distribution functions in the Table 1. For example, the log-normal and gamma distributions were fitted into the severe failure scenarios for the transmission and hydraulics sub-systems. Consequently, their CDFs were developed to estimate the failure probability for the time between failures. Figures 8 and 9 indicate the CDF curves’ points for all the sub-systems in severe and mild risk scenarios, respectively. In these figures, the mean failure probability was considered for each sub-system. It was performed by taking an average value for the failure probabilities of the collected TBFs data during one year of operation.

Figure 8 Computing failure probabilities for each sub-system in severe risk scenarios

Figure 9 Computing failure probabilities for each sub-system in mild risk scenarios
Table 2 provides the results of the mean failure probabilities for all the minimal cut sets (sub-systems). In this table, the mean failures were specified for each top event considering severe or mild risk scenarios. According to the table, the engine and electrical sub-systems were addressed as the minimal cut sets for EE top event. The transmission and hydraulics sub-systems were associated with TH top event. The bucket and chassis sub-systems were coincided with the BC top event. Similar to the TH top event, the EE and BC top events were connected to their basic events by OR gates. Hence, the fault trees have been developed for the top events.
Table 2 Results of fault tree analysis for each top event in fault trees

In addition, the failure probability is derived for the top events considering OR and AND gates as follows:
 (13)
(13)
 (14)
(14)
where P(TO) and P(TA) are considered as probability of occurrence of failure for outputs of the OR and AND gates, respectively; n is the number of input events, P(Ci) is the failure probability for the input event i, Ci, denotes the smallest combination of the sub-systems (basic events), which guarantees the failure event for the top event. In this table, the probability of failure events were derived for the top events based on Eq. (13).
3.3 Shovel capacity analysis
The capacity analysis was performed by integration of the shovel nominal capacity and risk of mine operation. As mentioned in Section 2.2, set of triplets must be quantified for existing scenarios in risk assessment. The frequency of the observed failure incidents were estimated for mild and severe failures 0.018 and 0.013 events per hour, respectively. The probability of occurrence of failures were computed for the estimated top events probabilities in the fault trees. The last element is the expected consequences for the risk scenarios. The risk consequences were associated with the amount of nominal production reduction at working benches during shovel downtimes. Consequently, the risk assessment requirements are provided for evaluation of risk magnitudes.
The shovel nominal production capacity was modeled by discrete event simulation (DES). The prevalent shovel-truck operation was regulated in the mine site in such a way that, when the shovel was failed and taken out of service, reserve loaders (based on the number of accessible loaders) were immediately substituted to prevent the loading operation interruption. This strategy tangibly contributes to the mine management for mitigation of the risk of material production dealing with shovel’s unavailability. The production capacity can nearly be fixed for the haulage system during the shovel downtimes. The major obstacle in this study was involved in the loader’s bucket capacity so that it was much smaller than the shovel’s bucket payload. This situation not only results in reduction of the haulage productivity but also leads to significant delays in material production timetable. Hence, this shovel was employed only at waste working benches in the mine.
Accordingly, identification and quantification of systematic risk scenarios and their expected consequences are considered as one of the major factors in the fleet nominal capacity.
The DES was established for one waste working bench and dumping point. The simulation requirements and outputs are presented in Table 3. According to the table, the rated bucket capacity were 18 and 6 m3 for the shovel and substituted loader, respectively. The duty of loading system was coincided with transportation of the blasted waste rocks from working face to the 100 t haul trucks. Based on the historical operation database, the shovel and loader average loading times were estimated 1.46 and 4.26 min for each service. The nominal capacity was distinctly calculated for shovel and loader. The simulation results revealed that the shovel and loader nominal capacity were 800 and 500 t/h, respectively. Therefore, the amount of losses was 300 t/h during shovel downtimes. It was utilized to quantify the risk consequences for the scenarios.
Table 3 Shovel and loader nominal capacity computation

In the next step, the risk values were assessed with respect to the risk triplets including risk scenarios, frequency and risk consequences. The detailed risk assessment procedure and measurements are given in Table 4.
As shown in Table 4, both risk scenarios (mild and severe) were considered to model the undesirable events, which occurred on the sub-systems (first column). The sub-systems were either in success or failure states if an initiating event occurred. There were three sequences for the failure of shovel system including EE, TH and BC top events (second and third columns). The top events were failed due to failure of at least one of two sub-systems (forth column). EE Failure occurrences were dealt with failures of the engine or electrical sub-systems, TH failure events were relied on failures of the transmission or hydraulics sub-systems and finally, BC failure events were concerned with the failures of the bucket or chassis sub-systems. In the fifth column, frequency of occurrence of the failures was quantified considering the risk scenarios of the minimal cuts (failed sub-systems). The frequency values were derived by multiplying the frequency of initiating events and failure probability of the sub-systems. As an example, the frequency value was computed 0.00916 for the engine sub-system in the mild failure scenario. The value was gained through multiplication of frequency of the mild initiating event and failure probability of the engine sub-system (frequency=0.018×0.5085). In the severe failure scenario, the frequency value was associated with 0.00438 for the engine sub-system (frequency=0.013×0.337). This procedure has been implemented to specify the frequency values for all of the risk scenarios (mild and severe) and the failed sub-systems.
In the next step, it is essential to estimate the shovel unavailability by focusing on maintainability measurements for different risk scenarios (sixth column). According to Table 4, historical repair database was gathered to fit the best distribution function into the collected time to repair (TTR) data. Then, the average repair times were considered for all the sub-systems considering different types of risk scenarios. As shown in Table 4, the severe failure scenarios spent more restoration times than the mild failure scenarios. The time to repair estimation plays an important role in the risk assessment. This measure was employed to compute the average value for the lost production capacity during the shovel repair activities (seventh column). For example, if a mild failure incident occurs on the engine sub-system, it requires two hours to be repaired, thus the lost production capacity is associated with 600 tons per each event. The amount of the lost production capacity was utilized as the consequences for the risk scenarios. In the last column, the risk magnitudes were estimated based on the shovel sub-systems and severity of the failure incidents. In this regard, the values of the failure frequency (column 5) were multiplied in values of the risk consequences (column 7). Thus, the risk magnitudes (column 8) were computed for the failure of each sub-system.
Table 4 Risk assessment of sub-systems according to different risk scenarios

Furthermore, Table 4 demonstrates that the high-risk and low-risk sub-systems were associated with the transmission (severe initiating event) and electrical (severe initiating events) sub-systems, respectively. The transmission risk magnitude was estimated 17 tons per hour, whereas the electrical risk value was specified 2 tons per hour. Therefore, transmission severe failures will dramatically increase the shovel failure risk and it is considered as the most significant factors for the system performance.
3.4 Discussion
According to Table 4, total risks of the shovel failures were approximately 23 and 52 tons per hour for the mild and severe scenarios, respectively. The actual capacity would approximately be 777 and 748 tons per hour if mild and severe scenarios occur on the shovel system, respectively.
Importance measure is taken into account as one of the worthwhile outcomes for the risk assessment procedure. In this study, the Fussell-Vesely importance measure was devoted to recognizing and ranking the sub-systems from failure frequency point of view. In Figures 10 and 11, the bar graphs display the importance for the sub-systems with respect to two different initiating events (severe and mild scenarios). For severe initiating events in Figure 10, the greatest and smallest failure frequencies were associated with the hydraulics and engine sub-systems, respectively. Whereas, the biggest and smallest failure frequencies were related to the hydraulics and chassis sub-systems, respectively (Figure 11). Interpretation of the importance measure helps the specialists to mitigate and control the number of undesirable incidents in the critical sub-systems.

Figure 10 Ranking sub-systems based on importance measure method (severe initiating events)
It is worthwhile here to represent a comparison between the results of the failures frequency and repair duration (loss of production capacity because of sub-system’s failure) for the risk magnitudes. According to the results of the Table 4, the biggest lost production capacity was coincided with failure of the transmission sub-system (severe initiating event), whereas the smallest values were dealt with chassis (mild initiating event) and electrical (mild and severe initiating events) sub-systems. The transmission repair duration was 9 h per event, whereas the chassis and electrical repair durations were coincided with one hour per event.

Figure 11 Ranking sub-systems based on importance measure method (mild initiating events)
The greatest and smallest failure frequencies were associated with the hydraulics (mild initiating event) and engine (severe initiating events), respectively. The failure frequencies were 0.01035 and 0.00438 events per hour for the hydraulics and engine, respectively.
The results revealed that the most effective factor for the shovel risk assessment is accommodated in the time to repair of the sub-systems (consequences in the risk triplets) and the failure frequency has a negligible influence on the risk magnitudes. In other words, frequent events (mild events) with short repair duration result in lower risk values in comparison with the infrequent events (severe events).
4 Concluding remarks
In this research, a framework was proposed for mining equipment capacity analysis. The structure was conducted to analyze the influence of equipment performance on the fleet nominal capacity. The DES was employed to compute the fleet nominal capacity. The probabilistic risk assessment (PRA) technique was utilized to investigate the impact of systematic risk scenarios on the target capacity. The equipment failure behaviors and maintainability measurements were considered as one of the significant risk factors, affecting the haulage fleet capacity. The fleet actual capacity was derived under the operational uncertainties.
According to the PRA results, occurrence of severe scenarios lead to high risk levels in the transmission, bucket and engine sub-systems. It is essential to control and mitigate the equipment risk with respect to the crucial sub-systems. Thus, the amount of loss of fleet production capacity is decreased. To achieve this, the mine management should develop a comprehensive maintenance policy for the critical sub-systems. The cumulative number of corrective maintenance is declined and thus the equipment availability is improved. This strategy leads to reduction of the cumulative repair durations at a specific time interval. Subsequently, the productivity is enhanced for the haulage fleet.
Acknowledgment
Authors would like to appreciate the support of the operation management and maintenance department at Sungun Copper Mine.
References
[1] WOLSTENHOLME E, COYLE R. Modelling discrete events in system dynamics models: A case study [J]. Dynamica, 1980, 6: 21-28. https://www.systemdynamics. org/assets/dynamica/61/6.pdf.
[2] SONTAMINO P, DREBENSTEDT C. A prototype dynamics model for finding an optimum truck and shovel of a new surface lignite mining in Thailand [C]// Proceedings of the 12th International Symposium Continuous Surface Mining. Aachen: Springer, 2015: 493-501. DOI: https://doi.org/ 10.1007/ 978-3-319-12301-1_42.
[3] BARABADI A, BARABADY J, MARKESET T. A methodology for throughput capacity analysis of a production facility considering environment condition [J]. Reliability Engineering & System Safety, 2011, 96: 1637-1646. DOI: https://doi.org/10.1016/j.ress.2011.09.001.
[4] MD-NOR Z, KECOJEVIC V, KOMLJENOVIC D, GROVES W. Risk assessment for loader-and dozer-related fatal incidents in US mining [J]. International Journal of Injury Control and Safety Promotion, 2008, 15: 65-75. DOI: https://doi.org/10.1080/17457300801977261.
[5] PAITHANKAR A. Hazard identification and risk analysis in mining industry [D]. Rourkela: National Institute of Technology, 2011. http://ethesis.nitrkl.ac.in/ 2445/.
[6] RUFF T, COLEMAN P, MARTINI L. Machine-related injuries in the US mining industry and priorities for safety research [J]. International Journal of Injury Control and Safety promotion, 2011, 18: 11-20. DOI: 10.1080/17457300. 2010.487154.
[7] ROY S, BHATTACHARYYA M, NAIKAN V. Maintainability and reliability analysis of a fleet of shovels [J]. Mining Technology, 2001, 110: 163-171. DOI: https:// doi.org/10.1179/mnt.2001.110.3.163.
[8] SAMANTA B, SARKAR B, MUKHERJEE S. Reliability analysis of shovel machines used in an open cast coal mine [J]. Mineral Resources Engineering, 2001, 10: 219-231. DOI: https://doi.org/10.1142/S0950609801000610.
[9] PATNAYAK S, TANNANT D, PARSONS I, DEL VALLE V, WONG J. Operator and dipper tooth influence on electric shovel performance during oil sands mining [J]. International Journal of Mining, Reclamation and Environment, 2008, 22: 120-45. DOI: https://doi.org/10.1080/17480930701482961.
[10] KOENIGSBERG E. Cyclic queues [J]. The Journal of the Operational Research Society (OR), 1958, 1: 22-35. DOI: 10.2307/3007650.
[11] ADAN I, RESING J. Queueing theory [M]. Eindhoven: University of Technology Eindhoven, 2002.
[12] ALLEN T T. Introduction to discrete event simulation and agent-based modeling: Voting systems. health care, military, and manufacturing [M]. Springer Publishing Company, Incorporated, 2011. DOI: 10.1007/978-0-85729-139-4.
[13] BRAILSFORD S, HILTON N. A comparison of discrete event simulation and system dynamics for modelling health care systems. [M]// Planning for the Future: Health Service Quality and Emergency Aceessibility. Operational Research Applied to Health Services (ORAHS) Glasgow Caledonian University 2001. [2016-07-11] https://eprints.soton.ac.uk/ id/eprint/35689.
[14] TA CH, INGOLFSSON A, DOUCETTE J. A linear model for surface mining haul truck allocation incorporating shovel idle probabilities [J]. European Journal of Operational Research, 2013, 231: 770-778. DOI: https://doi.org/10.1016/ j.ejor.2013.06.016.
[15] National Research Council Staff. Risk assessment in the federal government: Managing the process [M]. National Academies Press, 1984. DOI: 10.17226/366.
[16] MODARRES M. Risk analysis in engineering: Techniques, tools, and trends [M]. Boca Raton: CRC Press, 2006.
[17] DHILLON B S. Maintainability, maintenance, and reliability for engineers [M]. Boca Raton: CRC Press, 2006.
[18] MODARRES M, KAMINSKIY M P, KRIVTSOV V. Reliability engineering and risk analysis: A practical guide [M]. Boca Raton: CRC Press, 2016.
[19] STAMATELATOS M, DEZFULI H, APOSTOLAKIS G, EVERLINE C, GUARRO S, MATHIAS D, MOSLEH A, PAULOS T, RIHA D, SMITH C. Probabilistic risk assessment procedures guide for NASA managers and practitioners [R]. Washington DC: NASA. 2011. DOI: 10.13140/RG.2.2.18206.13122
[20] BARI R, BUSLIK A, CHO N, EL-BASSIONI A, FRAGOLA J, HALL R E, LLBERG D, LOFGREN E, O'BRIEN J, PAPAZOGLOU I A. Probabilistic safety analysis procedures guide [R]. Prepared for US Nuclear Regulatory Commission, NUREG/CR-2815. 1985, 1. [2016-02-05] https://www.nrc. gov/reading-rm/doc-collections/ nuregs/contract/cr2815/.
[21] SALEHPOUR-OSKOUEI F, POURGOL-MOHAMMAD M. Fault diagnosis improvement using dynamic fault model in optimal sensor placement: A case study of steam turbine [J]. Quality and Reliability Engineering International, 2016, 33(3): 531-541. DOI: https://doi.org/10.1002/qre.2031.
[22] PARTICIPANTS O. OREDA offshore reliability data handbook [M]. Trondhim, Norway: DNV, 2002.
[23] HANDBOOK M S. MIL-HDBK-217F. Reliability prediction of electronic equipment [M]. US Department of Defense, 1995.
[24] CENTER R I A. Nonelectronic parts reliability data (NPRD95) [M]. USA: Reliability Analysis Center, 1995.
[25] MEYER M A, BOOKER J M. Eliciting and analyzing expert judgment: a practical guide [M]. SIAM, 2001. DOI: https://doi.org/10.1137/1.9780898718485.
[26] KECECIOGLU D. Reliability engineering handbook [M]. New Jersey: Prentice Hall, 1991.
[27] MARTZ H, WALLER R. Bayesian reliability analysis [M]. New York: John Wiley & Sons, 1982.
[28] KVALOY J T, LINDQVIST B. An area based test for trend in repairable systems data [EB/OL] [2016-02-11] https://www.semanticscholar.org/paper/An-Area-Based-Test-for-Trend-in-Repairable-Systems-Kval-Lindqvist/6bd5185745b7315e3a8d6c647584454a4bf5c85c.
[29] NELSON W B. Recurrent events data analysis for product repairs, disease recurrences, and other applications [M]. ASA/SIAM. 2003. DOI: https://doi.org/10.1137/1.9780898 718454.
[30] MORAD A M, POURGOL-MOHAMMAD M, SATTARVAND J. Application of reliability-centered maintenance for productivity improvement of open pit mining equipment: Case study of sungun copper mine [J]. Journal of Central South University, 2014, 21: 2372-2382. DOI: 10.1007/s11771-014-2190-2.
[31] LEEMIS L M. Reliability: probabilistic models and statistical methods [M]. Prentice-Hall, Inc, 1995.
[32] LOUIT D M, PASCUAL R, JARDINE A K S. A practical procedure for the selection of time-to-failure models based on the assessment of trends in maintenance data [J]. Reliability Engineering & System Safety, 2009, 94: 1618-1628. DOI: https://doi.org/10.1016/j.ress.2009.04.001.
[33] MASSEY F J Jr. The Kolmogorov-Smirnov test for goodness of fit [J]. Journal of the American Statistical Association, 1951, 46: 68-78. DOI: 10.2307/2280095.
[34] BIRNBAUM Z W. On the importance of different components in a multicomponent system [M]. Washington DC: University of Washington, Laboratory of Statistical Research, 1968.
[35] FUSSELL J. How to hand-calculate system reliability and safety characteristics [J]. IEEE Transactions on Reliability, 1975, 3: 169-174. DOI: 10.1109/TR.1975.5215142.
[36] VESELY W, DAVIS T, DENNING R, SALTOS N. Measures of risk importance and their applications [R]. Washington DC: Division of Risk Analysis, Office of Nuclear Regulatory Research, US Nuclear Regulatory Commission, 1983.
[37] CHADWELL G B, LEVERENZ F L. Importance measures for prioritization of mechanical integrity and risk reduction activities [R]. American Institute of Chemical Engineers; 1999.
(Edited by HE Yun-bin)
中文导读
基于能力露天矿山装载设备的性能测量
摘要:本研究的目的是建立一个综合的能力分析框架模型,以解决系统的危险因素对运输车队额定能力的影响。该模型是基于数据驱动的方法,考虑不同的场景,捕捉采矿设备的突发风险。概率风险评估(PRA)是通过关注故障事件的严重性和可维护性度量来量化生产能力的损失。配置离散事件模拟来表征采矿作业的标称能力。在此基础上,通过标称能力与实际能力的比较,对系统能力进行了分析。通过一个案例研究验证了本文的研究方法,收集了铲运机过去的运行维护现场数据。采用离散事件模拟方法对铲斗标称能力进行了估计,然后,通过开发PRA方法来评估不良场景的影响。研究结果为提高矿山生产能力提供了重要的启示。分析人员对处理高风险水平的关键因素有很好的判断,可以制定一个全面的维护计划来减少和控制损失。
关键词:能力;性能;维修性;矿山设备;风险评估
Received date: 2017-03-15; Accepted date: 2018-10-10
Corresponding author: Mohammad POURGOL-MOHAMMAD, PhD, Associate Professor; Tel: +98-4133459422; E-mail:pourgolmohammad@sut.ac.ir; ORCID: 0000-0001-5450-4501

