A novel method to predict static transmission error for spur gear pair based on accuracy grade
来源期刊:中南大学学报(英文版)2020年第11期
论文作者:石万凯 刘昶 Francesca Maria CURA Andrea MURA
文章页码:3334 - 3349
Key words:gear; transmission error; time-varying backlash; prediction method; accuracy grade
Abstract: This paper proposes a novel method to predict the spur gear pair’s static transmission error based on the accuracy grade, in which manufacturing errors (MEs), assembly errors (AEs), tooth deflections (TDs) and profile modifications (PMs) are considered. For the prediction, a discrete gear model for generating the error tooth profile based on the ISO accuracy grade is presented. Then, the gear model and a tooth deflection model for calculating the tooth compliance on gear meshing are coupled with the transmission error model to make the prediction by checking the interference status between gear and pinion. The prediction method is validated by comparison with the experimental results from the literature, and a set of cases are simulated to study the effects of MEs, AEs, TDs and PMs on the static transmission error. In addition, the time-varying backlash caused by both MEs and AEs, and the contact ratio under load conditions are also investigated. The results show that the novel method can effectively predict the range of the static transmission error under different accuracy grades. The prediction results can provide references for the selection of gear design parameters and the optimization of transmission performance in the design stage of gear systems.
Cite this article as: LIU Chang, SHI Wan-kai, Francesca Maria CURA, Andrea MURA. A novel method to predict static transmission error for spur gear pair based on accuracy grade [J]. Journal of Central South University, 2020, 27(11): 3334-3349. DOI: https://doi.org/10.1007/s11771-020-4550-4.

J. Cent. South Univ. (2020) 27: 3334-3349
DOI: https://doi.org/10.1007/s11771-020-4550-4

LIU Chang(刘昶)1, SHI Wan-kai(石万凯)1, Francesca Maria CURA2, Andrea MURA2
1. State Key Laboratory of Mechanical Transmission, Chongqing University, Chongqing 400044, China;
2. Department of Mechanical and Aerospace Engineering, Politecnico di Torino, Torino 10129, Italy
 Central South University Press and Springer-Verlag GmbH Germany, part of Springer Nature 2020
Abstract: This paper proposes a novel method to predict the spur gear pair’s static transmission error based on the accuracy grade, in which manufacturing errors (MEs), assembly errors (AEs), tooth deflections (TDs) and profile modifications (PMs) are considered. For the prediction, a discrete gear model for generating the error tooth profile based on the ISO accuracy grade is presented. Then, the gear model and a tooth deflection model for calculating the tooth compliance on gear meshing are coupled with the transmission error model to make the prediction by checking the interference status between gear and pinion. The prediction method is validated by comparison with the experimental results from the literature, and a set of cases are simulated to study the effects of MEs, AEs, TDs and PMs on the static transmission error. In addition, the time-varying backlash caused by both MEs and AEs, and the contact ratio under load conditions are also investigated. The results show that the novel method can effectively predict the range of the static transmission error under different accuracy grades. The prediction results can provide references for the selection of gear design parameters and the optimization of transmission performance in the design stage of gear systems.
Key words: gear; transmission error; time-varying backlash; prediction method; accuracy grade
Cite this article as: LIU Chang, SHI Wan-kai, Francesca Maria CURA, Andrea MURA. A novel method to predict static transmission error for spur gear pair based on accuracy grade [J]. Journal of Central South University, 2020, 27(11): 3334-3349. DOI: https://doi.org/10.1007/s11771-020-4550-4.
1 Introduction
The prediction of static transmission error is increasingly concerned by gear designer in recent years. It is not only the main performance parameter of gear systems, especially for precision machinery such as robotic devices and automated machines, but of course it is the main internal excitation of gear noise and vibration. Therefore, correctly predicting the static transmission error is beneficial to optimize the transmission performance of gear systems in the design stage.
It is well known that MEs, AEs, TDs and PMs exert great influence on static transmission error. In order to analyze the effects of both shape and mounting deviations on gear dynamic behaviors, VELEX and MAATAR [1] developed a comprehensive mathematical model, and it was verified by comparing with some results from the literature. MUNRO et al [2] discussed a special phenomenon, corner contact, and an approximate equation used to calculate the transmission error in this phenomenon was presented. MOHAMAD et al [3, 4] derived the theoretical formula of the transmission error by a quasi-infinite elastic model composed of springs with stiffness specific to the gears and studied the effect of tooth flank form deviation on transmission error. WANG and ZHANG [5] studied the influence of tooth profile errors on the loaded transmission error of helical gear by the slice method. YUAN et al [6, 7] established a loaded static transmission error model, and the shaft deformation was considered in this model. PARK [8] studied the effect of sliding friction on the transmission error of spur gears under quasi-static condition. The finite element method has also been widely used in the study of transmission error. LI [9] studied the influence of MEs, AEs and tooth modifications on transmission error based on a special-developed finite element method software. LIN and HE [10] established a finite element model for the calculation of the static transmission error, in which MEs, AEs and PMs were considered. SHWEIKI et al [11] proposed a hybrid analytical-finite element approach to analyze the transmission error and strain of lightweight gears. Besides, BAI et al [12] and LI et al [13] calculated the static transmission error based on the measured tooth profile deviation and the measured discrete tooth surfaces, respectively. The static transmission error was also approximately represented by the limited terms of Fourier-series [14, 15]. On the experimental side, a series of experimental investigations of spur gear pairs were performed in Refs. [16-19], and the dynamic response and root stress were studied under the influence of indexing errors, tooth spacing errors and involute tip relief. BENATAR et al [20] measured the static and dynamic transmission error of helical gear pairs using a power circulatory test machine with encoder and accelerometer-based transmission error measurement systems.
Although many works in the past have been published about transmission error analysis, as aforementioned papers, most of the presented models are finite element models and in some cases present incomplete approaches. However, MEs are usually small compared to the finite element mesh size. Besides, MEs are usually averaged to one value, and MEs are considered equal for each tooth. In fact, only the range of MEs is determined in the design stage and the MEs of each tooth are different. Therefore, correctly generating the error tooth profile based on the accuracy grade is the key to predicting gears transmission error.
In addition, backlash is also an important performance parameter of gear systems, especially referring to those that need to frequently change the rotation direction. In the past, nonlinear behaviors caused by backlash were usually represented by a piecewise function [21-24]. CHEN et al [25] studied the relationship between central distance error and backlash, and the formula of dynamic backlash was deduced. ROCCA and RUSSO [26] studied the gear rattle phenomenon by combining the dynamic model and the experimental data of static transmission error and time-varying backlash. WANG et al [27] deduced the formula of the time- varying backlash in consideration of gear eccentricity and studied the influence of time- varying backlash and varying load on dynamic transmission error. MARGIELEWICZ et al [28] evaluated the effects of different functions of gear backlash, such as the polynomial functions of the third degree and the logarithmic equation, on the effectiveness of computer simulation. However, there are few studies on the influence of MEs on time-varying backlash.
In this study, a discrete gear model, a tooth deflection model and a transmission error model are established. The discrete gear model shows the capacity of generating the error tooth profile based on ISO (International Organization for Standardization) accuracy grade in consideration of single pitch deviation, total cumulative pitch deviation, total profile deviation, tooth thickness deviation and base tangent length. The gear model and the tooth deflection model for calculating the tooth compliance on gear meshing are coupled with the transmission error model to make the prediction by checking the interference status between gear and pinion. The effects of MEs, AEs, TDs and PMs on the static transmission error are investigated quantitatively. Besides, the time-varying backlash caused by MEs and AEs, as well as the contact ratio under load conditions is also studied. In the rest of paper, the term ‘transmission error’ refers to the static transmission error.
2 Gear model
Reasonable generation of the error tooth profile of the spur gear is the key to predict the transmission error, and various models are proposed in the literature. The calculation method of the contact point deviations from the action plane of gear pairs and the transmission errors considering MEs and TDs under load was presented by KUROKAWA et al [29]. In KUROKAWA’s method, the MEs and the topological modifications were averaged to a single value, and therefore, only one profile error was considered. In fact, the MEs of each tooth are different, and it is assumed that they are randomly distributed in this study.
In this section, a discrete model for generating the error tooth profile of the spur gear is developed. In this model, MEs including single pitch deviation (fpt), total cumulative pitch deviation (Fp), total profile deviation (Fα), tooth thickness deviation (Es) and base tangent length (Wk) are considered, as shown in Figure 1. These MEs can be found in ISO Standard [30] according to the gear accuracy grade, chosen by the designer in the design stage. In Figure 1, Wkni and Wkns are the lower and upper deviations of the base tangent respectively, Esni and Esns are the lower and upper deviations of the tooth thickness respectively, and pt is the theoretical single pitch. The teeth are denoted by the counting index n, and k is the number of teeth spanned.

Figure 1 Definition of gear MEs
In this work, the tooth profile is separated into N1 two-dimensional points with the same arc length. First of all, the theoretical profile of the 1st tooth,LSP1  and RSP1
  can be obtained by the standard involute equation, where LSP and RSP represent the left and right side tooth profile, respectively. Then, the tooth profiles on both sides of each tooth will be generated based on the different MEs in sequence. For an arbitrary point Pi on the nth tooth profile, the MEs can be calculated by:
 (1)
(1)
 (2)
(2)
 (3)
(3)
where Rand(1) represents a random number between 0 and 1.
The LSP and RSP equations of the nth tooth are given by:
 (4)
(4)
 (5)
(5)
where  and
and  can be expressed as follows:
 (6)
(6)
 (7)
(7)
where r is the reference radius, and z is the number of teeth. After the LSP and RSP of each tooth are generated, the total cumulative pitch deviation (Fp) and the base tangent length (Wk) will be used to verify the rationality of
 and
and
3 Tooth deflection model
A non-uniform cantilever beam is used as the assumption for the gear tooth in this model (see Figure 2), and the tooth compliance coefficient due to tooth bending, shear deflection, foundation and contact deflections is calculated. According to OSWALD et al [31], the transition curve of dedendum is replaced by an arc. In Figure 2, point O2 is the origin of coordinates, where it is at the center of gear. rroot represents the radius of the root circle. Point M1, situated on the root circle, is the intersection between the involute’s extension and the root circle. The tangential point between the root circle and the fillet is denoted by point M2. The midpoint between point M1 and point M2 is denoted by point M. Le is the effective tooth length. The contact zone is made up of a number of transverse elements. The rectangular cross-sectional elements are denoted by the counting index i, and Li is the width of each element. Wj is the normal force, and the distance between its application point and the right face of the element i on the X3 axis is denoted by Sij. The angle between the normal force and the Y2 axis is βj. The coordinate of the application point of Wj on the Y2 axis is Yj. For each element, it is treated as a cantilever beam, where the left side of the beam is fixed. The normal force is broken down as the components of forces and moments, which are applied to the right side of the elemental beam. The tooth’s total deflection is calculated by summing the deflection of each element.

Figure 2 Nonuniform cantilever beam model of gear tooth
According to TAVAKOLI and HOUSER [32] and CORNELL [33], the total tooth compliance coefficient at the jth calculation point is expressed by:
 (8)
(8)
where Qbj is the total compliance coefficient caused by the bending and shear deflections; Qfj is the foundation compliance coefficient; Qh is the contact deflection coefficient. These three coefficients at the jth calculation point are given by Eqs. (9)-(14). where, for each element, Ii is the mean area moment of inertia; is the mean cross-sectional area; E, υ and G represent the elastic modulus, the Poisson ratio and the shear modulus, respectively; b is the face width; Hp is the tooth thickness at the pitch point; Wn is the total normal load.
For the wide tooth 


 (9)
(9)


 (10)
(10)
 (11)
(11)
For the narrow tooth 


 (12)
(12)


(13)
 (14)
(14)
4 Transmission error model
4.1 Contact between tooth surfaces
In most literature, it is assumed that the contact points are located on the mesh line. However, due to the effects of MEs, AEs and TDs, the positions of the contact points are often unpredicted and the normal distance of two tooth surfaces along the mesh line is not an effective method for taking into account the surface contact between teeth. In this work, a method to check the interference status between driving and driven gears is proposed based on the relative position of discrete points on the tooth surface. The principle of this method is depicted in Figure 3.
Here, the solid lines are the actual tooth profiles, and the dashed lines are the theoretical tooth profiles. The driving gear rotates counterclockwise, and the driven gear is fixed. It is assumed that the point P2 is the interference point, which lies on the actual tooth profile of driven gear. A coordinate system, X4P2Y4, is established at the point P2 (see Figure 3). If the driving and driven gears are in contact, there has to be a point P1 located on the second quadrant of the coordinate system X4P2Y4, where P1 is also located on the actual tooth profile of driving gear. So, the coordinates of points P1 and P2 must satisfy the conditions of the inequalities (15):
 (15)
(15)
Therefore, the inequalities (15) will be used to judge whether these two gears are touching each other and to determine the contact positions. Theoretically, when the rotation step size of the driving gear is small enough and the tooth profile is discretized into enough points, the requirements of the calculation accuracy can be satisfied. In practice, the rationality of these two parameters is verified by calculating the transmission error of the perfect tooth profile without MEs, AEs and TDs, because its theoretical value is zero.

Figure 3 Method for judging contact between tooth surfaces
4.2 Transmission error model without load
In this work, a discrete analysis model is proposed to calculate the transmission error. The gear model established in Section 2 (Gear mode l) is used in this model (see Figure 4). The coordinate system, X5O5Y5, is established at the center of the driving gear. O5′ is the center of the driven gear. Axis Y5 is the connection between these two gear centers, and a is the center distance. rp1 and rp2 are the pitch radii of driving and driven gears, respectively.
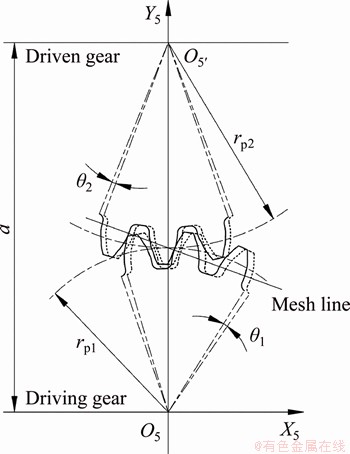
Figure 4 Transmission error model without load
In this model, the dashed tooth profiles are the initial state of these two gears. Firstly, the driven gear is rotated clockwise by a certain step, △θ2, and then fixed, and the driving gear is rotated counterclockwise by another smaller step, △θ1, to approach the driven gear. The step size of the two gears can be determined according to the number of sampling points in a whole mesh period and the required calculation accuracy respectively. In each step of the driving gear rotation, the interference status between the two gears is checked by the inequalities (15) until the two gears are in contact, as shown by the solid lines in Figure 4. It is assumed that the angular rotation of the driven gear is denoted by θ2, and the total angular displacement of the driving gear is denoted by θ1. On the driven gear side, the angular transmission error is defined by:
 (16)
(16)
where z1 and z2 are the number of teeth of these two gears respectively; TEθ represents the angular transmission error.
4.3 Transmission error model under load
From the transmission error model without load, the position of the initial contact point can be determined. It is assumed that only a pair of teeth are touching each other. Then, the deflections of the two gears,  and
and  can be determined using the total output torque and Eq. (8), as shown in Figure 5(a).
Due to the effect of MEs, the direction of deflection is inconsistent with the direction of the mesh line.  and
and  are the projection values of these two deflections, and on the mesh line respectively. The sum of and can be converted into an additional rotation angle of the driving gear by Eq. (17):
 (17)
(17)
where rb1 is the base circle radius of the driving gear.
Then the driving gear is continued to rotate to θ1+θD1 by step △θ1. There are two situations that need to be considered in this process. If the second pair of teeth are still not touching each other after that rotation, then the transmission error under load can be calculated by Eq. (18):
 (18)
(18)
Referring to Figure 5(b), if the second pair of teeth are touching each other during that rotation, these four deflections, 

 and
and  can be calculated using the total output torque and Eq. (8). Then, their projection values can be converted into a new additional rotation angle of the driving gear by Eq. (19):
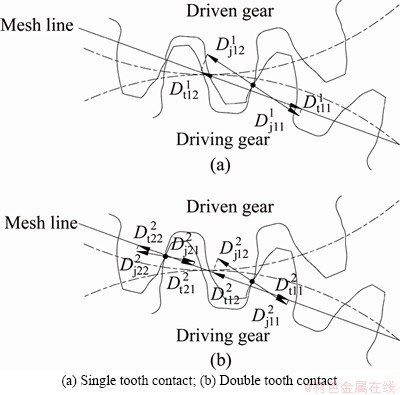
Figure 5 Transmission error model under load:
 (19)
(19)
The previous process has to be repeated until no new pair of teeth touch each other. It is assumed that there are N pairs of teeth touch each other. According to Eq. (17) and Eq. (19), the additional rotation angle of the driving gear is defined by:
 (20)
(20)
In this situation, the transmission error under load is given by:
 (21)
(21)
In order to understand the whole process of predicting the transmission error, the flow chart of the proposed novel method is given, as shown in Figure 6. Wk_actual is the actual base tangent length, which is calculated after the tooth profile of each tooth is generated with a random function. Ca is the amount of profile modification; △a is the center distance error; △e is the gear eccentricity error; Tout is the total output torque on the driven gear.
5 Numerical results and discussion
5.1 Experimental validation of prediction method
OTTEWILL et al [34] constructed a test platform to obtain the relative gear trajectories for a spur gear pair. The measured gear pair were two steel gears with the same number of teeth, and their module, pitch circle diameter, face width were 6, 108 and 7.5 mm, respectively. The gear precision satisfied the Grade 6 of ISO standard. More specifically, the maximum values of fpt, Es and Fα were 7.6, -70 and 5.1 μm, respectively. The output torque was 5.5 N・m. In addition, the influence of gear eccentricity error was considered but the profile modification was not. The maximum eccentricities of the driving and driven gears were 0.05588 and 0.04826 mm, respectively. In order to validate the feasibility of the prediction method, the above-mentioned gear pair is applied to the proposed method. In the validation process, the error tooth profiles of the experimental gears are first generated by the proposed gear model based on the tolerance range of MEs. Then, the different eccentricities of the two gears are obtained by changing the gear rotation center positions in transmission error model, and the transmission error is calculated for different eccentricities. Figure 7 shows the comparison between the prediction results of the transmission error and the experimental results.

Figure 6 Flow chart of prediction method of transmission error
The different teeth mesh sequences and the different relative eccentricities of the two gears will lead to the different prediction results. Figures 7(a) and (b) show the results of the smallest and the largest amplitude oscillations, respectively. The differences of the peak-to-peak value of the transmission error in Figures 7(a) and (b) are 3.4% and 4.8%. It shows that the proposed prediction method can accurately predict the peak-to-peak value of the transmission error. On the other hand, the results curves also show that the local waveform of the transmission error curves is different. This is because only the range of MEs was provided in the literature [34], and the actual MEs in this work are randomly selected from the range of MEs. Besides, the local waveform of the transmission error curves will change as the tooth meshing sequence.

Figure 7 Comparison of prediction and experimental results:
5.2 Gear pair used as research object
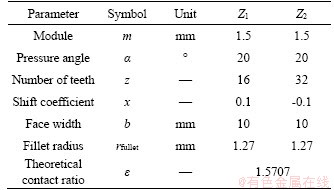
In order to quantitatively study the effects of MEs, AEs, TDs and PMs on the static transmission error, the prediction method is applied to a new research object whose design parameters are shown in Table 1. Based on the gears parameters and ISO standard [30], the precision parameters of the gear pair are obtained (see Table 2), where k is the number of teeth spanned. Besides, the number of discrete points of involute tooth profile (N1) and root fillet (N2) are 2000 and 10, respectively. The rotation step size of driving gear (△θ1) and driven gear (△θ2) are 1° and 1″, respectively. These discrete parameters are determined in three steps:1) determine △θ2 according to the number of sampling points in a whole mesh period;2) determine △θ1 based on the required calculation accuracy of the transmission error; 3) assign N1 and N2, and calculate the unloaded transmission error of the gear pair with the perfect tooth profile. If the unloaded transmission error is equal to zero, the parameters N1 and N2 are determined; otherwise, N1 and N2 are reassigned until the unloaded transmission error is equal to zero.
Table 1 Design parameters of research object
5.3 Gear pair without load and MEs
In this section, the number of contact tooth, transmission error and backlash of the gear pair under ideal conditions are calculated. That is, MEs, AEs, TDs and PMs are not considered in this part. The results curves are shown in Figure 8.
According to the results, both transmission error and backlash are zero in the entire mesh cycle. The average value of the number of contact teeth is used to describe the magnitude of contact ratio, which is 1.5709. It is very close to the theoretical contact ratio (1.5707), which can be found in Table 1. The difference between these two values is only 0.52%. These results are consistent with the actual situation and verify the rationality of discrete parameters.
5.4 Effects of MEs on transmission error and backlash
In this section, the effects of the accuracy grade and the types of MEs on transmission error and backlash are investigated. The peak-to-peak value of transmission error curve is denoted by TEpp, which is used to describe the amplitude of transmission error. The average value of time- varying backlash is denoted by Bavg, which is used to evaluate the magnitude of backlash.
5.4.1 Effect of accuracy grade on transmission error and backlash
There are twenty sets of MEs randomly selected in each accuracy grade, and their TEpp and Bavg are calculated respectively. In addition, the average values of TEpp and Bavg are obtained, as shown in Table 3. The result curves corresponding to the first set of MEs of each accuracy grade are shown in Figure 9.
Table 2 Precision parameters of research object
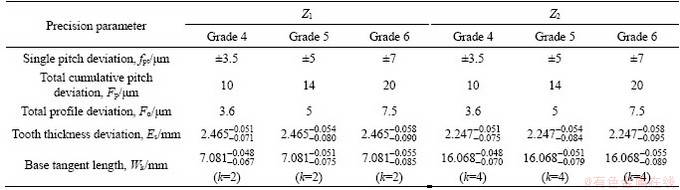
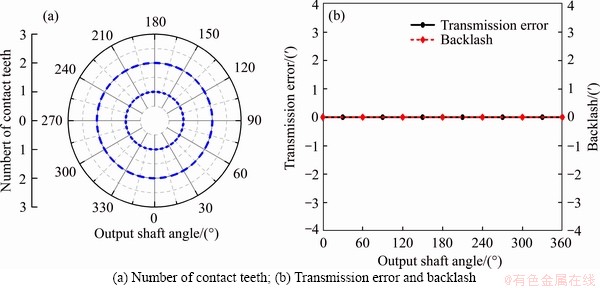
Figure 8 Gear pair under ideal conditions:
According to these results, the maximum and minimum values of TEpp and Bavg are obtained. From the extremum values, the ranges of TEpp and Bavg of each grade can be predicted using this method when there are enough cases. In addition, both average values of TEpp and Bavg increased with the increasing of accuracy grade. For the average value of TEpp, the percentage difference between grade 4 and grade 5 is 46.58%, and the percentage difference between grade 5 and grade 6 is 42.11%. For the average value of Bavg, the percentage difference between grade 4 and grade 5 is 8.11%, and the percentage difference between grade 5 and grade 6 is 10.42%. Therefore, the accuracy grade has a greater effect on TEpp than Bavg. This is because the backlash is mainly related to the tooth thickness deviation. The upper deviation of the tooth thickness is mainly determined by the minimum backlash. However, the minimum backlash is almost equal for each accuracy grade, and the magnitude of the tooth thickness deviation is basically independent on the accuracy grade. Besides, Figure 9 shows that the oscillating amplitudes of the transmission error curve and the backlash curve of grade 6 are significantly larger than the other two grades. This is due to the difference of the deviation ranges for different grades.
5.4.2 Effect of different types of MEs on transmission error and backlash
In Figure 9, there are many step changes in the curves of transmission error and backlash. In order to investigate the causes of these step changes, different types of MEs are applied to the previous model respectively. It is noted that the pitch deviation and the tooth thickness deviation must be considered at the same time; otherwise, there will be interference between the two gears. Therefore, the MEs are divided into three cases here: total deviation, pitch deviation and tooth thickness deviation, only profile deviation. The result curves are shown in Figure 10.
In Figure 10(a), when only the pitch deviation and the tooth thickness deviation are considered, the TEpp is 2.7167'. When comparing this value and the TEpp considering the total deviation (2.8083'), the difference in percentage is 3.26%. However, when only the profile deviation is considered, the TEpp is 0.2'. It is only 7.12% of the TEpp considering the total deviation. It is shown that the pitch deviation and the tooth thickness deviation have a greater effect on transmission error than the profile deviation. Besides, the transmission error curve considering the pitch deviation and the tooth thickness deviation shows the same trend as the transmission error curve considering the total deviation. Therefore, the pitch deviation and the tooth thickness deviation change not only the amplitude of transmission error curve, but also its waveform, while the profile deviation just caused small fluctuations to it. In Figure 10(b), the similar conclusions about the effect of different MEs types on the backlash curve can be obtained.
Table 3 Results of TEpp and Bavg of different accuracy grades
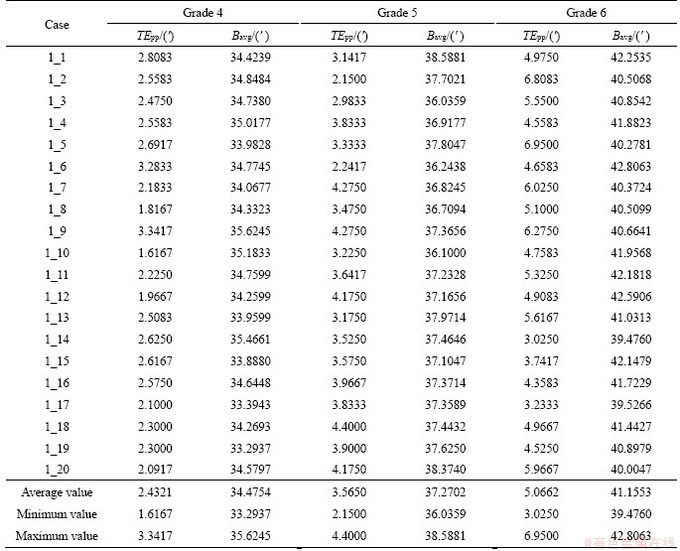
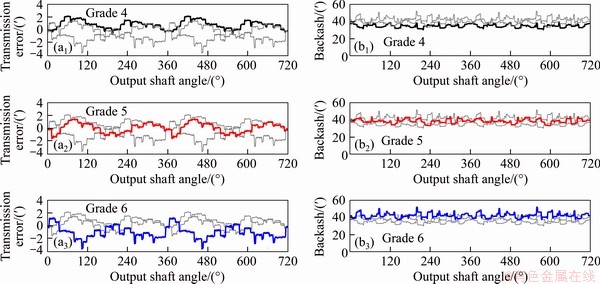
Figure 9 Effect of accuracy grade on transmission error (a) and backlash (b)
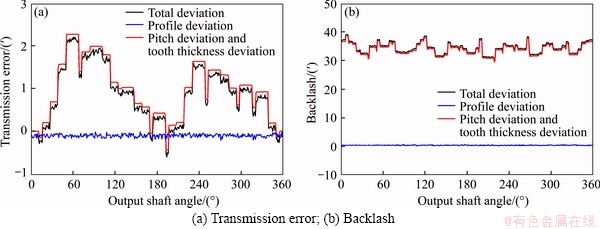
Figure 10 Gear pair with different types of MEs:
5.5 Effects of AEs on transmission error and backlash
In this section, only the center distance error is considered, and the misalignment error is neglected. There are five cases used to investigate the effects of assembly error on transmission error and backlash. TEavg represents the average value of transmission error. The results are shown in Table 4 and Figure 11.
According to these results, both transmission error and backlash curves show similar waveforms under different AEs. There is no significant relationship between the center distance error and TEpp, but as the center distance increases, the average value of the transmission error decreases. On the contrary, as the center distance increases, the average value of the backlash increases. Besides, the differences of the average values of transmission error and the differences of the average values of backlash between the adjacent case are almost equal.
Table 4 Results of different center distance errors
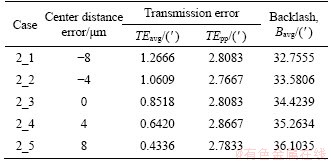

Figure 11 The gear pair with different center distance errors:
5.6 Effects of TDs on contact ratio and transmission error
5.6.1 Effects of MEs on compliance of tooth
In addition to MEs and AEs, the deflection of gear teeth under load is also an important cause of transmission error. The magnitude of deflection is not only related to the magnitude of load, but also to the compliance of tooth. There are many factors that affect the compliance of tooth, such as the geometrical parameters of gears, materials, MEs. Here, only the effects of MEs are investigated, and other conditions are the same. Because the total profile deviation is very small compared to the tooth thickness deviation, only the influence of tooth thickness deviation is considered. For each accuracy grade, the lower deviation of tooth thickness deviation is used to generate the profile. Figure 12 shows the total compliance under the conditions of different tooth thickness deviations.
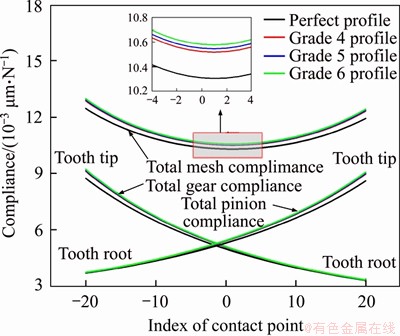
Figure 12 Influence of tooth thickness deviation on compliance of tooth
According to the result curves, for the gear or the pinion, the total compliance decreases from tooth tip to tooth root. The difference of the total gear compliance at tooth tip between the grade 4 profile and the perfect profile is 0.3797×10⁻³ μm/N, but the difference at tooth root is close to zero. It shows that tooth thickness deviation has a greater influence on the total compliance at tooth tip than tooth root. Besides, the total gear compliance curves of grade 4, grade 5 and grade 6 are very close to each other, and the difference of the total gear compliance at tooth tip between the grade 4 and the grade 5 profiles is 0.0484×10⁻³ μm/N. This is because, for different (precision) grades (see Table 2), the lower deviations of tooth thickness deviation are quite similar. The total pinion compliance has the same trend. For the total mesh compliance, it is a concave curve.
5.6.2 Effects of TDs on contact ratio
In this part, the effects of TDs on contact ratio are investigated by changing only the magnitude of load. The number of contact teeth at each position is calculated and its average value is used to describe the magnitude of contact ratio. Figure 13 shows the number of contact teeth under different loads, 0, 5, 15 and 25 N・m, with grade 4 MEs.
In Figure 13(a), when the output torque is zero, there is only one position where two teeth are touching each other at the same time and the contact ratio is 1.0028, very close to 1. When the output torque is 5 or 15 N・m, the number of contact teeth alternates between 1 and 2, but it is irregular compared with Figure 8(a). Therefore, the positions of the contact points are often unpredicted due to the effects of MEs and TDs. Besides, the contact ratio under different loads, 5, 15 and 25 N・m, are 1.1634, 1.4100 and 1.6066, respectively. The results show that the contact ratio under 25 N・m is greater than the theoretical value, 1.5707 (refer to Table 1). Therefore, the contact ratio increases with the increasing of load under the same MEs conditions, and it maybe exceeds the theoretical value.
5.6.3 Effects of TDs on transmission error
The effects of TDs on transmission error are investigated by changing only the magnitude of load in this section. The transmission error curves under different loads, 0, 5, 15 and 25 N・m, with grade 4 MEs are shown in Figure 14.
According to the result curves, the TEpp under different loads, 0, 5, 15 and 25 N・m, are 2.8083', 2.8081', 2.8079' and 2.8075' respectively. It is shown that the TEpp decreases correspondingly with the increasing of load under the same MEs conditions. This is because the positive values in Figure 14 indicate that the theoretical angular displacement of the driven gear is behind its actual displacement, while the TDs caused by the load is beneficial to reduce the difference between these two displacements. Besides, the result curves have similar waveforms under different loads, but the result curves between the output shaft angle of 90° and 150° show that the TDs caused by the load aggravate the local oscillation of the transmission error curve.

Figure 13 Influence of load on contact ratio with IT4 MEs:

Figure 14 Effect of load on transmission error with IT4 MEs
5.7 Effects of PMs on transmission error
PMs are often used to reduce vibrations, shock and noise of gear systems. In this part, five cases (see Table 5) are used to investigate the effects of PMs on transmission error. These cases have the same load magnitude (25 N・m) and modification length (1.1 mm), but there are differences in the amount of modification and the type of curve. The result curves are shown in Figure 15.
Table 5 Results of different modification parameters

According to Table 5, it is shown that both TEpp of Case 3_2 and Case 3_3 are equal to the TEpp of Case 3_1, but the TEpp of Case 3_4 is larger than the TEpp of Case 3_1. In addition, comparing the result curves of Case 3_1, 3_2, 3_3 and 3_4 (see Figure 15), it is found that the transmission error curve of Case 3_2 is relatively smoother than the other three Cases. It is noted that the local oscillation of the transmission error curve of Case 3_4 is more obvious than the curve of Case 3_1. Therefore, the appropriate PMs are beneficial to improve the smoothness of the transmission error curve. Otherwise, the PMs not only increases the peak-to-peak value of the transmission error curve, but also aggravates the local oscillation of the transmission error curve. Besides, comparing the result curves of Case 3_5 and Case 3_3, the transmission error curve of Case 3_5 is relatively smoother than the curve of Case 3_3. Therefore, the parabolic modification has better influence on the smoothness of the transmission error curve than the line modification.

Figure 15 Effect of PMs on transmission error
6 Conclusions
In this study, a novel method to predict the static transmission error for the spur gear pair based on the accuracy grade is proposed, and it is validated by comparison with the experimental results. Based on the prediction method, the effects of MEs, AEs, TDs and PMs on the static transmission error are investigated quantitatively. In addition, the time-varying backlash caused by both MEs and AEs, and the contact ratio under load conditions are also investigated. The main conclusions are outlined in the following:
1) The novel method can effectively predict the range and average value of the transmission error and time-varying backlash under different accuracy grades. It can be used to provide references for the selection of gear design parameters and the optimization of transmission performance in the design stage of gear systems.
2) Pitch deviation and tooth thickness deviation have a greater effect on both transmission error and backlash than profile deviation. Furthermore, pitch deviation and tooth thickness deviation change not only the amplitudes of transmission error and backlash curves, but also their waveforms, while profile deviation just causes small fluctuations to them. Therefore, the rational controlling of the tolerance range of the pitch and tooth thickness deviations are beneficial to reducing the peak-to-peak value of transmission error and the average value of backlash.
3) The influence of the center distance error is insignificant to the amplitude and waveform of transmission error curves, but as the center distance increases, the average value of the transmission error decreases. On the contrary, as the center distance increases, the average value of the backlash increases.
4) The tooth deflections will lead to increase of the contact ratio, even more than its theoretical value. It is noted that the positive values in transmission error curve indicate that the angular displacement of the driven gear is ahead of its theoretical displacement. In this condition, the tooth deflections are beneficial to decrease the amplitude of transmission error curve, but it maybe aggravates the local oscillations of the transmission error curve.
5) The appropriate profile modification is beneficial to improve the smoothness of the transmission error curve. Otherwise, the profile modification not only increases the amplitude of transmission error curve, but also aggravates the local oscillation of the transmission error curve. In addition, the parabolic modification has better influence on the smoothness of the transmission error curve than the line modification.
Contributors
LIU Chang established the predicting model of static transmission error and drafted the manuscript. SHI Wan-kai obtained funding, proposed the concept of the predicting model, and contributed to the interpretation of the results. Francesca Maria CURA and Andrea MURA carried out data processing, performed data analysis, and contributed to the paper writing. All authors have read and approved the final manuscript.
Conflict of interest
LIU Chang, SHI Wan-kai, Francesca Maria CURA and Andrea MURA declare that they have no conflict of interest.
References
[1] VELEX P, MAATAR M. A mathematical model for analyzing the influence of shape deviations and mounting errors on gear dynamic behavior [J]. Journal of Sound and Vibration, 1996, 191(5): 629-660. DOI: 10.1006/jsvi.1996. 0148.
[2] MUNRO R G, MORRISH L, PALMER D. Gear transmission error outside the normal path of contact due to corner and top contact [J]. Proceedings of the Institution of Mechanical Engineers, Part C: Journal of Mechanical Engineering Science, 1999, 213(4): 389-400. DOI: 10.1243/095440699 1522347.
[3] MOHAMAD E N, KOMORI M, MURAKAMI H, KUBO A, FANG S. Analysis of general characteristics of transmission error of gears with convex modification of tooth flank form considering elastic deformation under load [J]. Journal of Mechanical Design, 2009, 131(6): 061015. DOI: 10.1115/ 1.3116261.
[4] MOHAMAD E N, KOMORI M, MURAKAMI H, KUBO A, FANG S. Effect of convex tooth flank form deviation on the characteristics of transmission error of gears considering elastic deformation [J]. Journal of Mechanical Design, 2010, 132(10): 101005. DOI: 10.1115/1.4002458.
[5] WANG Qi-bin, ZHANG Yi-min. A model for analyzing stiffness and stress in a helical gear pair with tooth profile errors [J]. Journal of Vibration and Control, 2015: 1077546315576828. DOI: 10.1177/1077546315576828.
[6] YUAN Bing, CHANG Shan, LIU Geng, CHANG Le-hao, LIU Lan. Quasi-static analysis based on generalized loaded static transmission error and dynamic investigation of wide-faced cylindrical geared rotor systems [J]. Mechanism and Machine Theory, 2019, 134: 74-94. DOI: 10.1016/j. mechmachtheory.2018.12.019.
[7] YUAN Bing, CHANG Shan, LIU Geng, WU Li-yan. Quasi-static and dynamic behaviors of helical gear system with manufacturing errors [J]. Chinese Journal of Mechanical Engineering, 2018, 31(1): 30. DOI: 10.1186/ s10033-018-0238-1.
[8] PARK Chan IL. Tooth friction force and transmission error of spur gears due to sliding friction [J]. Journal of Mechanical Science and Technology, 2019, 33(2): 1311-1319. DOI: 10.1007/s12206-019-0232-2.
[9] LI Shu-ting. Effects of machining errors, assembly errors and tooth modifications on loading capacity, load-sharing ratio and transmission error of a pair of spur gears [J]. Mechanism and Machine Theory, 2007, 42(6): 698-726. DOI: 10.1016/ j.mechmachtheory.2006.06.002.
[10] LIN Teng-jiao, HE Ze-yin. Analytical method for coupled transmission error of helical gear system with machining errors, assembly errors and tooth modifications [J]. Mechanical Systems and Signal Processing, 2017, 91: 167-182. DOI: 10.1016/j.ymssp.2017.01.005.
[11] SHWEIKI S, REZAYAT A, TAMAROZZI T, MUNDO D. Transmission Error and strain analysis of lightweight gears by using a hybrid FE-analytical gear contact model [J]. Mechanical Systems and Signal Processing, 2019, 123: 573-590. DOI: 10.1016/j.ymssp.2019.01.024.
[12] BAI Fan, CHEN Si-yu, TANG Jin-yuan. Comparisons of dynamic responses of a spur gear pair with two forms of profile deviation [J]. Australian Journal of Mechanical Engineering, 2018, 19: 1-9. DOI: 10.1080/14484846.2018. 1465377.
[13] LI Hao-nan, CHEN Si-yu, TANG Jin-yuan, CHEN Wei-tao, OUYANG Hong-wu. A novel approach for calculating no-load static transmission error based on measured discrete tooth surfaces [J]. Mechanism and Machine Theory, 2019, 138: 112-123. DOI: 10.1016/j.mechmachtheory.2019.03. 044.
[14] TAMMINANA V K, KAHRAMAN A, VIJAYAKAR S. A study of the relationship between the dynamic factors and the dynamic transmission error of spur gear pairs [J]. Journal of Mechanical Design, 2007, 129(1): 75. DOI: 10.1115/ 1.2359470.
[15] XU Jin-li, ZENG Fan-cong, SU Xing-yi. Coupled bending- torsional nonlinear vibration and bifurcation characteristics of spiral bevel gear system [J]. Shock and Vibration, 2017, 2017: Article ID 6835301. DOI: 10.1155/2017/6835301.
[16] KAHRAMAN A, BLANKENSHIP G W. Effect of involute tip relief on dynamic response of spur gear pairs [J]. Journal of Mechanical Design, 1999, 121(2): 313-315. DOI: 10.1115/1.2829460.
[17] HANDSCHUH M J, KAHRAMAN A, MILLIREN M R. Impact of tooth spacing errors on the root stresses of spur gear pairs [J]. Journal of Mechanical Design, 2014, 136(6): 061010. DOI: 10.1115/1.4027337.
[18] INALPOLAT M, HANDSCHUH M, KAHRAMAN A. Influence of indexing errors on dynamic response of spur gear pairs [J]. Mechanical Systems and Signal Processing, 2015, 60: 391-405. DOI: 10.1016/j.ymssp.2014.11.017.
[19] TALBOT D, SUN A, KAHRAMAN A. Impact of tooth indexing errors on dynamic factors of spur gears: experiments and model simulations [J]. Journal of Mechanical Design, 2016, 138(9): 093302. DOI: 10.1115/ 1.4034175.
[20] BENATAR M, HANDSCHUH M, KAHRAMAN A, TALBOT D. Static and dynamic transmission error measurements of helical gear pairs with various tooth modifications [J]. Journal of Mechanical Design, 2019, 141(10): 103301. DOI: 10.1115/1.4043586.
[21] AL-SHYYAB A, KAHRAMAN A. Non-linear dynamic analysis of a multi-mesh gear train using multi-term harmonic balance method: Period-one motions [J]. Journal of Sound and Vibration, 2005, 284(1, 2): 151-172. DOI: 10.1016/j.jsv.2004. 06.010.
[22] SHEN Yong-jun, YANG Shao-pu, LIU Xian-dong. Nonlinear dynamics of a spur gear pair with time-varying stiffness and backlash based on incremental harmonic balance method [J]. International Journal of Mechanical Sciences, 2006, 48(11): 1256-1263. DOI: 10.1016/j.ijmecsci.2006.06.003.
[23] MORADI H, SALARIEH H. Analysis of nonlinear oscillations in spur gear pairs with approximated modelling of backlash nonlinearity [J]. Mechanism and Machine Theory, 2012, 51: 14-31. DOI: 10.1016/j.mechmachtheory. 2011.12. 005.
[24] SHANGGUAN Wen-bin, LIU Xue-lai, YIN Yu-ming, RAKHEJA S. Modeling of automotive drive line system for reducing gear [J]. Journal of Sound and Vibration, 2018, 416: 136-153. DOI: 10.1016/j.jsv.2017.07.052.
[25] CHEN Si-yu, TANG Jin-yuan, LUO Cai-wang, WANG Qi-bo. Nonlinear dynamic characteristics of geared rotor bearing systems with dynamic backlash and friction [J]. Mechanism and Machine Theory, 2011, 46(4): 466-478. DOI: 10.1016/ j.mechmachtheory.2010.11.016.
[26] ROCCA E, RUSSO R. Theoretical and experimental investigation into the influence of the periodic backlash fluctuations on the gear rattle [J]. Journal of Sound and Vibration, 2011, 330(20): 4738-4752. DOI: 10.1016/j.jsv. 2011.04.008.
[27] WANG Guang-jian, CHEN Lin, YU Li, ZOU Shuai-dong. Research on the dynamic transmission error of a spur gear pair with eccentricities by finite element method [J]. Mechanism and Machine Theory, 2017, 109: 1-13. DOI: 10.1016/j.mechmachtheory.2016.11.006.
[28] MARGIELEWICZ J, GASKA D, LITAK G. Modelling of the gear backlash [J]. Nonlinear Dynamics, 2019, 97(1): 355-368. DOI: 10.1007/s11071-019-04973-z.
[29] KUROKAWA S, ARIURA Y, OHTAHARA M. Transmission errors of cylindrical gears under load-influence of tooth profile modification and tooth deflection [C]// Proceedings 7th ASME International Power Transmission and Gearing Conference. 1996, 88: 213-217.
[30] ISO 1328/1. Cylindrical gears-ISO system of flank tolerance classification-part 1: Definitions and allowable values of deviations relevant to flanks of gear teeth [S]. 2013.
[31] OSWALD F, LIN H, LIOU C H, VALCO M. Dynamic analysis of spur gears using computer program DANST [C]// 29th Joint Propulsion Conference and Exhibit. 1993: 2295. DOI: 10.2514/6.1993-2295.
[32] TAVAKOLI M S, HOUSER D R. Optimum profile modifications for the minimization of static transmission errors of spur gears [J]. Journal of Mechanisms, Transmissions, and Automation in Design, 1986, 108(1): 86-94. DOI: 10.1115/1.3260791.
[33] CORNELL R W. Compliance and stress sensitivity of spur gear teeth [J]. Journal of Mechanical Design, 1981, 103(2): 447-459. DOI: 10.1115/1.3254939.
[34] OTTEWILL J R, NEILD S A, WILSON R E. Intermittent gear rattle due to interactions between forcing and manufacturing errors [J]. Journal of Sound and Vibration, 2009, 321(3-5): 913-935. DOI: 10.1016/j.jsv.2008.09.050.
(Edited by YANG Hua)
中文导读
基于齿轮精度等级的直齿轮副静态传动误差预测方法
摘要:本文提出一种基于齿轮精度等级的直齿轮副静态传动误差预测方法,该方法综合考虑了加工误差、安装误差、轮齿变形以及齿廓修形的影响。首先,分别建立了根据ISO齿轮精度等级生成误差齿廓的离散齿轮模型,轮齿变形模型,以及传动误差模型;随后,将上述三个模型进行耦合,从而实现直齿轮副传动误差的预测。对比分析文献中实验结果与本文预测结果,验证了该预测方法的正确性。基于一系列仿真算例,研究了加工误差、安装误差、轮齿变形以及齿廓修形对静态传动误差的影响规律。此外,还研究了加工误差和安装误差对时变啮合侧隙的影响规律,以及受载条件下重合度的变化规律。结果显示,该方法可有效预测不同齿轮精度等级下直齿轮副静态传动误差范围。预测结果可为齿轮设计参数的选择和齿轮系统设计阶段传动性能的优化提供参考。
关键词:齿轮;传动误差;时变啮合侧隙;预测方法;精度等级
Foundation item: Project(51675061) supported by the National Natural Science Foundation of China
Received date: 2020-01-07; Accepted date: 2020-07-15
Corresponding author: SHI Wan-kai, PhD, Professor; Tel: +86-13527341699; E-mail: shi_wankai@sina.com; ORCID: https://orcid.org/ 0000-0002-3147-0027

