


Trans. Nonferrous Met. Soc. China 22(2012) 342-347
Influence of europium doping on conductivity of LiNiPO4
M. PRABU1, 2, S. SELVASEKARAPANDIAN2, A. R. KULKARNI1, S. KARTHIKEYAN3, C. SANJEEVIRAJA4
1. Department of Metallurgical Engineering and Material Science, Indian Institute of Technology Bombay,Mumbai, India;
2. Department of Physics, Kalasalingam University, Krishnankoil-626126, Tamilnadu, India;
3. School of Advanced Sciences, VIT University, Vellore 632014, Tamilnadu, India;
4. Department of Physics, Alagappa University, Karaikudi-630003, Tamilnadu, India
Received 13 April 2011; accepted 9 August 2011
Abstract: Europium doped LiNiPO4 and undoped LiNiPO4 were prepared by Pechini method. Compound formation temperature was confirmed from thermogravimetry and differential thermal analysis (TG/DTA). Powder X-ray diffraction (XRD) pattern confirmed the formation of pure LiNiPO4 compound with an orthorhombic structure. The conductivity and modulus analyses of the samples were carried out at different temperatures and frequencies using the complex impedance spectroscopy technique. The conductivity parameters such as ion hopping frequency and the charge carrier concentration term were calculated using Almond and West formalisms. An increase of one order of magnitude in the ionic conductivity has been observed for 1.0% Eu-doped LiNiPO4. (mole fraction). The complex modulus studies suggest the presence of non-Debye type of relaxation in the materials.
Key words: LiNiPO4; ionic conductivity; impedance spectroscopy; doping; hopping
1 Introduction
Recently, lithium metal phosphates LiMPO4 (M=Fe, Mn, Co, and Ni) with olivine-type structure have attracted considerable attention as perspective intercalation materials for lithium-ion batteries because of their low cost, improved safety and good capacity retention [1-3].
Unfortunately, besides all their advantages, olivine phased compounds have one serious deficiency, i.e., their very low electrical conductivity. Many efforts have been undertaken to improve electrical properties by structure modification, introduction of carbon additives [4,5] or by selective doping with supervalent metal ions such as Mg2+, Al3+, Cr3+, Zr4+, Ti4+, Nb5+, W6+ [6�C9], which can greatly improve the conductivity. It is observed, so far no study has been made on the conductivity mechanisms of europium-doped LiNiPO4 cathode material by means of impedance spectroscopy. The goal of this work is to study the conductivity processes in europium-doped LiNiPO4 at temperatures from 303 K to 423 K using impedance measurements at frequencies from 10 Hz to 1 MHz in order to deduct useful information about the Li ion mobility in the orthorhombic structure.
2 Experimental
The Pechini method, as described in Ref. [10], has been employed for the preparation of 1.0% (mole fraction) europium-doped LiNiPO4 cathode material. The synthesis procedure adopted for the preparation of europium-doped LiNiPO4 cathode material is schematically shown in Fig. 1. Stoichiometric amounts of LiNO3, Ni(NO3)2��6H2O, Eu(NO3)3��6H2O and NH4H2PO4 of analytical grade, have been used as starting materials together with citric acid and ethylene glycol. Pyrolysis of the mixture obtained was performed at 350 ��C for 2 h in a hot plate that yielded homogeneous black powder precursors that have been ground into fine powders and has been calcinated at 800 ��C for 8 h.
Thermogravimetric analysis (TGA) and differential thermal analysis (DTA) studies have been performed using Perkin Elmer Diamond TGA/DTA instrument at a heating rate of 5 ��C/min in air. XRD patterns have been obtained using a XPERT-PRO X-ray diffractometer PW3050/60 with Cu K�� radiation having a wavelength of 1.5417 ? at room temperature. A pressure around 1.76 kN (1.2 t) was applied to forming a pellet with 1 mm in thickness and 10 mm in diameter. The pellet has been sintered at 600 ��C for 3 h. The pellets were coated with conductive silver paint. Complex impedance spectroscopy (CIS) measurements have been carried out using a Solatron 1260 frequency response analyzer combined with a Solatron 1296 electrochemical interface. The impedance spectra were recorded over the frequency range of 10 Hz to 1 MHz in different temperature ranges.
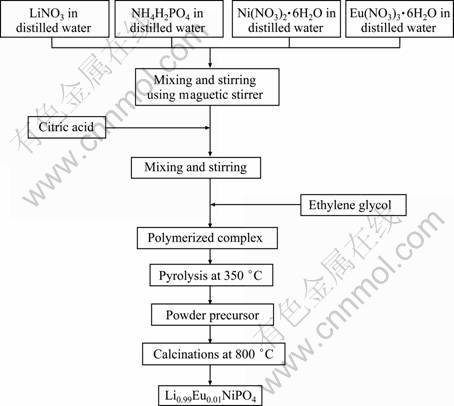
Fig. 1 Schematic diagram of synthesis of europium-doped LiNiPO4 cathode material
3 Results and discussion
3.1 Thermal response
In order to obtain the information about the exact temperature of the formation reaction of the olivine structured LiNiPO4 and europium doped LiNiPO4 powders, combined thermal analysis (TG/DTA) on the precursor complex has been studied in the temperature range from room temperature to 850 ��C. The results are shown in Fig. 2.
Thermogravimetric analyses of both samples exhibit a gradual and an initial mass loss up to about 630 ��C due to the initial evaporation of water (below 200 ��C) and a subsequent decomposition of precursors (200�C630��C) from the in-situ formed metastable complex. In other words, the decomposition of citric acid with evolution of NO2 and NH3 gases followed by the final decomposition which shows larger exothermic peak observed at 572 ��C in the DTA curve, which results in the formation of LiNiPO4 and europium-doped LiNiPO4. Herein, the compound formation process starts at a temperature as low as 450 ��C and gets completed around 630 ��C. It is indicated that no exothermic reaction or mass-loss appears after 630 ��C.
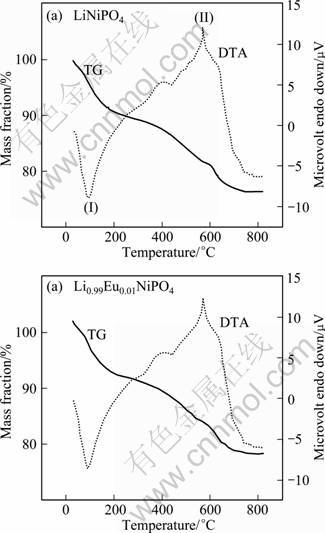
Fig. 2 TG-DTA curves of LiNiPO4 (a) and Eu-doped LiNiPO4 (b)
3.2 X-ray diffraction analysis
The X-ray diffraction (XRD) patterns of LiNiPO4 and 1.0% europium-doped LiNiPO4 powders are shown in Fig. 3. The diffraction peaks of both samples are in full accordance with the ordered LiNiPO4 olivine structure indexed to the orthorhombic Pnma space group with (JCPDS file number 88-1297). It can be seen from the patterns that all diffraction peaks are very strong after europium doping, which indicates that the samples have good crystal structure.
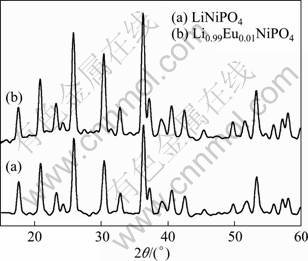
Fig. 3 XRD patterns of LiNiPO4 (a) and Eu-doped LiNiPO4 (b)
3.3 Conductance spectra analysis
The conductance spectra of LiNiPO4 and europium- doped LiNiPO4 measured at various temperatures are given in Fig. 4. The pattern of variation indicates low- frequency plateau and high-frequency dispersion. The hopping frequency is found to shift towards the higher frequency as temperature increases. This behavior suggests that electrical conduction in the material takes place via hopping mechanism governed by the Jonscher��s power equation [11]:
��(��)=��DC+A��n (1)
where ��(��) is the conductivity at a particular frequency; ��DC is the DC conductivity of the sample; �� is the angular frequency; A is a constant; n is the ratio of backhop rate to site relaxation time.
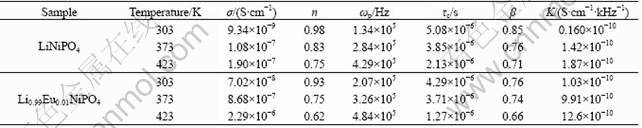
The frequency independent conductivity at low frequency region corresponds to DC conductivity of the sample [12]. The room temperature conductivity of LiNiPO4 is found to be 9.34��10-9 S/cm. The conductivity increases by doping europium in LiNiPO4.
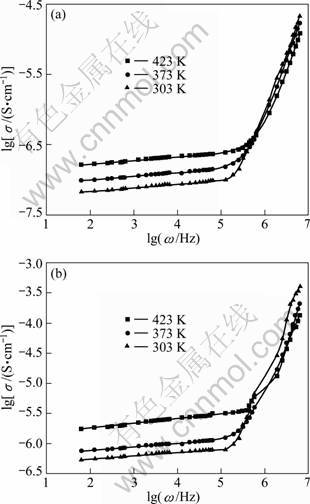
Fig. 4 Conductance spectra of LiNiPO4 (a) and Eu-doped LiNiPO4 (b) at various temperatures
A conductivity value of 7.02��10-8 S/cm is observed for europium doped LiNiPO4 which is about one order of magnitude higher than LiNiPO4.
According to the jump relaxation model reported by FUNKE [13], the power law exponent (n) relates the ratio of backhop rate to the site relaxation time.
The backhop is the backward motion of a hopping ion to its initial site, which is caused by the coulomb repulsive interaction between mobile ions. The conductance spectra of all the samples have been fitted with Eq. (1) and the parameter (n) has been extracted and given in Table 1. The decrease in n in the case of doping europium has been observed and it may be due to the formation of free sites for Li ion migration, which in turn reduces the backhop rate and hence n decreases.
Ionic hopping rate (��p) has been calculated from the conductance spectra for all the samples at different temperatures using the formula proposed by ALMOND and WEST [14].
��(��) = 2��DC (2)
The hopping rate (��p) has been calculated from the conductance spectra for all the samples at different temperatures given in Table 1. The magnitude of the carrier-concentration term (K) can be obtained from the following formula [15]:
Table 1 Transport parameters of doped and undoped LiNiPO4
K=��T/��p (3)
The charge carrier concentration term remains almost constant over the temperature range studied for all the samples as shown in Table 1. This reveals that all the lithium ions which are responsible for the conductivity are in a mobile state.
3.4 Modulus spectra analysis
In 1970��s many researchers opted to study the dielectric response caused by ion relaxation using the reciprocal quantity, M*=��*=M'+jM''=j��CoZ*, known as the electric modulus [16, 17], in which the electrode polarization artifacts are suppressed where M' and M'' are the real and imaginary parts of modulus; Z* is complex impedance; Co is the vacuum capacitance of the empty measuring cell; ��(��=2nf, where f is the frequency) is the angular frequency; j=(-1)1/2. Typical features of modulus spectrum include a broad, asymmetric peak in the imaginary part and a sigmoidal step in the real part. This feature is due to the storage of mechanical stress associated with relaxation processes of the conducting species. Figure 5 shows the frequency dependence of M'' at various temperatures for europium-doped and undoped LiNiPO4. The broadened nature of the peaks can be interpreted with the distributions of relaxation time.
The maximum of modulus spectra M''(��max) shifts towards the higher frequencies with increase in temperature. This behavior suggests that the dielectric relaxation is activated thermally in which hopping process of charge carriers takes place [18]. Also, shifting of the peak frequencies in the forward direction with temperature implies that the relaxation time decreases with increase in temperature. The angular frequency ��max corresponding to M''(��max) gives the relaxation time (��c) under the condition of ��max��c=1. Values of relaxation time (��c) for both samples are given in Table 1. The non-exponential conductivity relaxation can be described by a Kohlrausch Williams Watt (KWW) function ��(t), which represents the distribution of relaxation time in ion conducting materials [19]. The electric modulus can be represented as:
M*=M�� (4)
(4)
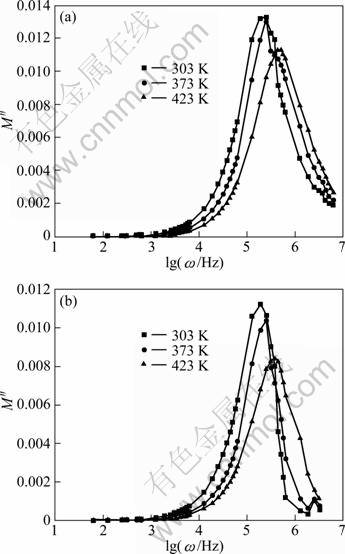
Fig. 5 Modulus spectra for samples of LiNiPO4 (a), Eu-doped LiNiPO4 (b)
And
��(t)=��0 (5)
(5)
where ��0 is the conductivity relaxation time and �� is the Kohlrausch exponent. The parameter �� is most often interpreted as a result of correlated motions between ions. This means that the jump of a mobile ion in a material cannot be treated as an isolated event. The parameter �� corresponding to the studied sample was established as a function of temperature using modulus formalism. Using the modulus formalism, i.e., M'' spectrum, the corresponding full width half height (FWHH) is wider than the breadth of the Debye peak (1.14 decades) and thus results in a value of ��=1:14/FWHH. The parameter �� has been calculated for all the samples tabulated in Table 1. The low �� value, i.e., high FWHM, of both samples reveals non-Debye nature of this material. The non-Debye property of the materials arises due to the presence of unequal potential barriers for the conduction species [20-24].
4 Conclusions
Europium-doped and undoped LiNiPO4 have been prepared by Pechini technique. TG�CDTA analysis and XRD pattern con?rm the formation of the sample. The conductivity and modulus properties of the materials have been investigated with the help of complex impedance spectroscopy technique. From conductance spectra, conductivity parameters such as hopping frequencies and the charge carrier concentration term have been calculated using the Almond and West formalism. The ionic conductivity of LiNiPO4 is enhanced by around one order of magnitude by doping europium. The distribution of relaxation time, which causes the non-Debye nature of the material, has been explained from the broad nature of the modulus spectra.
Acknowledgment
One of the authors (M. PRABU) is thankful to authorities of Department of Science and Technology/ Japan Science and Technology for offering a JRF position in the DST/JST project.
References
[1] PADHI A K, NANJUNDASWAMY K S, GOODENOUGH J B. Phospho-olivines as positive-electrode materials for rechargeable lithium batteries [J]. J Electrochem Soc, 1997, 144: 1188-1193.
[2] MA J, QIN Q I. Electrochemical performance of nanocrystalline LiMPO4 thin-films prepared by electrostatic spray deposition. [J]. J Power Sources, 2005, 148: 66-71.
[3] OKADA S, SAWA S, EGASHIRA M, YAMAKI J, TABUCHI M, KAGEYAMA H, KONISHI T, YOSHINO A. Cathode properties of LiMPO4for lithium secondary batteries [J]. J Power Sources, 2001, 97-98: 430-432.
[4] HUANG H, YIN S C, NAZAR L F. Approaching theoretical capacity of LiFePO4 at room temperature at high rates [J]. Electrochem Solid-State Lett, 2001, 4: A170-A172.
[5] CHEN Z, DAHN J R. Reducing the amount of carbon in LiFePO4/C composite electrodes to maximize specific energy, volumetric energy and tap density [J]. J Electrochem Soc, 2002, 149: A1184-A1189.
[6] CHUNG S Y, BLOKING J T, CHIANG Y M. Electronically conductive phospho-olivines as lithium storage electrodes [J]. Nature Materials, 2002, 1: 123-128.
[7] NI J F, ZHOU H H, CHEN J T, ZHANG X X. LiFePO4doped with ions prepared by co-precipitation method [J]. Materials Letter, 2002, 59: 2361-2365.
[8] WANG G X, NEEDHAM S, YAO J, WANG J Z, LIU R S, LIU K H. A study on LiFePO4and its doped derivatives as cathode materials for lithium-ion batteries [J]. J Power Sources, 2006, 159: 282-286.
[9] SHI S Q, LIU L J, OUYANG C Y. Enhancement of electronic conductivity ofLiFePO4by Cr doping and its identification by first-principles calculations [J]. Phys Rev B, 2003, 68: 195108.
[10] PECHINI M P. Method of preparing lead and alkaline earth titanatesandniobates and coatingmethod using thesame to form acapacitor: U.S. 3330697 [P]. 1967-07-11.
[11] JONSCHER A K. The universal dielectric response [J]. Nature, 1977, 267: 673-678.
[12] SEVASEKARAPANDIAN S, BHUVANESWARI M S, VIJAYAKUMAR M, RAMYA C S, ANGELO P C. A comparative study on ionic conductivity of Sr and Mg stabilized zirconia by impedance spectroscopy [J]. J Europ Ceram Soc, 2005, 25: 2573-2575.
[13] FUNKE K.Ion transport in fast ion conductors [J]. SolidState Ionics, 1997, 94: 27-33.
[14] ALMOND D P, WEST A R. Mobile ion concentrations in solid electrolytes from an analysis of a.c. conductivity [J]. Solid State Ionics, 1983, 9-10: 277-282.
[15] ALMOND D P, DUNCAN G K, WEST A R. Analysis of conductivity prefectors and ion hopping rates in AgI-Ag2MoO4 glass [J]. J Non-Cryst Solids, 1985, 74: 285-301.
[16] BRADA Y. Electrical conductivity of ZnS crystals: ZnS crystals as quasi-one-dimensional conductors [J]. Phys Rev B, 1989, 39: 7645-7651.
[17] SINGCLAIR D C, WEST A R. Impedance and modulus spectroscopy of semiconducting BaTiO3showing positive temperature coefficient of resistance [J]. J Appl Phys, 1989, 66(8): 3850-3856.
[18] NADKARNI G S, SIMMONS J G. Electrical properties of evaporated molybdenum oxide films [J]. J Appl Phys, 1970, 41: 545-551.
[19] WILLIAMS G, WATTS D C. Non-symmetrical dielectric relaxation behaviour arising from a simple empirical decay function [J]. Trans Faraday Soc, 1970, 66: 80-85.
[20] BHUVANESWARI M S, SELVASEKARAPANDIAN S, VIJAYAKUMAR M, HIRANKUMAR G. Ion dynamic studies on Li3CaZr(PO4)3 [J]. Materials Science, 2004, 39: 727-729.
[21] SAVITHA T, SELVASEKARAPANDIAN S, RAMYA C S, BHUVANESWARI M S, ANGELO P C. Electrical conduction and relaxation mechanism in Li2AlZr[PO4]3 [J]. Materials Science, 2007, 42: 5470-5475.
[22] SAVITHA T, SELVASEKARAPANDIAN S, RAMYA C S. Structural and electrical conductivity studies of LixAlZr[PO4]3 (x=1.8, 2.0, 2.2), solid electrolyte for lithium-rechargeable batteries [J]. J Solid State Electrochem, 2008, 12: 857-860.
[23] VIJAYAKUMAR M, SELVASEKARAPANDIAN S. Transport properties of LixV2O5 (x=0.6-1.6) electrode material [J]. Materials Research Bulletin, 2003, 38: 1735-1743.
[24] VIJAYAKUMAR M, SELVASEKARAPANDIAN S. Frequency- dependent conductivity and dielectric studies on LixV2O5 (x=0.6�C1.6) [J]. Solid State Ionics, 2002, 148: 329-334.
Eu���Ӷ�LiNiPO4�����Ե�Ӱ��
M. PRABU1, 2, S. SELVASEKARAPANDIAN2, A. R. KULKARNI1,
S. KARTHIKEYAN3, C. SANJEEVIRAJA4
1. Department of Metallurgical Engineering and Material Science, Indian institute of Technology Bombay,Mumbai, India;
2. Department of Physics, Kalasalingam University, Krishnankoil-626 126, Tamilnadu, India;
3. School of Advanced Sciences, VIT University, Vellore 632 014, Tamilnadu, India;
4. Department of Physics, Alagappa University, Karaikudi-630 003, Tamilnadu, India
ժ Ҫ������Pechini�����Ʊ��˲���Eu��δ����Eu��LiNiPO4�����ͨ�����ط����Ͳ��ȷ���(TG/DTA) ��ȷ��LiNiPO4�������¶ȡ���ĩX����������֤ʵ���õ��Ļ�����Ϊ���������ṹ�Ĵ�LiNiPO4�����ø����迹����������Ʒ�ڲ�ͬ���¶Ⱥ�Ƶ���µĵ絼�ʺ�ģ���ס�����Almond��West ��ʽ���㵼�����ܲ�����������ԾǨƵ�ʡ��������Ũ�ȡ� ����1.0% Eu��LiNiPO4�����ӵ絼��������һ������������ģ����������LiNiPO4�������д��ڷǵ°����͵ij�ԥ��
�ؼ��ʣ�LiNiPO4�����ӵ����ԣ��迹�ף����ӣ�ԾǨ
(Edited by YANG Hua)
Corresponding author: S. SELVASEKARAPANDIAN; Fax: +91-4563-289303; E-mail: sekarapandian@rediffmail.com
DOI: 10.1016/S1003-6326(11)61181-3

