AuCu3-�Ǹ���ϵͳ�ĺϽ����Gibbs����ֺ�����ƽ��ȫϢ������ͼ
��Դ�ڿ����й���ɫ����ѧ��(Ӣ�İ�)2014���11��
�������ߣ�л���� ��С�� ���ı� ��ҫׯ ���콨
����ҳ�룺3585 - 3610
�ؼ��ʣ�AuCu3�����AuCu3-���Ǹ���ϵͳ���Ͻ����Gibbs����ֺ�����ƽ��ȫϢ������ͼ��ϵͳ�������Ͽ�ѧ
Key words��AuCu3 compound; AuCu3-type sublattice system; alloy gene Gibbs energy partition function; equilibrium holographic network phase diagram; systematic metal materials science
ժ Ҫ����AuCu3-�Ǹ���ϵͳΪ��������3��֣���һ�������谭�������Ͽ�ѧ�����ĵ������ϰ����о�����ϰ����ƽ�����ת���˼ά��ʽ��ʶ�¶ȼ��仺���仯�ĺϽ����ʵ������Ȼ����ʵ������Ĵ�����ʶΪѡ����Ϣ������Gibbs�ܺ�������ν�ġ�ƽ����ͼ�����ڶ���AuCu3-���Ǹ���ϵͳ��ƽ��ȫϢ������ͼ������������ɷֺ��¶��йصĺϽ�������нṹ��������ѧ���ʵ�ϵͳ����ԣ�������ÿ���Ͻ��ƽ��ת�䶼�Ǿ��ȵĵ���ת�䣬���ǷǾ��ȵ�˫��ת�䣬����һ��û�������������������ĵ�������ߣ�����߶���ɷֺ��¶�Զƫ��AuCu3�������ٽ��ļ����ɷֺ��¶ȡ�
Abstract: Taking AuCu3-type sublattice system as an example, three discoveries have been presented: First, the third barrier hindering the progress in metal materials science is that researchers have got used to recognizing experimental phenomena of alloy phase transitions during extremely slow variation in temperature by equilibrium thinking mode and then taking erroneous knowledge of experimental phenomena as selected information for establishing Gibbs energy function and so-called equilibrium phase diagram. Second, the equilibrium holographic network phase diagrams of AuCu3-type sublattice system may be used to describe systematic correlativity of the composition-temperature-dependent alloy gene arranging structures and complete thermodynamic properties, and to be a standard for studying experimental subequilibrium order-disorder transition. Third, the equilibrium transition of each alloy is a homogeneous single-phase rather than a heterogeneous two-phase, and there exists a single-phase boundary curve without two-phase region of the ordered and disordered phases; the composition and temperature of the top point on the phase-boundary curve are far away from the ones of the critical point of the AuCu3 compound.
Trans. Nonferrous Met. Soc. China 24(2014) 3585-3610
You-qing XIE1,2,3, Xiao-bo LI4, Xin-bi LIU1,2,3, Yao-zhuang NIE5, Hong-jian PENG6
1. School of Materials Science and Engineering, Central South University, Changsha 410083, China;
2. Powder Metallurgy Research Institute, Central South University, Changsha 410083, China;
3. State Key Laboratory of Powder Metallurgy, Central South University, Changsha 410083, China;
4. College of Materials Science and Engineering, Xiangtan University, Xiangtan 411105, China;
5. School of Physical Physics and Electronics, Central South University, Changsha 410083, China;
6. School of Chemistry and Chemical Engineering, Central South University, Changsha 410083, China
Received 5 September 2014; accepted 5 November 2014
Abstract: Taking AuCu3-type sublattice system as an example, three discoveries have been presented: First, the third barrier hindering the progress in metal materials science is that researchers have got used to recognizing experimental phenomena of alloy phase transitions during extremely slow variation in temperature by equilibrium thinking mode and then taking erroneous knowledge of experimental phenomena as selected information for establishing Gibbs energy function and so-called equilibrium phase diagram. Second, the equilibrium holographic network phase diagrams of AuCu3-type sublattice system may be used to describe systematic correlativity of the composition-temperature-dependent alloy gene arranging structures and complete thermodynamic properties, and to be a standard for studying experimental subequilibrium order-disorder transition. Third, the equilibrium transition of each alloy is a homogeneous single-phase rather than a heterogeneous two-phase, and there exists a single-phase boundary curve without two-phase region of the ordered and disordered phases; the composition and temperature of the top point on the phase-boundary curve are far away from the ones of the critical point of the AuCu3 compound.
Key words: AuCu3 compound; AuCu3-type sublattice system; alloy gene Gibbs energy partition function; equilibrium holographic network phase diagram; systematic metal materials science
1 Introduction
Early in 1937, SLATER [1] pointed out that ��Further progress in the theory is likely to come more and more from cooperation between theoretical physicists and metallurgists, and the advance of physical metallurgy in the next few years is likely to be almost as dependent on the electron theory of metals as the advances of the last generation were dependent on thermodynamics and theory of solutions��. Since then, the electron theory of alloy phases has been developed along the quantum mechanical band theory��quantum mechanical abinitio calculations (QMAC)��QMAC- thermodynamics [2-8], then the QMAC-community has been formed. The thermodynamics of alloy phases has been developed along the statistic thermodynamics of alloy phases��calculation of phase diagrams (CALPHAD)-thermodynamics [9-17], then the CALPHAD-community has been formed. However, most of the design and testing of alloys are currently performed through time-consuming and repetitive experiment. This situation should be attributed to some existing barriers hindering progress in thermodynamics and electron theory of alloys. In order to discover, develop, manufacture, and deploy advanced materials in a more expeditious and economical way, the materials genome initiative (MGI) was proposed, where the ��materials genome�� was given a rather vague definition [18]. Recently, the materials genome was defined as ��a set of information (databases) allowing predication of a material��s structure, as well as its response to processing and usage conditions�� [19]. We would say that it is not a good way, because the main barriers hindering the progress in thermodynamics and electron theory of alloys can not be removed by this way: First, they have not found the alloy gene (AG) sequence and AG-Gibbs energy level sequence, then the AG- Gibbs energy partition function cannot be established, and the real Gibbs energy function cannot be derived; Second, they have not found the reason for keeping structure stabilization of alloys against changing temperature and the atom movement mechanism to change structure for suiting variation in temperature; Third, up to now, researchers have got used to recognizing the experimental phenomena observed during very slow variation in temperature to be thermodynamic equilibrium [20-25], lacking an essential definition of the thermodynamic equilibrium order-disorder transition: 1) The middle jumping Tj-temperature is erroneously considered as the terminal Tc-critical temperature of order-disorder equilibrium transition of the alloy, although the experimental jumping ��j-order degree is 0.8-0.7, and the experimental short range order degree exists at the temperatures considerable above the Tj- temperature; 2) The composition-dependent Tj(x)-points are erroneously considered as the phase boundary points of phase diagram of the AuCu3-type sublattice system; 3) The heterogeneous ��subequilibrium statistic region- scale heterogeneity�� with the same composition and different order degrees is erroneously considered two heterogeneous ��equilibrium two-phase region�� consisting of ordered and disordered phases, and it was pointed out that ��if the ordering reaction was a heterogeneous one, the equilibrium diagram would show the ordered phase separated from the disordered phase by a two-phase region�� [21]; 4) They hold that the stoichiometric Au3Cu-, AuCu- and AuCu3-compounds in the Au3Cu-, AuCu- and AuCu3-type sublattice systems have the lowest potential energies at 0 K and the highest Tc-critical temperatures on their phase boundary curves, respectively. The researchers in the QMAC-and CALPHAD-communities took these erroneous understandings of experimental phenomena as the selected information, then adjusted parameters in Gibbs energy functions and established so-called equilibrium phase diagrams to achieve the best representation of the selected information [19] (see Appendix A.1).
In order to quickly and efficiently discover advanced alloys, the systematic metal materials science (SMMS) was established by new thinking modes and methods of system sciences [26]. Recently, taking AuCu-sublattice system as an example, the AG- sequences, which are the central characteristic atom  - and
- and  sequences in the basic coordination cluster sequences of the Au-Cu system, were presented, the AG-holographic information database of the fcc-based lattice Au-Cu system, the AG-Gibbs energy partition function and alloy gene arranging (AGA)- Gibbs energy function of the AuCu-type sublattice system were established, according to AG-Gibbs energy level sequences in the AG-holographic information database, and its equilibrium holographic network phase (EHNP) diagrams were obtained, according to the definition of equilibrium order-disorder transition [27]. Taking experimental path on disordering AuCuI (
 ) composed of the
  and
and  stem alloy genes as an example, three discoveries and a method were presented: 1) The ability of AuCuI () to keep structure stabilization against changing temperature is attributed to that the and
  potential well depths greatly surpass their vibration energies, which leads to the subequilibrium of experimental path; 2) A new atom movement mechanism of AuCuI () to change structure for suiting variation in temperature is the resonance activating- synchro alternating (RA-SA) mechanism of alloy genes, which leads to heterogeneous and successive subequilibrium transitions; 3) There exists jumping order degree (see Appendix A.2), which leads to the existence of jumping Tj-temperature and an unexpected so-called ��retro-effect�� about jumping temperature retrograde shift to lower temperatures upon the increasing heating rate. A set of subequilibrium holographic network path charts was obtained by the experimental mixed enthalpy path method [28].
In the present work, taking AuCu3-type sublattice system as an example, the steps for establishing equilibrium holographic network phase diagrams ((EHNP)-diagrams) and the main characteristics of these EHNP-diagrams have been presented, which are unexpected by today��s researchers, and SGTE-database and AG-database, the critical temperature, and the subequilibrium statistic region-scale heterogeneity with the same composition and different order degrees, and equilibrium two-phase region with different composition ordered and disordered phases have been discussed.
2 AG-Gibbs energy partition function
Based on the AG-Gibbs energy sequences and alloy gene arranging (AGA)-Gibbs energy level model, the AG-Gibbs energy partition function of the fcc-based lattice Au-Cu system was established, which is used to describe the systematic correlativity of the AG-Gibbs energy levels ( ,
, ), AG-probabilities (
 ,
,  ) occupied at the AG-Gibbs energy levels and degeneracy factor of the AG-probabilities
  as functions of the composition (x), temperature (T) and order degree (��):

 (1)
(1)
where kB is Boltzmann��s constant, and  is the characteristic Gibbs energy function of the alloy phase, which may be obtained by the transmission law of the AG-Gibbs energies:

 (2)
(2)
The AGA-total Gibbs energy function of the alloy phase may be derived from the  -function:

 (3)
(3)
The total configurational entropy  - function is obtained from the degeneracy g-factor:
 (4)
(4)
It should be pointed out that these functions may be suitable for Au3Cu-, AuCu- and AuCu3-type sublattice systems (��>0), as well as disordered alloy phase (��=0) and other type subequilibrium ordered phases, such as the statistic periodic antiphase (SPAP) AuCuII [28,29]. However, their ordering definitions are different, of which the details can be seen in Refs. [27,30].
3 EHNP-diagrams of AuCu3-type sublattice system
3.1 Essential definition of equilibrium order-disorder transition
An equilibrium order-disorder transition for a given composition alloy is defined as that ��the AG-Gibbs energy levels (, ) and AG-probabilities (
 ,
, ) occupied at the
  - and -energy levels can respond immediately and change synchronously with each small variation in temperature and proceed along the minimal Gibbs energy path, supposing that there is no obstacle to atom movement��. It has following general behaviors: 1) The order-disorder transition upon heating and disorder- order transition upon cooling proceed along the same minimal mixed Gibbs energy
  path, namely, there exists no so-called hysteresis phenomenon between both transitions; 2) The path is continuous and homogenous, and has no jumping phenomenon, namely, single-phase homogeneous transition path; 3) The
  critical temperature is determined by the crosspoint of and
  curves, and independent of experimental conditions.
3.2 Steps for establishing EHNP-diagrams
The man��s knowledge of relationships of structures, properties and temperature for alloys has been changed from single causality to systematic correlativity, due to the discovery of alloy gene  and sequences and establishment of their AG-information database, as well as AGA-Gibbs energy function derived from the AG-Gibbs energy partition function. The systematic correlativity of the AuCu3-type sublattice system may be described by a set of EHNP diagrams, which are obtained by following steps:
1) According to the and level sequences, mixed Gibbs energy  -function and essential definition of equilibrium order-disorder transition, the systematic correlativity of the
  ,
,  ,
,  ,
, and
and  paths on equilibrium order-disorder transition as function of temperature for the stoichiometric AuCu3-alloy are calculated by the minimal mixed Gibbs energy
  path method, which includes the iso-order degree Gibbs energy
  path method (Fig. 1(a)) and the isothermal Gibbs energy
  path method (Fig. 1(b)), using calculated steps ��T=1 K and ����=0.0001. According to the and paths, the EHNP charts of the stoichiometric AuCu3-alloy are calculated by Eqs. (5)-(8) and shown in Appendix B.
2) By analogy with the first step, the systematic correlativity data of the  ,
,  ,
,  ,
,  and
and  paths on equilibrium order-disorder transition as function of composition and temperature for alloys of the AuCu3-type sublattice system are calculated, using calculated steps ��x=0.5% (mole fraction), ��T=1 K, ����=0.0001.
3) According to the systematic correlativity data of the 
 , and
, and  the three-dimensional


 and
and  EHNP diagrams, as well as their two-dimensional
  ,
,  and
and  phase diagrams and configuration entropy EHNP diagrams are constructed and shown in Figs. 2-5.
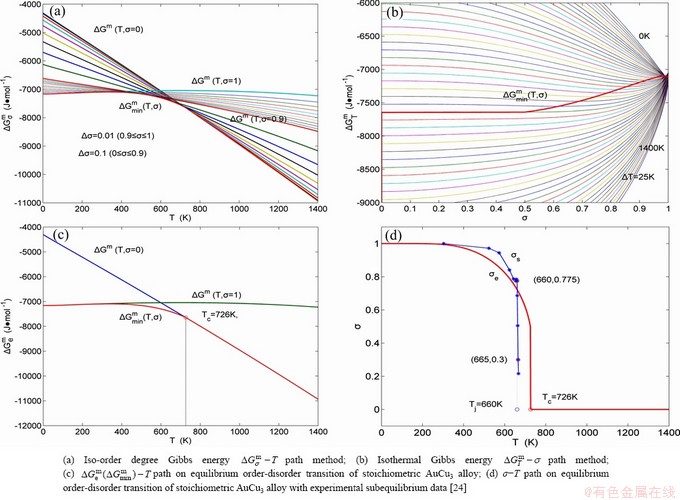
Fig. 1 Minimal mixed Gibbs energy  path on equilibrium order-disorder transition of stoichiometric AuCu3 alloy

Fig. 2 Mixed Gibbs energy EHNP diagrams of AuCu3-type sublattice system

Fig. 3 Order degree EHNP diagrams of AuCu3-type sublattice system

Fig. 4 AG-concentration EHNP diagrams
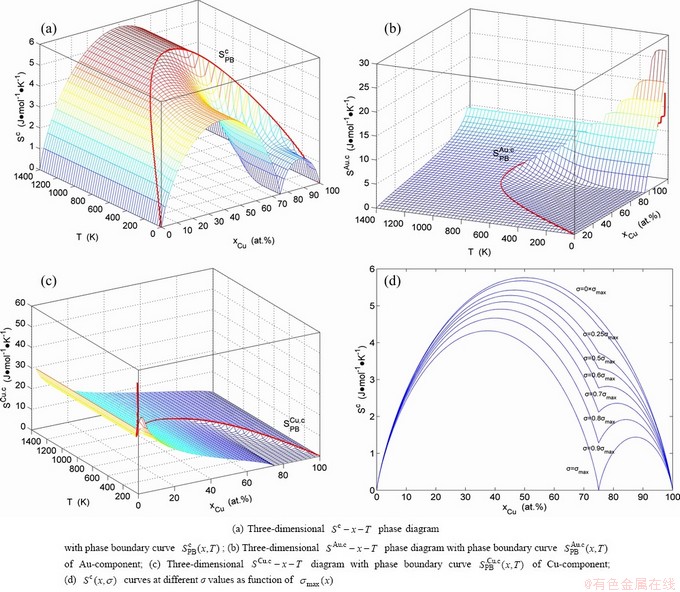
Fig. 5 Configuration entropy EHNP diagrams of AuCu3-type sublattice system
4) According to the first order thermodynamic properties in the AG-database and and EHNP diagrams, the EHNP diagrams of the first order thermodynamic properties of the AuCu3-type sublattice system are calculated by their transmission laws, which may be also called as the additive law of extensive q-properties of characteristic crystals [31]:
 (5)
(5)
where q denotes characteristic Gibbs energy (G*), enthalpy (H), potential energy (E) , volume (v), generalized vibration free energy (Xv), generalized vibration energy (Uv) or generalized vibration entropy (Sv).
5) The EHNP diagrams of the second order thermodynamic properties (mixed heat capacity and mixed volume expansion coefficient) are calculated by following equations [27]:
 (6)
(6)
 (7)
(7)
6) The EHNP diagrams of the activities of the Au- and Cu-components are calculated by following equation [27]:
 (8)
(8)
7) The composition-temperature-dependent  ,
,  and
and  -x-T phase boundary (PB) curves are calculated by difference method of Gibbs energies between ordered and disordered phases (see Appendix A.4).
8) According to the and  phase boundary curves, the other qPB-x-T phase boundary curves are calculated by Eqs. (5)-(8).
3.3 Mixed Gibbs energy EHNP diagrams
The mixed Gibbs energy EHNP diagrams include a three-dimensional  network phase diagram and three two-dimensional
  ,
,  and
and  path network phase diagrams (Fig. 2). In these diagrams, once one network point
  has been clicked, the information about composition (x), temperature (T) and mixed Gibbs energy (��Gm) may be readily obtained.
From Fig. 2(a), the following main understandings may be obtained: 1) There are ordered single-phase region with Gibbs energy network points (denoted by the symbol ��O��) and disordered single-phase region with Gibbs energy network points (denoted by the symbol ��D��). 2) The  -phase boundary (PB) curve with Gibbs energy network points is obtained by difference method of Gibbs energies between ordered and disordered phases. By this method, it has been proved that there is a single-phase boundary curve rather than a boundary two-phase region of ordered and disordered phases (see Appendix A.4). 3) The equilibrium state of the stoichiometric AuCu3 compound, of which the alloy gene arranging (AGA)-molecular formula is the
  , exists only at the network C-point (xCu=75%, T=0 K, ��Gm=��E=-7163.61 J/mol).
From Fig. 2(b), the following main understandings may be obtained: 1) The critical network point of the stoichiometric AuCu3 alloy, i.e., phase boundary point is located at the network C-point (xCu=75%, Tc=726 K, ��G=-7645.47 J/mol). 2) The Au48.35Cu51. 65 alloy has the highest critical temperature in the AuCu3-type sublattice system, it is located at the network H-point (xCu=51.65%, Tc=837 K, ��Gm=-10232.83 J/mol). 3) The equilibrium  path for a given composition (x) alloy is the standard path for determining Gibbs energy hysteresis effect, i.e., superheated and undercooled driving Gibbs energies (
 ) of experimental
  path.
path.
From Fig. 2(c), we can know that the lowest temperature points of the iso-mixed Gibbs energy curves move from the network L-point (xCu=70.35%, T=0 K, ��Gm=��Em=-7203.16 J/mol) to the network H-point (xCu=51.65%, Tc=837 K, ��Gm= -101232.83 J/mol), that is unexpected by today��s researchers.
From Fig. 2(d), we can know that the Au29.65Cu70.35 alloy with the lowest potential energy is located at the network L-point, it slightly deviates from the C-point, that is also unexpected by today��s researchers. This diagram will be used to establish EHNP diagrams of the Au-Cu system together with isothermal diagrams of the AuCu-type and Au3Cu-type sublattice systems.
3.4 Order degree EHNP diagrams
The order degree EHNP diagrams include a three-dimensional ��-x-T network phase diagram and three two-dimensional ��x-T, T��-x and ��T-x path network phase diagrams (Fig. 3). In these diagrams, once one network point has been clicked, the information about composition (x), temperature (T) and order degree (��), as well as the mixed Gibbs energy (��Gm) may be readily obtained, because the order degree EHNP diagrams have been attached to the mixed Gibbs energy EHNP diagrams.
From Fig. 3(a), the following main understandings may be obtained: 1) There are ordered phase region with order degree network points (denoted by the symbol ��O��, ��>0), disordered phase region (denoted by the symbol ��D��, ��=0) and ��PB(x, T)-phase boundary (PB) curve (��=0). 2) The equilibrium state of the  compound exists only at the network C-point (xCu=75%, T=0 K, ��=1).
From Fig. 3(b), we can know that: 1) The equilibrium ��x,e-T paths of alloys on the Au-rich side of the compound have great difference from the ones of alloys on the Cu-rich side of the compound. 2) The Au48.35Cu51.65 alloy in the single AuCu3-type sublattice system has the highest critical temperature, its network H-point (xCu=51.65%, Tc=837 K, ��=0) deviates far from the network point (xCu=75%, Tc=663 K, ��=0) of stoichiometric AuCu3 alloy. However, their network points are respectively (xCu=51.65%, ��=0.6887) and (xCu=75%, ��=1) at 0 K. 3) The equilibrium  path for a given composition (x) alloy is the standard path for studying subequilibrium
  paths. These phenomena can not be expected in the QMAC- and CALPHAD-thermodynamics.
From Fig. 3(c), we have discovered surprising phenomena: 1) All experimental middle jumping Tj-temperatures (denoted by symbols ��� [32] and ������ [33], which were erroneously considered the so-called T��c-critical temperatures of equilibrium order-disorder transition of alloys, approach to equilibrium iso-order degree  curve. For the stoichiometric AuCu3 alloy, the experimental jumping order degree is ��j=0.775 at the jumping temperature Tj=660 K and the low order degree is ��L=0.3 at T=665 K (Fig. 1(d)) [24], as well as that the short-range order degree persists to above the Tj-temperature [25]. Therefore, the experimental jumping temperature cannot represent the critical temperature of equilibrium order-disorder transition. 2) The highest temperature points of the iso-order degree T��-x curves move from the network C-point (xCu=75%, T=0 K, ��=1) to the network H-point (xCu =51.65%, Tc=837 K, ��=0).
Figure 3 (d) shows that the network points of alloys with jumping-phenomena of order-disorder transition should be situated in the range from A-point to B-point, i.e., 0.755�ܦҡ�1 and 56.625%��xCu��81.125%. These phenomena show that the experimental order-disorder transition belongs to subequilibrium.
3.5 AG-concentration EHNP diagrams
From Fig. 4, the following main understandings may be obtained: 1) The AG-concentration EHNP diagrams, which are used to describe the AG-arranging structures of alloy phases, may be described by two modes: three-dimensional  and
and  network phase diagrams (Figs. 4(a) and (b)) in the AGA- crystallography [34], where the
  and
and  are the probabilities occupied at the lattice points; three-dimensional
  and
and  network phase diagrams, (Figs. 4(c) and (d)) in the AGA-Gibbs energy level theory, where the and are the probabilities occupied at the and energy levels. 2) There exists an emergent phenomenon of some AG-concentrations in the ordered alloy phases, which are defined as that some AG-concentrations in the ordered state are larger than thoes in disorder state, such as
  ,
,  ,
,  and
and  (Figs. 4(c), (d), (e) and (f)). 3) The equilibrium
  and
and  paths for a given composition (x) alloy may be described by three-dimensional and equilibrium path charts (Figs. 4(g) and (h)) or two-dimensional
  and
and  , as well as
  and
and  equilibrium path charts. The essential on disordering compound is that the
  and
and  stem alloy genes are split into and
  sequences in the disordered state. 4) It can be known that each kind of q-EHNP diagram includes not only the 4-type diagrams indicated above, but also other-type diagrams. These AG-concentration equilibrium path charts will provide standard path charts for studying kinetic mechanism of experimental subequilibrium order-disorder transition path.
3.6 Configuration entropy EHNP diagrams
The configuration entropy () EHNP diagrams have been established, based on the degeneracy  -function in the AG-Gibbs energy partition ��(x,T)-function. From Fig. 5, we have obtained following main understandings: 1) The configuration entropy of each ordered alloy can change continually from the configuration entropy of the maximum order degree
  state to one of the ideal disordered states. It means that we should take the ideal disordered state as the standard. 2) The structural units used for calculating configuration entropy should be in agreement with the structural units used for calculating corresponding Gibbs energy levels. These are two rules to establish partition function. However, these rules are often neglected in the currently used thermodynamic models of the QMAC- and CALPHAD-thermodynamics.
3.7 EHNP diagrams of other thermodynamic properties
According to and EHNP diagrams obtained from  diagram, we have obtained
  EHNP diagrams of other thermodynamic properties of AuCu3-type sublattice system, which are shown in Appendix C. It should be emphasized that from each three-dimensional EHNP diagram, we can obtain isocompositional , isoproperty
  and isothermal path phase diagrams. The diagrams from Section 3.3 through the present section are interconnected to form a big holographic network information database about structures, properties and their variations with composition and temperature of alloys. Therefore, the knowledge of relationships of structures, properties and environments for alloys has been changed from single causality to systematic correlativity. Once one network point in any EHNP diagram above has been clicked, the information about composition, temperature, order degree, AGA-structure and a set of thermodynamic properties of the alloy as well as its equilibrium order-disorder transition EHNP charts may be readily obtained, which are very useful for materials engineers to design advanced alloys.
4 Discussion
4.1 Discussion on SGTE-database and AG- holographic information database
The SGTE-database established by Scientific Group Thermodata Europe compile Gibbs energies, i.e., the so-called lattice stability, of 78 pure elements with fcc, hcp and bcc based lattices and liquid state are tabulated, which are widely adopted within the CALPHAD- community. The SGTE-Gibbs energy function is represented as a power series in terms of temperature T in form of G=a+bT+cTln(T)+ . From this expression, other thermodynamic functions can be evaluated [35]. However, it does not reveal the essence of Gibbs energies of pure elements.
The AG-holographic information database includes the potential energies and volumes of AG-sequences at 0 K temperature obtained by the separated theory of potential energies and volumes of characteristic atoms, the valence electron structures and physical properties of AG-sequences obtained by the valence bond theory of characteristic crystals and the thermodynamic properties of AG-sequences obtained by the thermodynamics of characteristic crystals [27]. The flow charts for establishing AG-holographic information database of the fcc-based lattice Au-Cu system are presented in Appendix D. The AG-holographic information database has following characteristics: 1) In the Au-Cu system with fcc-based lattice, the primary  and
and  characteristic crystals are respectively the pure Au-metal and pure Cu-metal with fcc-based lattice. The Gibbs energy function of pure metals in the SGTE-database is equivalent to the AG-Gibbs energy function of the primary characteristic crystals. However, the AG-Gibbs energy function is a complex function, i.e.,
  obtained from other thermodynamic properties, which reveals the essence of AG-Gibbs energies. 2) The AG-holographic information database of the fcc-based lattice Au-Cu system may be used to establish equilibrium and subequilibrium holographic network phase diagrams of the Au3Cu-, AuCu-, and AuCu3-type sublattice systems, as well as Au-Cu system. It means that all alloy phases share a set of and level sequences and other properties sequences.
4.2 Discussion on critical temperature
Many experimental results show that the order degree of order/disorder transition decreases slowly initially, then becoming more rapid until the so-called Tc-critical temperature is achieved, followed by a ��tailing-off��. The fact that the completion of the disordering process occurs slowly is borne out by the detection of short-range order at temperatures considerably above the so-called critical temperature [20,25]. Therefore, it was pointed out that the meaning of a critical temperature is at the best uncertainty in view of the results of the present experiment. However, since the term has had such venerable usage, and since a critical temperature can be defined from the results of long-range order studies, we have defined the ��critical�� temperature by an extrapolation of the relatively precipitous portion of the curves of S (order degree) versus temperature. No particular significance is attached to this, other than experimental uncertainty [21].
In the QMAC-thermodynamics and CALPHAD- thermodynamics, a particular significance is attached to the so-called critical temperature, which is considered the assessed Tc-critical temperature of the order- disorder equilibrium transition and the composition- dependent Tc-x curve is considered selected information about phase boundary of order-disorder equilibrium transition for fitting the parameters in the Gibbs energy functions to achieve the best representation of the selected information. Therefore, the phase diagram calculated in this way not only is not real equilibrium but goes so far to be erroneous (see Appendix A.1).
In the AGA-thermodynamics, the Tc-critical temperature is defined as the beginning temperature of perfect disordering during the equilibrium order-disorder transition, which may be obtained by the cross point of the and  curves of ordered and disordered phase for a given compositional alloy in the solid Au-Cu system. The composition-dependent Tc-x curve for a given ordered sublattice system is defined as the phase boundary curve between the ordered and disordered phases, which may be obtained by the equilibrium mixed Gibbs energy path method of alloys or by the difference method of Gibbs energies between the ordered and disordered phases, and the experimental so-called Tc-critical temperature is called as the Tj-jumping temperature arisen from existing critical ��j-jumping order degree(see Appendix A.2). The all experimental Tj-values fall within the 0.60<��<0.85 region in Figs. 3(c) and (d), which are dependent on heating rate and composition of alloys (see Appendix A.3).
4.3 Discussion on subequilibrium statistic region-scale heterogeneity
Up to now, researchers have got used to recognizing the experimental phenomena observed during very slow variation in temperature to be thermodynamic equilibrium, and then treating experimental phenomena by equilibrium theory and method, lacking a real equilibrium theory and a standard path of order-disorder transition. For example, the order-disorder transition in Au-Cu alloys containing 65.8%-84.5%Cu (atomic fraction) was accomplished by observing high-angle fundamental X-ray reflections from single crystals, at temperatures ranging from room temperature to 450 ��C (723 K). The conclusions indicate that the transition is a classical phase change with ordered and disordered phases presented in equilibrium for alloys containing less than 75% Cu, and the equilibrium diagram would show the ordered phase separated from the disordered phase by a two-phase region [21].
According to the essential definition of equilibrium order-disorder transition(see Section 3.1), there is no coexisting temperature range of ordered and disordered phases, during the equilibrium transition process for a given compositional alloy, which may be proved by the iso-order degree (or isothermal) Gibbs energy equilibrium path method (see Fig. 1) [29]. In the equilibrium phase diagrams of the Au3Cu-type, AuCu-type and AuCu3-type sublattice systems, there is no two-phase region of ordered and disordered phases with different compositions, which may be proved by the difference method of Gibbs energies between ordered and disordered phases (see Appendix A.3).
In the AGA-subequilibrium thermodynamics, the essential definition of subequilibrium order-disorder transition is that the AG-Gibbs energy levels can respond immediately with each small variation in temperature, but the AG-probabilities (concentrations) occupied at the AG-Gibbs energy levels cannot change synchronously, even by extremely heating rate, which leads to its Gibbs energy path higher than that of equilibrium path. This transition needs the RA-SA atom movement mechanism together with superheated driving Gibbs energy [28].
Taking experimental path on disordering AuCuI () composed of and stem alloy genes as an example, we presented three discoveries [28]: 1) The ability of AuCuI () to keep structure stabilization against changing temperature is attributed to the fact that the and potential well depths greatly surpass their vibration energies, which leads to the subequilibrium of experimental path subequilibrium; 2) The RA-SA mechanism leads to heterogeneous and successive subequilibrium transitions; 3) There exist jumping alloy genes and jumping order degree, which lead to the existence of jumping Tj-temperature. The heterogeneous subequilibrium successive transitions on disordering stoichiometric AuCuI () by slow heating rate are as follows: AuCuI ()��AuCu (H)��PTP-AuCu�� SPAP-AuCuII��AuCu (L)��AuCu (D), of which the kinetic behaviors are closely related to heating rates. When 0 K ��T). Its behaviors are as follows: 1) There exists no variation in order degree until Tonset (593K)-temperature is achieved. Namely, there exists no positional exchange between and alloy genes, which are still occupied at the  and
and  energy levels, respectively; 2) The superheated driving Gibbs energy (
 ) between the equilibrium and subequilibrium paths increases with rising temperature, and their difference is -373 J/mol at 593 K, which is too small to exchange AG-positions; 3) The generalized vibration energies of and alloy genes increase with rising temperature, but their values are much smaller than their potential well depths. At 593 K, the
  and
and  ratios are about 1/27! It means that only depending on superheated driving Gibbs energy and vibration energy, the and alloy genes can not surmount potential barriers to alternate positions.
When Tonset (593 K)) cell region without 3(RA-SA) cell co-exist in the AuCu(H) alloy.
When 620 K) cell regions grow into the late-(RA-SA) cell regions with less 3(RA-SA) cells. Namely, the AuCu(H) region and SPAP-AuCuII region co-exist, and two distinct X-ray diffraction patterns may be observed at ��s=0.925 [29]. This subequilibrium alloy with region-scale heterogeneity of order degrees is called as the pseudo-two-phases (PTP) AuCu alloy with the AuCu(H) regions and the SPAP-AuCuII regions. The use of the phrase ��PTP�� is intended to convey the impression that they are two heterogeneous subequilibrium regions with the same composition, different order degrees, and belong to the ordered AuCu-type sublattice phase, rather than coexisting ordered (��>0) and disordered (��=0) phases. It should be emphasized that: 1) This situation occurs at the high order degree period; 2) The RA-SA mechanism is a short range atom movement mechanism; 3) The two phase transition of the ordered and disordered phases with different compositions needs a long range atom movement (diffusion) mechanism.
When 650 K and alloy genes and antiphase boundary n(RA-SA) cells containing less and alloy genes along b axis. It has no strict long periodic cell. The number M of cells between two successive antiphase boundaries is only an average, which is about 5.
When 0.807�ݦ�s��0.786, it is the jumping period of the SPAP-AuCuII alloy. In this period, there are the maximum concentration emergent phenomena of jumping alloy genes associated with jumping order degrees of the alloy.
At the jumping temperature Tj=683 K, the SPAP- AuCuII alloy with high order degree (��j=0.807) jumps into the AuCu(L) alloy with low order degree (��=0.4545). After the Tj-temperature, the AuCu(L) alloy is continuously transformed into the disordered AuCu (D) alloy.
This example is enough to demonstrate that the ��subequilibrium�� statistic region-scale heterogeneity with the same composition and different order degrees has been erroneously considered as the heterogeneous ��equilibrium�� two-phase region of ordered (��>0) and disordered (��=0) phases with different compositions.
5 Conclusions
1) Based on the AG-Gibbs energy sequences and AGA-Gibbs energy level model, the AG-Gibbs energy partition function of the fcc-based lattice Au-Cu system has been established, which is used to describe the systematic correlativity of the AG-Gibbs energy levels, AG-probabilities occupied at the AG-Gibbs energy levels and degeneracy factor as functions of composition, temperature and order degree. This function may be suitable for AuCu-, AuCu3- and Au3Cu-type sublattice systems (��>0), as well as disordered phase (��=0) and other subequilibrium phases. However, their order degree definitions are different.
2) Based on the AG-holographic information database and essential definition of equilibrium order-disorder transition, the EHNP-diagrams of the AuCu3-type sublattice have been established by the minimal mixed Gibbs energy path method. These diagrams exhibit unexpected characteristics of equilibrium transition of AuCu3-type sublattice system, and may be used as a standard for studying experimental subequilibrium transition. Once one network point has been clicked, the information about the composition, temperature, AG-concentrations, holographic properties and EHNP-charts of the alloy may be readily obtained. These achievements will prove stimulating to materials engineers, and who may well find value in using it as a big information database for materials discovery, design, manufacture and application.
3) The Gibbs energy�Cphase boundary curve has been obtained by the difference method of Gibbs energies between ordered and disordered phases. By this method, it has been proved that there is no two-phase region of ordered and disordered phases in the fcc-based lattice Au-Cu system.
4) Up to now, the researchers in the QMAC- and CALPHAD-communities have still taken erroneous understanding of experimental phenomena of order- disorder transition as the selected information, then established so-called Gibbs energy functions of ordered and disordered phases and so-called equilibrium phase diagram to achieve the best representation of the selected information. Since this way has had such venerable usage, it may be the biggest barrier hindering progress of the metal materials science and engineering.
Appendixes
A: Phase diagrams of Au-Cu system
A.1 Calculated phase diagrams of Au-Cu system by CALPHAD- and QMAC-thermodynamics
Before the present work, researchers have got used to recognizing the experimental phenomena observed during very slow variation in temperature to be thermodynamic equilibrium phenomena: 1) The middle jumping Tj-temperature is erroneously considered as the terminal Tc-critical temperature of order-disorder equilibrium transition of the alloy, although the experimental jumping ��j-order degree is 0.8-0.7, and the experimental short range order degree exists at the temperatures considerablely above the Tj-temperature; 2) The composition-dependent Tj(x)-points are erroneously considered the phase boundary points of phase diagram of the AuCu3-type sublattice system; 3) The heterogeneous subequilibrium statistic region-scale heterogeneity with the same composition and different order degrees is erroneously considered as two heterogeneous equilibrium two-phase region consisting of ordered and disordered phases; 4) They hold that the stoichiometric Au3Cu-, AuCu- and AuCu3- compounds in the Au3Cu-, AuCu- and AuCu3-type sublattice systems have the lowest potential energies at 0 K and the highest Tc-critical temperatures on their phase boundary curves, respectively. The researchers in the QMAC- and CALPHAD-communities took these eorroneous understandings of experimental phenomena as the selected information, then adjusted parameters in Gibbs energy functions and established so-called equilibrium phase diagrams to achieve the best representation of the selected information [19]. These phase diagrams are questionable in following respects (see Fig.A.1): 1) The so-called equilibrium phase boundary curve represents the experimental subequilibrium Tj-jumping temperatures, not the real equilibrium Tc-critical temperatures; 2) There exists two-phase region of the ordered and disordered phases; 3) The compositions of the highest critical points of the Au3Cu-, AuCu- and AuCu3-sublattice systems are located at the stoichiometric compositions: 25%Cu, 50%Cu and 75%Cu (atomic fraction), respectively.
A.2 Jumping order degree
The ��j-jumping order degree is defined as that the disordering begins to translate from a single splitting of the stem alloy genes to a universal splitting of the stem and jumping alloy genes.
In the AuCu3-type sublattice system, the main jumping alloy genes of the AuCu3 compound consisting of the
  and
and  stem alloy genes are respectively the
  ,
,  and
and  alloy genes; their ��j-jumping order degrees with the maximum emergent concentrations are respectively
  =0.736,
  = 0.755 and
  =0.690; their maximum emergent concentrations are respectively
  = 4.399%,
  =4.211% and
  =1.127%. These results have been shown in Figs. A.2 (a) and (b).

Fig. A.1 Experimental jumping temperatures and calculated phase diagrams by CALPHAD- and QMAC-thermodynamics
In the AuCu-type sublattice system, the main jumping alloy genes of the AuCu () compound consisting of the and stem alloy genes are respectively the 

 and
and  alloy genes; their ��j-jumping order degrees with the maximum emergent concentrations are respectively
  =
= = 0.786,
  =
= =0.807; their maximum emergent concentrations are respectively
  =
=  =3.744%,
  =
= =3.800%. These results have been shown in Figs. A.2 (c) and (d).

Fig. A.2 Main jumping alloy genes and their jumping order degrees
In the Au3Cu-type sublattice system, the main jumping alloy genes of the Au3Cu( ) compound consisted of the 3
 and
and  stem alloy genes are respectively the
  ,
,  and
and  alloy genes; their ��j-jumping order degrees with the maximum emergent concentrations are respectively
  =0.690,
  =0.755 and
  =0.736; their maximum emergent concentrations are respectively
  =1.127%,
  =4.211% and
  =4.399%. These results have been shown in Figs. A.2 (e) and (f).
A.3 Jumping temperature
The Tj-jumping temperature is defined as the beginning split temperature of the jumping alloy genes. It is determined by the jumping order degree together with superheated driving Gibbs energy. The completion of the disordering process occurs slowly by a ��tailing-off�� with short-range order at temperatures considerable above the Tj-jumping temperature. Therefore, it is the middle temperature of the subequilibrium order-disorder transition rather than the terminal Tc-critical temperature (see Fig. 1(c)).
A.4 Difference method of Gibbs energies between ordered and disordered phases
The  phase boundary curve of the AuCu3-type sublattice system has been obtained by the difference method of Gibbs energies between ordered AuCu3-type phase and disordered phase (see Fig. A.3). It has been proved that there is no two-phase region of the ordered and disordered phases, because ordered and disordered alloys belong to the same fcc-based lattice Au-Cu system.
B: EHNP charts of stoichiometric AuCu3 alloy
According to and paths on equilibrium order-disorder transition obtained by the minimal mixed Gibbs energy method, the EHNP charts are calculated by Eqs. (5)-(8) and shown in Figs.B.1 to B.14. By the same method, the systematic correlativity data of the 
 and
and  on equilibrium order-disorder transition paths as function of composition and temperature for alloys of the AuCu3-type sublattice system are calculated, using calculated steps ��x=0.5%, ��T=1 K, ����=0.0001.
C: other thermodynamic properties EHNP diagrams
According to  and
and  EHNP diagrams obtained from
  diagram, we have obtained other
  EHNP diagrams of AuCu3- type sublattice system shown in Figs. C.1 to C.3. It should be emphasized that from each three-dimensional EHNP diagram, we can obtain isocompositional , isoproperty and isothermal path phase diagrams. These diagrams are interconnected to form a big database about structure, properties and their variations with temperature of alloy systems. Therefore, the knowledge of relationships of structure, properties and environments for alloy systems has been changed from single causality to systematic correlativity.

Fig. A.3 Difference method for calculating phase boundary curve of AuCu3-type sublattice system
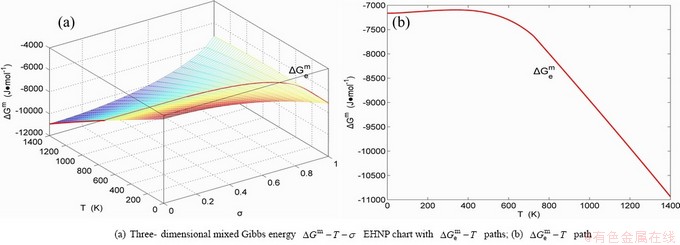
Fig. B.1 EHNP charts with EHNP curve of first order thermodynamic properties on disordering AuCu3( )
)

Fig. B.2 EHNP charts with EHNP curve of first order thermodynamic properties on disordering AuCu3( )
)
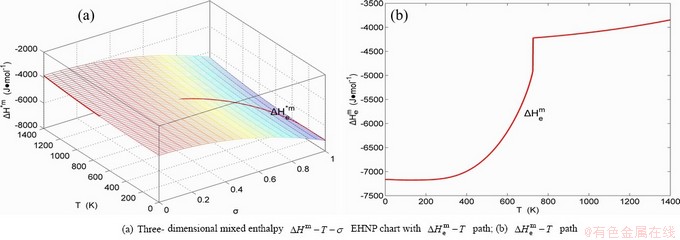
Fig. B.3 EHNP charts with EHNP curve of first order thermodynamic properties on disordering AuCu3()

Fig. B.4 EHNP charts with EHNP curve of first order thermodynamic properties on disordering AuCu3()
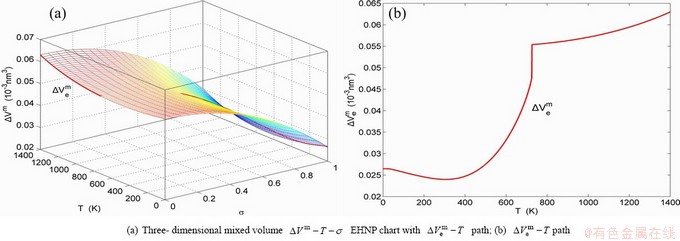
Fig. B.5 EHNP charts with EHNP curve of first order thermodynamic properties on disordering AuCu3()

Fig. B.6 EHNP charts with EHNP curve of first order thermodynamic properties on disordering AuCu3()

Fig. B.7 EHNP charts with EHNP curve of first order thermodynamic properties on disordering AuCu3()
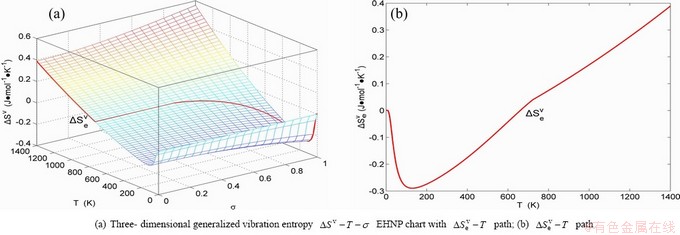
Fig. B.8 EHNP charts with EHNP curve of first order thermodynamic properties on disordering AuCu3()
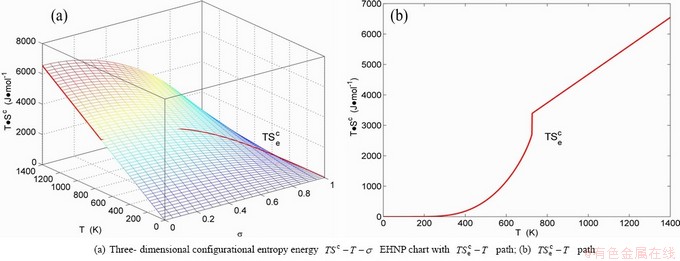
Fig. B.9 EHNP charts with EHNP curve of first order thermodynamic properties on disordering AuCu3()

Fig. B.10 EHNP charts with EHNP curve of first order thermodynamic properties on disordering AuCu3()

Fig. B.11 EHNP charts with EHNP curve of first order thermodynamic properties on disordering AuCu3()
D: AG-holographic information database of fcc-based lattice Au-Cu system
D.1 Thermodynamics properties of AG-sequences
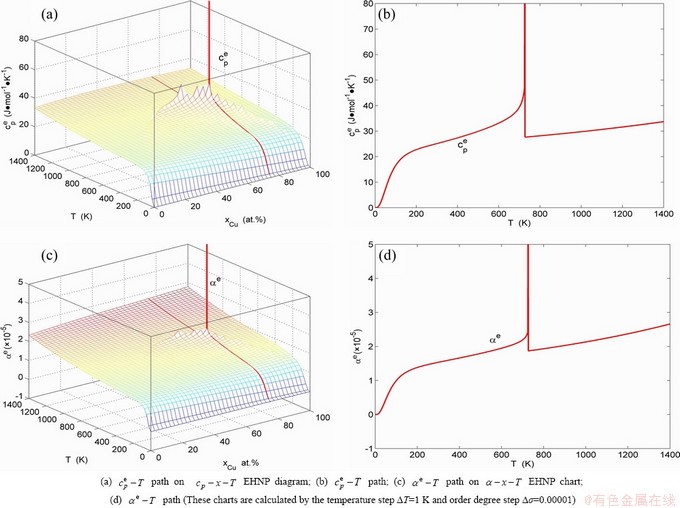
Fig. B.12 Second order thermodynamic properties (heat capacity and thermal expansion coefficient) on disordering AuCu3 ( )
)

Fig. B.13 Activities on disordering AuCu3 ()

Fig. B.14 Activities on disordering AuCu3 ()

Fig. C.1  EHNP diagrams of AuCu3-type sublattice system

Fig. C.2 EHNP diagrams of AuCu3-type sublattice system
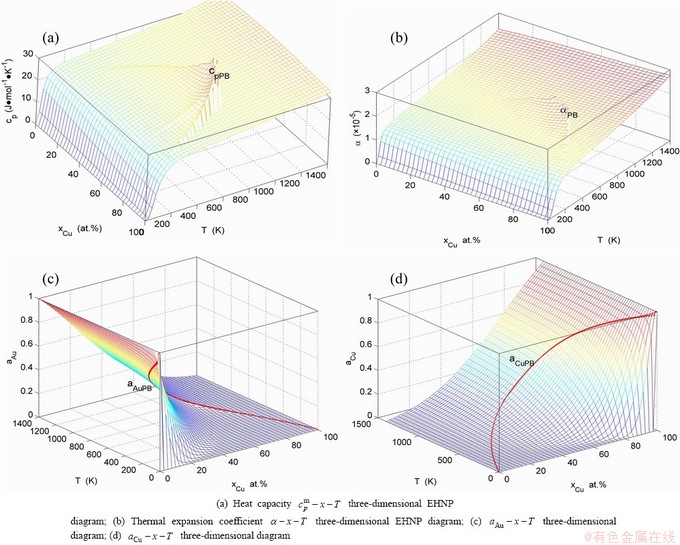
Fig. C.3 EHNP diagrams of AuCu3-type sublattice system
In the SMMS framework, the characteristic Gibbs energy ( ) of each characteristic crystal (or alloy gene) may be split into two parts: a temperature- independent contribution of potential energy (
 ), of which the variation with temperatures has been accounted in the attaching vibration energy, and a temperature-dependent contribution of generalized vibration free energy (
 ), but both are energy level (i)-dependent (Eq. (1)). The enthalpy (
 ) of each characteristic crystal may be also split into two parts: a temperature-independent contribution of potential energy () and a temperature-dependent contribution of generalized vibration energy (
 ) (Eq. (2)). The generalized vibration free energy includes the generalized vibration energies (), which include Debye vibration energies (
 ) and attaching vibration energies (
 ), the contribution of the generalized vibration entropies (
 )(Eq. (3)) , which include Debye vibration entropies (
 ) and attaching vibration entropies (
 ), and the generalized vibration heat capacity (
 ), which include Debye vibration heat capacity (
 ), attaching vibration heat capacity (
 ). The attaching vibration energy includes contributions of electron excitation, energy of formation of holes, variation of potential energy with temperature, and expansion work (
 ) of volume. Therefore, the multi-level energetic functions of characteristic crystals at T K are as follows:
 (1)
(1)
 (2)
(2)
 (3)
(3)
 (4)
(4)
 (5)
(5)
 (6)
(6)
 (7)
(7)
 (8)
(8)
 (9)
(9)
 (10)
(10)
 (11)
(11)
 (12)
(12)
 (13)
(13)
 (14)
(14)
 (15)
(15)
 (16)
(16)
 (17)
(17)
where  =165 K,
  =175.21 K,
  =343 K,
  =343.07 K.
The valence electron structures (the number of free electrons (sf), covalent electrons (Sc, dc) and non-valent electrons (dn) , volumes (v), potential energies (��) and single bond radii (R) of alloy genes, cohesive energy (Ec), Debye temperatures (��) and bulk moduli (B) of characteristic crystals have been obtained by the valence bond theory of characteristic crystals [27,38-40].
D.2 Flow chart for establishing AG-holographic information database of fcc-based Au-Cu system
The AG-holographic information database of the fcc-based Au-Cu system has been established by AG-theory, which is shown in Fig.D.1.
D.3 Figures of thermodynamics properties of AG- sequences
The thermodynamics properties of AG-sequences are shown in Figs.D.2��D.4, which may be used to establish EHNP-diagrams of Au-Cu system.

Fig. D.1 Flow chart for establishing AG-holographic information database of fcc-based Au-Cu system

Fig. D.2 Curves of AG-thermodynamic properties in Au-Cu system

Fig. D.3 Curves of AG-thermodynamic properties in Au-Cu system

Fig. D.4 Curves of AG-thermodynamic properties in Au-Cu system
References
[1] SLATER J C. Electronic structure of alloys [J]. Journal of Applied Physics, 1937, 8(6): 385-396.
[2] ELLIS D E, AVERRILL F W. Electronic structure of FeCl4 anions in the Hartree-Fock-Slater model [J]. J Chem Phys, 1974, 60(8): 2856-2864.
[3] BAERENDS E J, ELLIS D E, ROS P. Self-consistent molecular Hartree-Fock- Slater calculations. I. The computational procedure [J]. Chem Phys, 1973, 2(1): 41-51.
[4] KIKUCHI R. A theory of cooperative phenomemena [J]. Phys Rev, 1951, 81(6): 988-1003.
[5] KIKUCHI R, de FONTAINE D, MURAKAMI M, NAKAMURA T. Ternary phase diagram calculations��II. Examples of clustering and ordering systems [J]. Acta Metallurgica, 1997, 25(2): 207-219.
[6] ASTA M, de FONTAINE D. First-principles study of phase stability of Ti-Al intermetallic compounds [J]. J Mater Res, 1993, 8(10): 2554-2568.
[7] OATES W A, ZHANG F, CHEN S L, CHANG Y A. Improved cluster-site approximation for the entropy of mixing in multicomponent solid solutions [J]. Physical Review B, 1999, 59(17): 11221-11225.
[8]  V, WOLVERTON C, ZUNGER A. Cu-Au, Ag-Au, Cu-Ag, and Ni-Au Intermetallics: First-principles study of temperature-composition phase diagrams and structures [J]. Physical Review B, 1998, 57(12): 6427-6443.
[9] BRAGG W L, WILLIAMS E J. The effect of thermal agitation on atomic arrangement in alloys [J]. Proceedings the Royal of Society A, 1934, 145(2): 699-730.
[10] BRAGG W L, WILLIAMS E J. The effect of thermal agitation on atomic arrangement in alloys II [J]. Proceedings the Royal of Society A, 1935, 51(2): 540-566.
[11] ORIANI R A. Thermodynamics of order alloy. II. The gold-copper system [J]. Acta Metall, 1954, 2(3): 608-615.
[12] RHINES F N, BOND W E, RUMMEL R A. Constitution of order alloys of the system copper-gold [J]. Trans Amer Soc Met, 1955, 47(2): 578-597.
[13] KAUFMAN L, BERNTEIN H. Computer calculation of phase diagrams [M]. New York: Academic Press, 1970: 225.
[14] SUNDMAN B, FRIES S G, OATES W A. A thermodynamic assessment of the Au-Cu system [J]. Calphad, 1998, 22(3): 335-354.
[15] SUNDMAN B, FRIES S G, OATES W A. A calphad assessment of the Au-Cu system using the cluster variatiation method [J]. Z Metallkd, 1999, 90(5): 267-273.
[16] HILLERT M. The compound energy formalism [J]. Journal of Alloys and Compounds, 2001, 320(1): 161-176.
[17] OATES W A. Configurational entropies of mixing in solid alloys [J]. Journal of Equilibria of Diffusion, 2007, 28(1): 79-89.
[18] OSTP. Materials genome initiative for global competitiveness [R]. Washington DC: Office of Science and Technology Policy, 2011.
[19] KAUFMAN L,  J. First and second generation-birth of the materials genome [J]. Scripta Materialia, 2014, 70(1): 3-6.
[20] SUTCLIFFE C H, JAUMOT F E Jr. Order-disorder in Au-Cu alloy. I. Short-range order in an alloy containing atomic percent Au [J]. Acta Metall, 1953, 1(2): 725-730.
[21] JAUMOT F E Jr, SUTCLIFFE C H. Order-disorder in Au-Cu alloy. II. The nature of the order-disorder transformation and long-range order [J]. Acta Metall, 1954, 2(2): 63-74.
[22] SCOTT R E. New complex phase in the copper-gold system [J]. Journal of Applied Physics, 1960, 31(12): 2112-2117.
[23] LANG H, UZAWA H, MOHI T, PFEILER W. L12-long-range order in Cu3Au: Kinetics and equilibrium as studied by residual resistivity [J]. Intermetallics, 2001, 9(1): 9-24.
[24] KEATING D T, WARREN B E. Long-range order in beta-brass and Cu3Au [J]. Journal of Applied Physics, 1954, 22(3): 286-290.
[25] BUTLER B D, COHEN J B. The structure of Cu3Au above the critical temperature [J]. J Applied Physics, 1989, 65(6): 2214-2219.
[26] XIE You-qing. Systematic science of alloys [M]. Changsha: Central South
[27] XIE You-qing, LI Xiao-bo, LIU Xin-bi, NIE Yao-zhuang, PENG Hong-jian. Alloy gene Gibbs energy partition function and equilibrium holographic network phase diagrams of AuCu-type sublattice system [J]. International Journal of Communications, Network and System Sciences, 2013, 12(6): 415-442.
[28] XIE You-qing, PENG Hong-jian, LIU Xin-bi, LI Xiao-bo, NIE Yao-zhuang. New atom movement mechanism for tracking path on disordering AuCuI( ) compound [J]. Transactions of Nonferrous Metals Society of China, 2014, 24(10): 3221-3256.
[29] FEUTALAIS Y, LEGENDRE B, GUYMONT M. New enthalpies determination and in situ X-ray diffraction observations of order/disorder transitions in Au0.5Cu0.5 [J]. Acta Materials, 1999, 47(8): 2539-2551.
[30] XIE You-qing, ZHANG Xiao-dong. Electronic structure of Au-Cu alloys [J]. Science in China: Series E, 1998, 41(3): 225-236.
[31] XIE You-qing, MA Liu-ying, ZHANG Xiao-dong, ZHOU Ping, ZHAO Li-ying. Microstructure and properties of Cu-Ni alloy [J]. Science in China: Series A, 1993, 36(5): 612-623.
[32] ORIAN R A. Thermodynamics of ordering alloys. II. The gold-copper system [J]. Acta Metall, 1954, 2(7): 608-615.
[33] JAUMOT F E, SUTCLIFFE C H. Order-disorder in Cu-Au alloys. II The nature of order-disorder transformation and long-range order [J]. Acta Metall, 1954, 2(7): 63-74.
[34] XIE You-qing, LIU Xin-bi, PENG Hong-jian, LI Xiao-bo, NIE Yao-zhuang, LI Yan-fen. Characteristic atom arranging crystallography of alloy phases for Au-Cu system [J]. Science in China: Tech Sci, 2011, 54(6): 1560-1567.
[35] DINSDALE A T. SGTE data for pure elements [J]. Calphad, 199l, 15(4): 317-425.
[36] CAO W, CHANG Y A, ZHU J, CHEN S, OATES W A. Thermodynamic modeling of the Cu-Ag-Au system using the cluster/site approximation [J]. Intermetallics, 2007, 15(8): 1438-1446.
[37] WEI S H, MBAYE A A, FERRIRA L G, ALEX Z G. First-principles calculations of the phase diagrams of noble metals: Cu-Au, Cu-Ag and Ag-Au [J]. Phys Rev B, 1987, 36(20): 4163-4185.
[38] XIE You-qing. A new potential function with many-atom interaction in solid [J]. Science in China: Series A, 1993, 36(1): 90-99.
[39] XIE You-qing. Electronic structure and properties of pure iron [J]. Acta Metallurgica et Materials, 1994, 42(11): 3705-3715.
[40] XIE You-qing, ZHANG Xiao-dong. Electronic structure and properties of pure cobalt [J]. Science in China: Series E, 1996, 39(4): 394-403.
л����1,2,3����С��4�����ı�1,2,3����ҫׯ5�����콨6
1. ���ϴ�ѧ ���Ͽ�ѧ�빤��ѧԺ����ɳ 410083;
2. ���ϴ�ѧ ��ĩұ���о�Ժ����ɳ 410083��
3. ���ϴ�ѧ ��ĩұ������ص�ʵ���ң���ɳ 410083��
4. ��̶��ѧ ���Ͽ�ѧ�빤��ѧԺ����̶ 411105��
5. ���ϴ�ѧ ���������ѧԺ����ɳ 410083��
6. ���ϴ�ѧ ��ѧ����ѧԺ����ɳ 410083
ժ Ҫ����AuCu3-�Ǹ���ϵͳΪ��������3��֣���һ�������谭�������Ͽ�ѧ�����ĵ������ϰ����о�����ϰ����ƽ�����ת���˼ά��ʽ��ʶ�¶ȼ��仺���仯�ĺϽ����ʵ������Ȼ����ʵ������Ĵ�����ʶΪѡ����Ϣ������Gibbs�ܺ�������ν�ġ�ƽ����ͼ�����ڶ���AuCu3-���Ǹ���ϵͳ��ƽ��ȫϢ������ͼ������������ɷֺ��¶��йصĺϽ�������нṹ��������ѧ���ʵ�ϵͳ����ԣ�������ÿ���Ͻ��ƽ��ת�䶼�Ǿ��ȵĵ���ת�䣬���ǷǾ��ȵ�˫��ת�䣬����һ��û�������������������ĵ�������ߣ�����߶���ɷֺ��¶�Զƫ��AuCu3�������ٽ��ļ����ɷֺ��¶ȡ�
�ؼ��ʣ�AuCu3�����AuCu3-���Ǹ���ϵͳ���Ͻ����Gibbs����ֺ�����ƽ��ȫϢ������ͼ��ϵͳ�������Ͽ�ѧ
(Edited by Yun-bin HE)
Foundation item: Project (51071181) supported by the National Natural Science Foundation of China; Project (2013FJ4043) supported by the Natural Science Foundation of Hunan Province, China
Corresponding author: You-qing XIE; Tel: +86-731-88879287; E-mail: xieyouq8088@163.com
DOI: 10.1016/S1003-6326(14)63505-6

