��������-����-���켼���Ʊ�A390/A356���Ͻ� �����ݶȸ��ϲ���ʱ���Ⱥ����̲��ȶ��� ����Ӻϵ�Ӱ��
��Դ�ڿ����й���ɫ����ѧ��(Ӣ�İ�)2014���3��
�������ߣ�M. MOHAMMADI RAHVARD M. TAMIZIFAR M. A. BOUTORABI S. GHOLAMI SHIRI
����ҳ�룺665 - 672
�ؼ��ʣ�A390���Ͻ�A356���Ͻ𣻹����ݶȲ��ϣ�����-����-���켼��
Key words��A390 alloy; A356 alloy; functionally graded material; cast-decant-cast process
ժ Ҫ������-����-���켼���ǽ�������չ������һ���Ʊ������ݶȲ��ϵ��·������������ַ����Ʊ��ھ�������ݶȹ��ܵ�Բ�����������������Ϊ���и���ĥ�Ե�A390���Ͻ�о��Ϊ���нϸ����Ժͼӹ����ܵ�A356���Ͻ��о�о�������ڲ�ͬ�����¶�(750��820��860 ��C)�ͱ����ڲ�ͬ����ʱ��(25��35��45 s)�µ�A390/A356�Ͻ����Ӻ���������ù�ѧ������ɨ��羵�Խ�����б������Խ���������Ӳ�Ƚ��в���������������ڹ����¶�Ϊ860 ��C������ʱ��Ϊ35 s�������£����Ի��һ����ԼΪ500 ��m�ĽӺ����õĽ���㡣�Ƚ�������������о������ĥ���ܡ�
Abstract: The cast-decant-cast is a new method for the preparation of the functionally graded components that has been developed in recent years. The functionally graded cylindrical shape component with a radial gradient, e.g. the first alloy (A390) with high wear resistance on the surface of the piece and toughness and the second alloy (A356) of low machining costs in the core of the piece can be produced via this melt process. The effect of the second alloy superheat at temperatures of 750, 820 and 860 ��C as well as the effect of the first alloy solidified layer at 25, 35 and 45 s decanting time on achieving the perfect interface between the two alloys was investigated. The characterization of the interface was carried out by optical microscopy and scanning electron microscopy, and its width was measured by the microhardness test. The results showed that the best interface was obtained at 860 ��C and 35 s decanting time with a width of 500 ��m. Also, the wear resistance test was performed to measure and compare the surface wear resistance to the core.
Trans. Nonferrous Met. Soc. China 24(2014) 665-672
M. MOHAMMADI RAHVARD1, M. TAMIZIFAR1, M. A. BOUTORABI1, S. GHOLAMI SHIRI2,3
1. School of Materials Science and Engineering and Center of Excellence for High Strength Alloys Technology, Iran University of Science and Technology, Tehran, Iran;
2. School of Materials Science and Engineering, Sharif University of Technology, Azadi Ave., P.O. Box 11365-9466, Tehran, Iran;
3. Damavand Petrochemical Company, Phase 2, Pars Special Economic Energy Zone, Asaloye, Boshehr, Iran
Received 8 July 2013; accepted 24 October 2013
Abstract: The cast-decant-cast is a new method for the preparation of the functionally graded components that has been developed in recent years. The functionally graded cylindrical shape component with a radial gradient, e.g. the first alloy (A390) with high wear resistance on the surface of the piece and toughness and the second alloy (A356) of low machining costs in the core of the piece can be produced via this melt process. The effect of the second alloy superheat at temperatures of 750, 820 and 860 ��C as well as the effect of the first alloy solidified layer at 25, 35 and 45 s decanting time on achieving the perfect interface between the two alloys was investigated. The characterization of the interface was carried out by optical microscopy and scanning electron microscopy, and its width was measured by the microhardness test. The results showed that the best interface was obtained at 860 ��C and 35 s decanting time with a width of 500 ��m. Also, the wear resistance test was performed to measure and compare the surface wear resistance to the core.
Key words: A390 alloy; A356 alloy; functionally graded material; cast-decant-cast process
1 Introduction
Many engineering components require contradictory material properties, such as lightweight and wear resistance, wear resistance and machinability, hardness and toughness across the cross-section. Functionally gradient materials (FGMs) fill the gap in materials science where the components require different properties in different positions and the optimal property is not achievable with the homogeneous cross-section materials. FGMs are materials with variations of composition and microstructure along their thickness [1]. In two recent decades, several melt processes have been used to fabricate bulk FGMs. The common methods used are centrifugal casting [2], power ultrasonic casting [3], settling [4], magnetic separation [5] and melt infiltration [6]. In 2005, a new casting method to produce functionally gradient light alloys was developed in University College Dublin; the process was termed cast-decant-cast (CDC) process. SCANLAN et al [7] identified three techniques associated with the CDC process: the turnover, internal decant and low pressure techniques. To produce FGMs by these techniques, the following model has been used. The first alloy was introduced into a mould and allowed to partially solidify against the mould walls or the core, to form a layer. When the layer got the required thickness, the part of the first alloy remaining unsolidified was decanted and the second alloy was then introduced into the mould. The common step in each of the processing techniques is decanting. The main purpose of this work is manufacturing Al-Si alloy FGM pistons with a radial gradient varying with high wear resistance and hardness on one surface, high machinability and toughness on the other surface or in the core of the piece. Researches on producing Al-Si alloy FGM pistons have been performed via another process such as centrifugal casting [8]. However, as the CDC process has an ability to produce FGM with a radial gradient, this process, particularly the turnover technique, has been studied in this work. The main concern about its products and other FGM products is to achieve the perfect interface among different layers or alloys which are produced by the constructive method or the transport method [1]. Researchers have not reported this process in detail. This can be exemplified by the effect of the second alloy superheat and the effect of the first alloy solidified layer on achieving the perfect interface and wide transition zone. Therefore, in this work, the effect of the aforementioned parameters on achieving the perfect interface is investigated. Also, the thermal analysis is conducted to measure the solid volume fraction to investigate the first alloy solidified layer using a reliable and repeatable method.
2 Experimental
2.1 Materials and equipment
This project focused on the use of Al-Si alloys as their uses can combine many of the aforementioned contradictory material properties. The two alloys were used: the first alloy, A390, a hypereutectic Al-Si alloy; and the second alloy, A356, a hypoeutectic Al-Si alloy. The chemical composition of both the alloys is given in Table 1. A390 alloy is a hard, wear-resistant alloy with a silicon content of -16%. A356 alloy is a tougher material with a silicon content of -7%. The apparatus for this technique is a simple cylindrical mould made by ST37 steel with a side handle shown in Fig. 1. The handle enables the mould to be inverted.
Table 1 Composition of A390 and A356 alloys
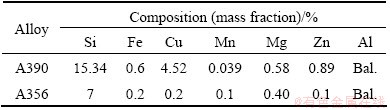
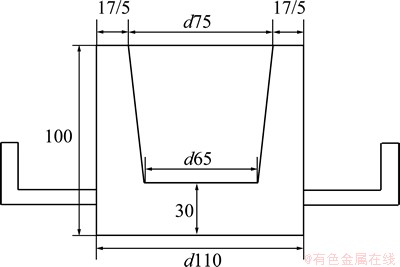
Fig. 1 Schematic of cylindrical mould (Unit: mm)
2.2 Characterization
Microstructural characterization was carried out using an optical microscope (OM) and a scanning electron microscope (SEM). The energy dispersive X-ray spectroscopy (EDS) was used to analyze the interface and study the silicon gradient.
2.3 Microhardness and wear resistance
The microhardness test was carried out from the interface area with a 100 ��m interval distance through the right side and the left side to identify the width of the transition zone and measure the zone where there is a gradient in the silicon content and microstructure. Dry sliding wear tests were conducted on 25 mm2 cubic samples using a pin-on-disc wear testing machine to measure and compare the surface wear resistance to the core. The sliding speed of 0.25 m/s, the applied load of 50 N and the wear distance of 1000 m were considered. The wear rate was defined in the units of the wear mass loss (mg). The wear surface was examined using a scanning electron microscope
2.4 Thermal analysis
The temperature-time data were collected using a high-speed data acquisition system (analog-to-digital (A/D) converter) linked to a notebook computer. The A/D converter used in this work has a sensitive 16-bit converter with a 16-channel input, the response time of 0.02 s, and a high accuracy of detection. The K type thermocouple was placed into the melt to measure the temperature of the alloy during the solidification. The thermocouple was located in the center of the permanent mould at a position of 25 mm height from the bottom of the mould. The mould was preheated at temperature of 200 ��C. Like the melting conditions in the CDC process, the melting of A390 alloy occurred at 750 ��C. The cooling curve and the first derivative curve were plotted using a thermal analysis program and Excel software. In this work, the thermal analysis technique was used to quantify the solid fraction during the solidification of A390 alloy. The amount of heat evolved from a sample in the solidifying test can be calculated as the integrated area between the first derivative curve and the zero curve (base line) [9]. The amount of heat is proportional to the fraction of solid. Hence, the solidified layer of external alloy could be related to solid fraction obtained by thermal analysis technique. It should be noticed that the thermal test analyzer was taken only for the external alloy (A390 alloy) at constant temperature to find the solidified layer thickness. The calculation accuracy depends heavily on the evaluation of the zero curve. The analysis presented in this article for the zero curve calculation was based on the Newtonian model adopted by BARLOW and STEFANESCU [10]. Therefore, in order to determine the solid fraction, the cooling curve (CC), the first derivative curve, and the zero curve (ZC) were plotted. Finally, the solid fraction was numerically calculated by
 (1)
(1)
2.5 Procedure
In order to investigate the effect of superheat on the interface between two alloys, A390 alloy as the first alloy and A356 alloy as the second alloy were melted in two separate furnaces at 750 ��C and different superheats of 750, 820 and 860 ��C, respectively. The procedure was performed in the following way. At first, A390 alloy was poured into the mould, then it was allowed to solidify and form a layer against the mould walls. The layer thickness was increased toward the center with time. When the layer reached the required thickness which was considered to 35 s solidification time after pouring the melt, the mould was inverted using the handle to remove any unsolidified A390 alloy from the mould. The mould containing a layer of A390 alloy solidified against its walls was returned to its upright position. Then, the A356 alloy at different superheats of 750, 820 and 860 ��C was poured into the remaining central cavity. This led to filling the core of the piece with a different alloy from that of the surface. Another important parameter affecting the forming of the sufficient interface is the solidified layer thickness against the mould wall. For this purpose, with the thermal analysis results as to the solid volume fraction, three decanting times of 25, 35 and 45 s were considered. The macrographs of the samples are shown in Fig. 2. It should be mentioned that the superheat of A356 alloy according to the previous results was taken 860 ��C and the other conditions were constant. By this method, the component with a gradient in the silicon composition was produced with high silicon A390 on the surface gradually decreasing to low silicon A356 at the core. It is noticed that the sufficiently short time between decanting and pouring of the second alloy is mandatory to achieve good metallic bond without any oxide film and void.
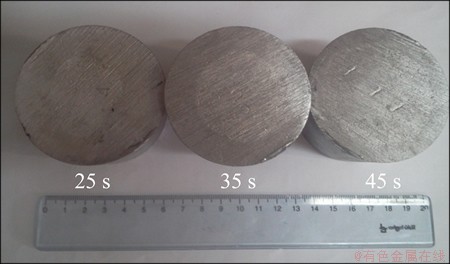
Fig. 2 Macrographs of cross-section of samples produced at 25, 35, 45 s decanting time
3 Results and discussion
3.1 Effect of superheat
The macrographs and micrographs of the interface of samples prepared at different superheats are shown in Fig. 3. As can be seen, the two alloys in the transition area adhere to each other. In this area the A390 alloy is on the left side and A356 alloy is on the right side. The macrographs of the samples were taken to show the grain size of the second alloy (A356) at different superheats. In Fig. 3, it is obviously observed that the grain size is increased by increasing the superheat. As to 750 ��C superheat, perfect interface and good metallic bond have not been obtained.
In spite of the 750 ��C superheat, at 820 ��C the two alloys were completely bonded, but in the microstructure shown in Fig. 3(e), it did not seem that the two alloys were mixed with each other and the weak interface in the transition area was also obtained. However, at 860 ��C superheat (Figs. 3(c,f)), the perfect and firm interface with complete mixing was produced. It was found that to achieve a good bond, the high-temperature melt of the second alloy was essential because the high superheat state of the second alloy led to the partial remelting of the inner layer of the solidified alloy and mixing with the first alloy liquid.
The microstructural characteristic in the transition zone was identified by the following way during the remelting of the initial alloy. The dominant element diffused gradually in the transition area from the outer layer where is rich in Si to the center where is poor in Si. As a result, the Si content of the second alloy adjacent to the solidified layer was increased and when it solidified again, it took a new microstructure characteristic containing the finer eutectic and primary Si due to the higher solidification rate adjacent to the solidified layer as shown in Fig. 4(a). The transition area can be defined as a region between the two alloys with the distinguishing microstructure from the side alloys. The distance between the hypereutectic alloy reinforced with Si particles and the hypereutectic alloy with a dendritic shape of ��(Al) identifies the width of the transition zone. Based on the aforementioned experiments and results, it is concluded that this process has the ability to produce a gradient in the silicon composition and volume fraction varying from high silicon A390 on one surface to low silicon A356 on the other surface or in the core of the piece. Figure 4(a) illustrates the gradient in the Si content produced using the turnover technique. The right side shows the A390 alloy in which the primary Si is in abundance, and by moving to the left side, the number and density of primary Si gradually reduce. Also, to confirm the variation of the Si, Al and Cu elements in the interface area, the line scan analysis was conducted as given in Fig. 5. The results show the upward trend of the Si content and digressive trend of the Al content from the left alloy to right as marked in Fig. 4(b).
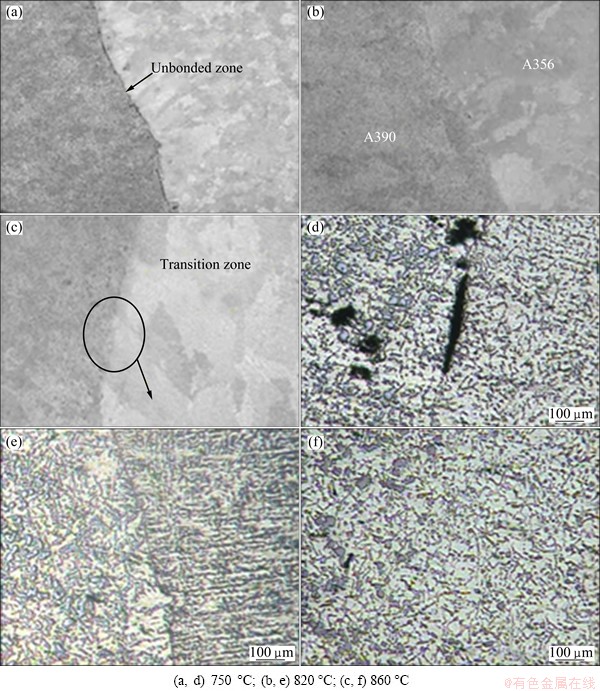
Fig. 3 Macrographs (a, b, c) and micrographs (d, e, f) of interface of samples produced at different superheats
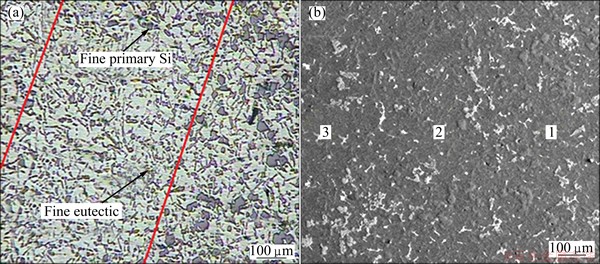
Fig. 4 OM (a) and SEM (b) micrographs of interface of sample prepared at 860 ��C superheat
3.2 Thermal analysis
A typical cooling curve and its first derivative curve associated with the zero curves for A390 alloy are presented in Fig. 6.
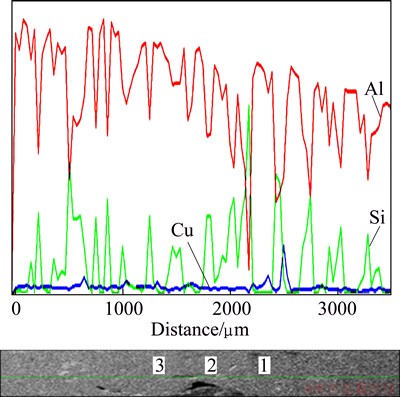
Fig. 5 Result of line scan analysis of interface for Si, Al and Cu elements
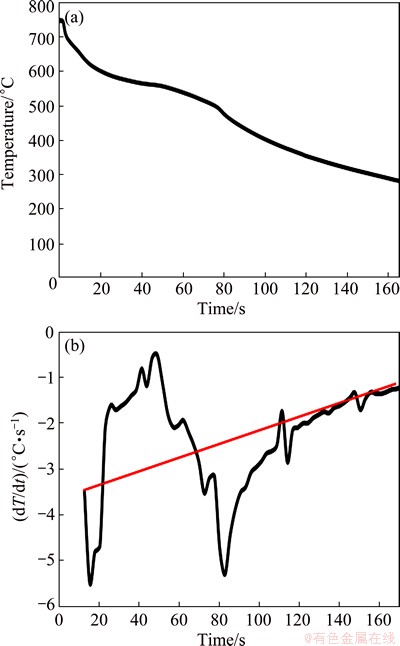
Fig. 6 Cooling curve (a) and first derivative associated with zero curves (b) for A390 alloy
The solid fraction was calculated according to the Newtonian model. The solid fractions at 25, 35 and 45 s decanting time were about 23.65%, 43.42% and 63.35% (volume fraction), respectively. It should be mentioned that the onset and end of solidification occur at about 10 and 100 s, respectively.
3.3 Effect of solidified layer
The variation in different solid volume fraction led to the different solidified layers against the mould wall. The thicknesses of the solidified layers were 5, 10 and 20 mm for 25, 35 and 45 s decanting time, respectively. The solidified layer against the mould wall can directly influence the thermal conduction of the second alloy liquid, leading to changing the characteristic microstructure and width of the transition zone between the two alloys. Figure 7 shows the micrographs of the transition zone for the samples prepared with 25, 35 and 45 s decanting time. As for 25 s decanting time, the perfect interface with completely mixing between the two liquid alloys was not obtained as shown in Fig. 7(a).
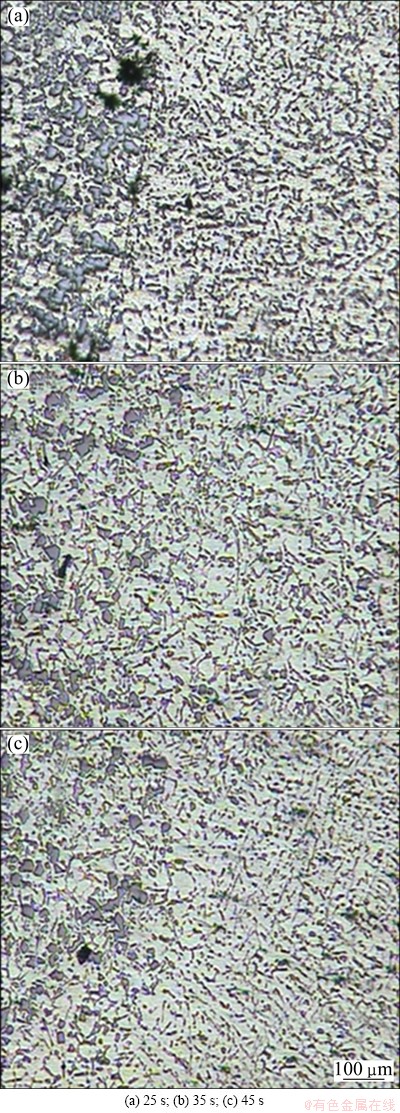
Fig. 7 Micrographs of interface of samples prepared with different decanting time
When the solidified layer was thin, the solidified layer temperature was decreased rapidly. The thermal conduction of the second alloy liquid was controlled by the steel mould wall. Thus, the second alloy liquid was quickly solidified and had no time to partially remelt the first alloy and to be mixed with it. The sample with 35 s decanting time is shown in Fig. 7(b). It was observed that the two alloys were mixed with each other and the perfect interface was obtained. In addition, the width of the transition zone with a smooth gradient in the microstructure was wide. As for the sample with 45 s decanting time (Fig. 7(c)), it was observed that the perfect interface with the complete mixing between the two alloy liquids was achieved. But it seemed that the width of the transition zone was narrow, as compared to the sample with 35 s decanting time. Also, the gradient in Si particles and microstructure was not smooth. At 45 s decanting time, a little unsolidified liquid remained in the center piece; therefore, this needed low amount of second alloy liquid to fill the central cavity remaining after decanting the unsolidified liquid. As a result, since the heat capacity is an extensive property, the amount of heat flow of the second alloy was decreased in this condition. Consequently, the lower ability to partially remelt the solidified layer was obtained, resulting in a lower amount of mixing, as well as low silicon content penetration in the transition zone.
3.4 Microhardness and wear resistance
The results of microhardness are plotted in Fig. 8. It shows that the hardness variation from the outer layer of HV 120 to the inner layer of HV 75 corresponds to the variation in Si content. But in the middle layer, the hardness was increased abruptly. This is related to the finer microstructure as a result of the higher solidification rate of the liquid adjacent to the solidified layer. The width of variation in hardness at the transition zone for sample with 35 s decanting time was 500 ��m, while that of the sample with 45 s decanting time was 200 ��m. This confirms the microstructural characteristic of the transition zone for different decanting time samples. Furthermore, it was observed that the variation in hardness from the transition zone to the center of the piece for the sample with 35 s decanting time was gradual in comparison to the sample with 45 s decanting time. Another point that can be deduced was that more variations in hardness were near the second alloy (A356). It was demonstrated that the silicon diffusion occurred from the high silicon alloy to low silicon alloy when the solidified layer was remelted and mixed with the second alloy.
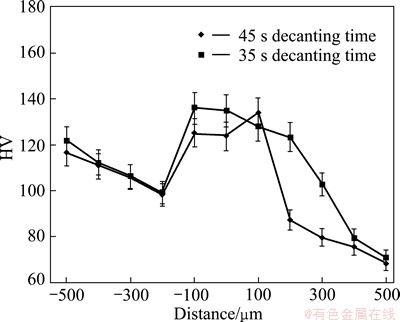
Fig. 8 Microhardness profile of interface of samples prepared with 35 and 45 s decanting time
The results of the wear resistance test are shown in Fig. 9. As can be seen, the wear resistance of the surface was sharply more than that of the core of the piece.

Fig. 9 Wear resistance of component in outer and inner layers
Typical SEM micrographs of the wear surface of the outer layer and inner layer are shown in Fig. 10. It was observed that metal was pulled out from the base metal as a flake. Also, the surface damage of the hypoeutectic alloy in the core of the piece is more than that of the hypereutectic alloy on the surface. This is related to the higher hardness of A390 alloy matrix, as well as the presence of primary silicon.
Al alloys, as light and low yield stress alloys, under dry sliding, their compressive and shear forces on the sliding surface exhibit an easy plastic deformation; consequently, the sub-surface damage due to work hardening is produced. Work hardening increases the crack sensitivity owing to the increased hardness of the deformed material [11]. Therefore, the stress imposed during the wear test propagates these cracks simplifying the pulling out of the metal matrix from the base alloy, as shown in Fig. 11. The presence of the brittle second phase and the improvement in metal matrix hardness limit the extent of the subsurface damage and plastic flow. The reduction of the tendency to cracking leads to distributing the wear load more effectively [12,13]. As a result, the matrix of high-Si alloys is more effective in wear resistance than low-Si alloys.
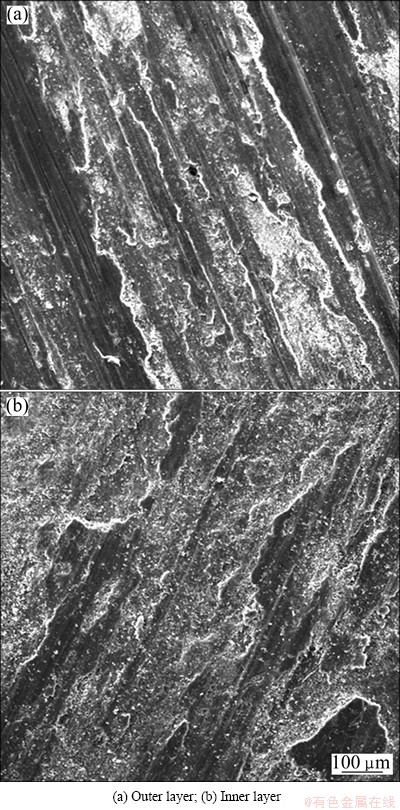
Fig. 10 SEM micrographs showing metal transfer particles on wear surface
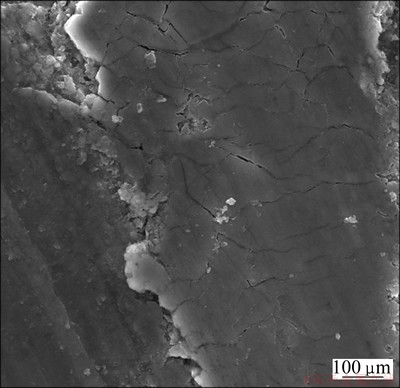
Fig. 11 SEM micrograph showing nucleation of micro-crack on wear surface
4 Conclusions
1) The smooth gradient between the alloys in Si content from high-silicon A390 on one surface to low silicon A356 on the other surface or in the core of the piece was produced using the cast-decant-cast process (turnover technique).
2) It was found that to achieve the perfect and firm interface, the high-temperature liquid of the second alloy was essential. The results indicated that the best wide and interface was obtained at 860 ��C.
3) The width of the transition zone at sample with 35 s decanting time is more than that of the others.
4) The variation of hardness from the outer layer of HV120 to the inner layer of HV75 corresponded to the variation in the Si content, but in the transition zone the hardness had the highest amount. This was related to the finer microstructure as a result of the high-rate solidification of the liquid adjacent to the solidified layer.
5) The wear resistance of the surface was about 35% more than that of the inner layers due to the presence of the higher wear-resistant alloy (A390).
Acknowledgement
The authors wish to express their gratitude to Iran University of Science and Technology for financial support.
References
[1] MORTENSEN A, SURESH S. Functionally graded metals and metal�Cceramic composites: Part 1, Processing [J]. International Material Review, 1995, 40(6): 239-265.
[2] RAJAN T P D, PILLAI R M, PAI B C. Characterization of centrifugal cast functionally graded aluminum-silicon carbide metal matrix composites [J]. Material Characterization, 2010, 61: 923-928.
[3] ZHANG Zhong-tao, LI Ting-ju, YUE Hong-yun, ZHANG Jian, LI Jie. Study on the preparation of Al-Si functionally graded materials using power ultrasonic field [J]. Materials and Design, 2009, 30: 851-856.
[4] SOHRABI BABA HEIDARY D, AKHLAGHI F. Theoretical and experimental study on settling of SiC pieceicles in composite slurries of aluminum A356/SiC [J]. Acta Materialia, 2011, 59: 4556-4568.
[5] SONG Chang-jiang, XU Zhen-ming, LI Jian-guo. Structure of in situ Al/Si functionally graded materials by electromagnetic separation method [J]. Materials and Design, 2007, 28: 1012-1015.
[6] ZHOU Zhang-jian, SONG Shu-xiang, DU Juan, ZHONG Zhi-hong, GE Chang-chun. Performance of W/Cu FGM based plasma facing components under high heat load test [J]. Journal of Nuclear Materials, 2007, 363-365: 1309-1314.
[7] SCANLAN M, BROWNE D J, BATES A. New casting route to novel functionally gradient light alloys [J]. Materials Science and Engineering A , 2005, 413-414: 66-71
[8] CHIRITA G, SOARES D, SILVA F S. Advantages of the centrifugal casting technique for the production of structural components with Al-Si alloys [J]. Materials and Design, 2008, 29: 20-27.
[9] SHABESTARI S G, GHODRAT S. Assessment of modification and formation of intermetallic compounds in aluminum alloy using thermal analysis [J]. Materials Science and Engineering A, 2007, 467: 150-158.
[10] BARLOW J O, STEFANESCU D M. Computer-aided cooling curve analysis revisited [J]. Transactions of the American Foundrymen��s Society, 1997, 104: 349-354.
[11] DWIVEDI D K. Adhesive wear behavior of cast aluminium�Csilicon alloys [J]. Materials and Design, 2010, 31: 2517-2531.
[12] HEKMAT-ARDAKAN A, LIU X C, AJERSCH F, CHEN X G. Wear behaviour of hypereutectic Al-Si-Cu-Mg casting alloys with variable Mg contents [J]. Wear, 2010, 269(9-10): 684-692.
[13] BIROL Y, BIROL F. Sliding wear behaviour of thixoformed AlSiCuFe alloys [J]. Wear, 2008, 265: 1902-1908.
M. MOHAMMADI RAHVARD1, M. TAMIZIFAR1, M. A. BOUTORABI1, S. GHOLAMI SHIRI2,3
1. School of Materials Science and Engineering and Center of Excellence for High Strength Alloys Technology, Iran University of Science and Technology, Tehran, Iran;
2. School of Materials Science and Engineering, Sharif University of Technology, Azadi Ave., P.O. Box 11365-9466, Tehran, Iran;
3. Damavand Petrochemical Company, Phase 2, Pars Special Economic Energy Zone, Asaloye, Boshehr, Iran
ժ Ҫ������-����-���켼���ǽ�������չ������һ���Ʊ������ݶȲ��ϵ��·������������ַ����Ʊ��ھ�������ݶȹ��ܵ�Բ�����������������Ϊ���и���ĥ�Ե�A390���Ͻ�о��Ϊ���нϸ����Ժͼӹ����ܵ�A356���Ͻ��о�о�������ڲ�ͬ�����¶�(750��820��860 ��C)�ͱ����ڲ�ͬ����ʱ��(25��35��45 s)�µ�A390/A356�Ͻ����Ӻ���������ù�ѧ������ɨ��羵�Խ�����б������Խ���������Ӳ�Ƚ��в���������������ڹ����¶�Ϊ860 ��C������ʱ��Ϊ35 s�������£����Ի��һ����ԼΪ500 ��m�ĽӺ����õĽ���㡣�Ƚ�������������о������ĥ���ܡ�
�ؼ��ʣ�A390���Ͻ�A356���Ͻ𣻹����ݶȲ��ϣ�����-����-���켼��
(Edited by Sai-qian YUAN)
Corresponding author: S. GHOLAMI SHIRI; Tel: +98-9173327857; Fax: +98-2166165717; Email: s_gholami85@yahoo.com
DOI: 10.1016/S1003-6326(14)63109-5
