
Effect of stress ratio on long life fatigue behavior of Ti-Al alloy under flexural loading
XUE Hong-qian(薛红前)1, TAO Hua(陶 华)1, SHAO Ren-ping(邵忍平)1, B. CLAUDE2
1. School of Electromechanics, Northwestern Polytechnical University, Xi’an 710072, China;
2. Department of Mechanical Engineering, CNAM/ITMA, 2 rue Conte, Paris 75003, France
Received 4 September 2007; accepted 2 January 2008
Abstract: A new ultrasonic three-point bending fatigue test device was introduced to investigate fatigue life ranging up to 1010 cycles and associated fracture behavior of Ti-Al alloy. Tests were performed at a frequency of 20 kHz with stress ratio R=0.5 and R=0.7 at ambient temperature in air. Three groups of specimens with different surface roughness were applied to investigate the effect of surface roughness on fatigue life. Furthermore, optical microscopy(OM) and scanning electron microscopy(SEM) were used for microstructure characteristic and fracture surface analysis. The S―N curves obtained show that fatigue failure occurs in the range of 105 -1010 cycles, and the asymptote of S―N curve inclines slightly in very high cycle regime, but is not horizontal for R=0.5. Fatigue limit appears after 108 cycles for R=0.7. Surface roughness (the maximum roughness is no more than 3 μm) has no influence on the fatigue properties in the high cycle regime. A detailed investigation on fatigue fracture surface shows that the Ti-Al alloy studied here is a binary alloy in the microstructure composed of α2-Ti3Al and γ-Ti-Al with fully lamellar microstructure. Fractography shows that fatigue failures are mostly initiated on the surface of specimens, also, in very high cycle regime, subsurface fatigue crack initiation can be found. Interlamellar fatigue crack initiation is predominant in the Ti-Al alloy with fully lamellar structure. Fatigue crack growth is mainly in transgranular mode.
Key words: bending fatigue; cycles fatigue; S―N curve; Ti-Al alloy; surface roughness
1 Introduction
Ti-Al alloys appear as potential competitors to steels and super alloys for components in jet engines and turbines, due to their low density, high temperature strength and oxidation resistance, and low thermal conductivity[1-8]. Because Ti-Al alloy components such as low pressure turbine blade and compressor impeller work in high cycle loading condition, fatigue failure becomes the main invalidation mode for the components, so, it has the obvious engineering value to investigate the fatigue behavior of the Ti-Al alloys. As a new generation intermetallic compound, the study of high Nb Ti-Al alloy has been emphasized, which has become a promising high temperature structural material[9-11]. In the recent years, with the understanding of the microstructure characteristic and mechanics properties of the alloy [8-14], the application of Ti-Al alloy extended to the aerospace, aircraft and automobile industries. Considering the practical application of the Ti-Al alloy, high cycle fatigue properties of the alloy must be investigated.
Previous investigations revealed that the Nb addition of 5%-10% (mole fraction) may improve the high temperature strength of Ti-Al alloys[15-17]. Many recent reports focused on the mechanical, physical properties and fatigue crack growth behavior of Ti-Al alloy[15-19]. Since the ultrasonic three-point bending fatigue test machine was designed and applied in our laboratory, the giga-cycle fatigue behavior of Ti-Al alloy has been investigated initially by BAYRAKTAR et al[1]. In order to further investigate the fatigue behavior of the Ti-Al alloy, the present work is devoted to investigate very high cycles fatigue life of the Ti-Al alloy with different stress ratios.
2 Experimental
2.1 Materials
The chemical composition of the alloy was Ti-45Al- 8.5Nb-0.2W-0.2Mo-0.3B (mole fraction, %). Prior to machining testing specimens, the casting ingot with 90 mm in diameter and 150 mm in height was processed by hot isostatic pressing(HIP) at a pressure of 175 MPa and a temperature of 1 200 ℃ for 4 h. Subsequently, stabilization heat treatment was conducted at 1 000 ℃ for 20 h. Microstructure observations were carried out by optical microscope(OM), scanning electron microscope (SEM, JOEL-Cambridge 20 kV) and energy dispersive spectroscopy(EDS).
2.2 Ultrasonic test system
In order to investigate the fatigue properties of the alloy up to 1010 cycles, an ultrasonic three-point bending fatigue test system was used[11]. The main components of the ultrasonic system are converter, booster, amplifier and specimen. The converter is a piezoelectric transducer, which converts an electronic signal at a frequency of 20 kHz into a mechanical displacement at the same frequency. The electronic signal is supplied by a power supply. The amplifier and converter are connected by means of booster, which transforms the static charge to the amplifier. The static charge is loaded in the part of the booster, which is of zero displacement. And also, the amplifier supplies a large vibration displacement on the specimen. A maximum strain occurs at the center of the specimen. The computer system including A/D and D/A cards can control all the test process and keep all acquisition data during the test. The schematic description of the testing system is shown in Fig.1.
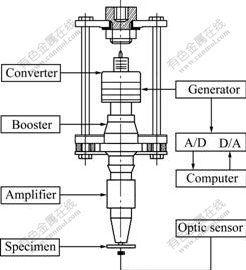
Fig.1 Ultrasonic fatigue test system
2.3 Fatigue testing method
The ultrasonic fatigue testing method was used to perform fatigue lifetime and fracture mechanics investigations at stress ratio R=0.5 and R=0.7. Specimens were excited to resonance vibration at a frequency of approximately 20 kHz, which leads to maximum strain amplitudes in the specimen’s center. The specimen has 20 kHz transverse intrinsic vibration frequency. Fig.2 illustrates the dimension of specimen and its strain fields in testing. Strain gauges were used to measure the cyclic strain and to calibrate the experiments. At the amplifier’s end a vibration gauge served to measure the vibration displacement amplitude, which was used to control the experiment. The displacement amplitude of the specimen was kept constant at pre-selected magnitude with high accuracy (within ±1%). The stress amplitudes were calculated using the measured strain amplitudes and elastic modulus of the materials.
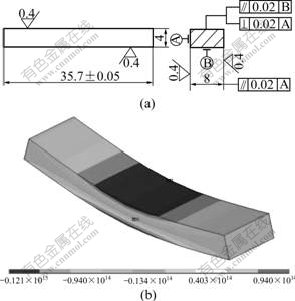
Fig.2 Dimension of testing specimen (a) and strain fields in fatigue specimen (b)
S―N experiments were performed under constant amplitude using the staircase method. The staircase method was primarily used to determine the statistical properties of a fatigue limit. First, the fatigue limit had to be estimated and a fatigue life test was then conducted at this stress level. In the experiments, specimens were loaded until failure or at least 109 cycles. If the specimen failed prior to 109 cycles, the next specimen had to be tested at lower stress amplitude level. If they did not fail, the new test was run at a higher stress amplitude level. The standard deviations are estimated as

( ≥0.3)
≥0.3)
or
σs, FL=0.053×Sd ( )≤0.3
)≤0.3
The stress amplitude levels S spaced equally with a chosen increment Sd are numbered i, where i=0 is for the lowest stress level S0. Denoting by ni the number of the less frequent event at the stress level i, two quantities A and B are calculated:


The mean endurance limits at 109 cycles and standard deviations were evaluated. Twenty specimens and thirty specimens were used respectively in each testing series (with R=0.5 and R=0.7) to obtain statistically meaningful data. Previously obtained S―N data of the alloy tested with R=0.1 were shown for comparison.
In order to understand the influence of surface roughness on the fatigue properties, the specimens with different surface roughness were used in fatigue test. According to the surface roughness value, they were divided into three groups as follows: surface roughness less than 0.5 μm (group A); 0.5-1.5 μm (group B); 1.5-3 μm (group C). Every specimen used for fatigue test with R=0.7 was measured.
3 Results and discussion
3.1 Microstructure
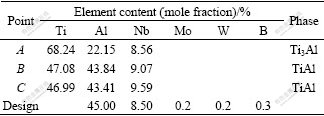
The microstructure of the alloy is presented in Fig.3. As shown in this figure, the structure is fully lamellar and consists of colonies of α2/γ lamellae. The colonies size is in the range of approximately 50-150 ?m, the lamellar spacing is 2-4 ?m, and some γ grains exist at the boundary of the colonies. EDS analysis results of the phases in Fig.3(a) are listed in Table 1, which suggest that the lighter region (point A) is Ti3Al phase, the darker lath is TiAl phase (point B), and there exists a little γ-region (point C). Static bending tests were carried out, and the flexural strength is 850 MPa.
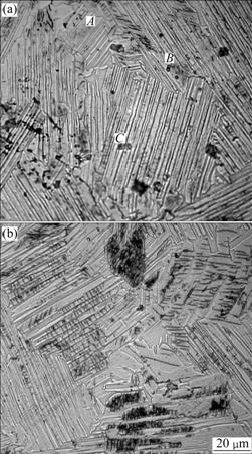
Fig.3 Lamellar microstructures of Ti-Al alloy in two perpendicular planes
Table 1 EDS analysis results of phase in Fig.3(a)
3.2 High cycle fatigue life
The results of constant amplitude lifetime investigations are presented in Figs.4 and 5. Specimens that did not fail are marked with arrows. For the fatigue test with R=0.5, many specimens are failed after 107 cycles and also some specimens are failed after 109 cycles. Between 106-1010 cycles, the lines with constant slope indicate increasing mean lifetimes with decreasing cyclic stress (shown in Fig.4). At the level of 106 cycles, the stress amplitude is approximately 175 MPa; at the level of 109 cycles, however, the value is 156 MPa (shown in Fig.4). Three groups of specimens with different surface roughness were used in fatigue test with R=0.7. The experimental results show that fracture occurs between 105-108 cycles, and most of specimens have fatigue fail in the range of 105-106 cycles. Above approximately 2×10⁷ cycles, failures are sparse, and the data are approximated with lines parallel to the abscissa. Fatigue experimental results of three groups of specimens with different surface roughness are shown in Fig.5. There is no obvious effect of surface roughness of the specimen on the fatigue life in the high cycle regime, if the specimens have high precision surface (<3 μm).
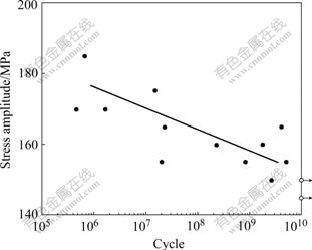
Fig.4 S―N curve of Ti-Al alloy (R=0.5)
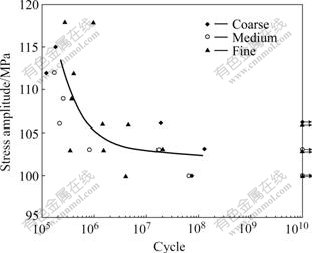
Fig.5 S―N curve of Ti-Al alloy (R=0.7)
The S―N characteristics obtained in this experiment are shown in Fig.6, in which the experimental results with R=0.1 reported in Ref.[1] are also plotted for comparison. In this diagram, the S―N curve in the sloped portion (<107 cycles= with R=0.5 and R=0.7 has lower slope, however, the fatigue data obtained with R=0.1 have higher slope. Fatigue fracture occurs in very high cycle range with low stress ratio (R=0.1 and R=0.5)[1]. Although the S―N curve has a little incline in the range of 5×10⁷-5×10⁹, some specimens are failed over 5×10⁷ cycles. However, there is no fatigue fracture occurred over 108 cycles with R=0.7. This fact indicates that the stress range in tension is the predominant factor to determine the fatigue life. The mean endurance limits and their standard deviation with stress ratio R=0.1, 0.5 and 0.7 are calculated using staircase method, and the results are (190±18), (156±14), (101±6) MPa, respectively. The standard deviations of the mean endurance limits of the alloy are 6%-9% mean fatigue strength of the alloy tested at three different stress ratio. The scatter is typical for the alloy in any case of stress ratio, and the assumption of an endurance limit in the region of N=107 cycles is not credible.

Fig.6 Comparison of fatigue results tested with three different stress ratios
3.3 SEM observation of fracture surfaces
3.3.1 Static three-point bending test
The fracture surfaces of specimen subjected to static load are shown in Fig.7. It can be found that crack growth occurs intermittently rather than continuously, and crack initiation tends to occur parallelly to the lamellar interfaces. However, there are many small crack branching, crack deflection and crack extension into a neighboring lamellar colony.

Fig.7 Crack path morphologies in side A of specimen (a), crack propagating tortuously with crack branching (b) and crack deflection and some secondary cracks arrested in their propagation (c)
3.3.2 Three-point bending fatigue test
From fractographic observations on the specimens of Ti-Al alloy tested with two kinds of stress ratio (R=0.5 and R=0.7), all fracture initiations in the smooth specimens are found to occur at the surface or subsurface of specimen where the stress is the largest, and cracks are found to nucleate at weak interfaces by decohesion of lamellae parallel to the fracture surface and then propagate tortuously between the grains and translamellarly. Many secondary cracks depart perpendicularly from fracture surfaces and are arrested in their propagation by the unfavorable lamellae orientations, and many fracture surface of specimens failed in high cycles range has small zones characterized by some plastic deformation.
The fatigue fracture surfaces of specimens tested with R=0.5 are illustrated in Figs.8 and 9. For the fatigue specimen with low fatigue life (105-106 cycles), fracture initiation occurs at the surface of specimen, fatigue crack growth is predominant in the translamellar pattern, and many small cracks appear at the beginning but do not propagate. However, for the fatigue specimen with high or very high cycle fatigue life (>106 cycles), although fracture initiates at weak interface between lamellas, secondary cracks are more evident, sometimes the second cracks grow more than 200 ?m, and the second cracks cause cleavage step (Fig.8). River pattern fatigue characteristic is also distinct (Fig.9).
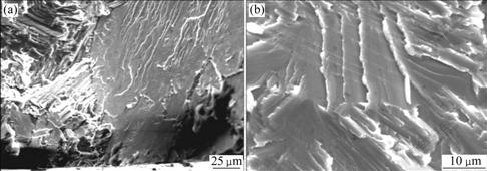
Fig.8 Fatigue fracture surfaces tested at σmax=610 MPa with Nf=1.8×10⁹ cycles (R=0.5): (a) Facet surface at fatigue initiation site; (b) Interlamellar decohesion caused by second cracks

Fig.9 Surface fatigue initiation with characteristic of river patterns (R=0.5, Nf=4.1×10⁹ cycles)
The fatigue fracture surfaces of specimens tested at R=0.7 are shown in Figs.10 and 11. Because the nominal peak stress at stress ratio R=0.7 is near the maximum bending stress, most of the specimens fatigue fail in the 105-107cycles, and most of the fatigue initiation occurs on specimen surface. The fracture surfaces of three kinds of specimens with different surface roughness show that there is no evident difference in fatigue fracture characteristic between the three kinds of specimens. That is, for the fatigue specimen with low fatigue life (<106 cycles), fatigue fracture initiation occurs on the surface of specimen, however, fatigue crack initiation tends to occur parallelly to the lamellar interfaces with the nucleated lamellar colonies. For the higher fatigue life specimen, it shows large facet in the fatigue initiation and distinct propagation crack.

Fig.10 Fatigue initiation and propagation (a) and translamellar crack growth (b) of specimen (R=0.7; medium surface; Nf=7.95×10⁵ cycles)
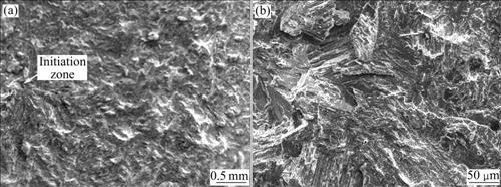
Fig.11 Fatigue initiation and propagation (a) and fatigue initiation with cleavage surface (b) of specimen (R=0.7; medium surface; Nf=6.27×10⁷ cycles)
The fracture surface of the specimens with medium roughness (0.5-1.0 ?m) has the same fatigue fracture characteristic compared with the fine roughness surface specimen. The surface fatigue initiation with facet and crack growth in the translamellar pattern can be seen in Fig.10. For the high cycle fatigue specimen, fatigue can also initiate from subsurface (Fig.11).
The fatigue fracture surface with coarse roughness (>1 ?m) surface has the same fatigue fracture surface compared with fine surface specimen. However, multiple fatigue initiations on the surface can be often seen for the lower cycle fatigue fracture specimens. Furthermore, the secondary crack arrested on the surface occurs for most of fatigue fracture specimens.
3.4 Discussion
3.4.1 Crack initiation
Due to low fracture toughness and fast crack growth rates in Ti-Al alloy, the fatigue life is mainly controlled by the crack initiation and growth of small cracks. In the SEM images with higher magnification, the transition between stable crack growth and fast fracture is difficult to distinguish for the specimens with low fatigue life. Comparatively, for the fatigue fracture surface of specimens with high cycle life (>107 cycles), the river pattern of stable crack growth can be seen clearly. It shows a small portion of smooth area on the tensile side of the fracture surfaces produced by fatigue crack growth. Fatigue crack initiation mode has direct relation to the fatigue life. For low fatigue life, fatigue crack always initiates from specimen surface. Subsurface fatigue initiation (from the microstructure defect, γ grain in the boundary of colonies) can also be seen when fatigue life is more than 107 cycles, specially, when the fatigue life is more than 108 cycles. Subsurface fatigue initiation has higher probability.
Under high cyclic stress, fatigue crack is easy to initiate from surface slip band or boundary of grain. In the optical microscope fractograph, many small cracks can be seen to initiate from the surface of specimen at cyclic loading, and many cracks occur around the boundary of lamellar colonies (Fig.12). The small cracks have the following characteristics: 1) the length of the small cracks is comparable of dimension of colonies; 2) most of small cracks are perpendicular to the lamellas; and 3) small cracks occur on the boundary between colonies, where the stress is the highest.

Fig.12 Small fatigue crack around fatigue initiation
However, the fatigue fracture of specimen does not initiate from the small cracks on the boundary grains. Most of the small cracks are arrested, only the crack between lamellas in the lamellar colonies can grow and lead to fatigue initiation. The other small cracks around the lamellar colonies can accelerate the interlamellar crack growth, with the increase of fatigue life. More and more small cracks produce and propagate, which accelerates the fatigue initiation. So, in the optical photos, many small cracks can be seen around the fatigue initiation, and facet can also be seen in fatigue initiation.
Specimen surface slip is weakened at lower cyclic stress under the situation, and internal microstructure defect can cause fatigue crack initiation. The internal microstructure defects are from the γ grain separated out from lamellar colonies or other cast defect such as void after HIP or heat treatment. Stress concentration is produced in the defect under cyclic stress. Because of stress concentration, the fatigue crack initiates in the defect. Besides, some small cracks around the fatigue crack initiation produce and propagate, which accelerate fatigue crack initiation and growth.
For the lamellar Ti-Al alloy, due to the presence of hard α2 and relatively soft γ phases in the lamellar grains, which gives the lamellar colony a large intrinsic ductility, although the fatigue initiation is from interlamellas of α2/γ, it still has long fatigue life.
3.4.2 Fatigue crack growth
Fatigue crack growth occurs intermittently rather than continuously, either due to the high strength of α2 (Ti3Al) lath and narrow lamellar lath spacing or in the case that the crack tip encounters the colony boundaries. As a result the cracks do not propagate entirely along a single lamellar lath interface, rather they frequently tend to jump to adjacent or remote lamellar lath interfaces.
The feature of the fast fracture surfaces is similar to the ones seen at static bending loading, that is, brittle transgranular failure of the lamellar colonies, interlamellar failure when the lamellae are oriented perpendicularly to the loading direction and translamellar at orientation along to this direction.
4 Conclusions
1) The Ti-Al alloy tested with R=0.7 exhibits a fatigue limit. This is in contrast to the results tested with R=0.5, which show a continual downward slope on the S―N diagram. Stress ratio plays an important role in determining the fatigue life.
2) Fatigue life of Ti-Al alloy is mainly determined by fatigue crack initiation. Most of fracture initiations in the smooth specimens occur on the surface where the principal stresses are the highest. Fatigue life not only depends on cyclic stress range, but also depends on lamellas orientation of lamellar colonies subjected to the maximum tension stress. The scatter of fatigue data is associated with random orientation of colonies. Subsurface fatigue initiation occurs in the high cycle regime.
Acknowledgements
The testing material was supplied by Dr. YAN Y. Q. of Northwest Institute for Nonferrous Metal Research, China.
References
[1] BAYRAKTAR E, BATHIAS C, XUE H Q, TAO H. On the giga cycle fatigue behaviour of (α2-Ti3Al and γ-TiAl) alloy [J]. International Journal of Fatigue, 2004, 26(2): 1263-1275.
[2] JUNG J Y, PARK J K, CHUN C H. Influence of Al content on cast microstructures of Ti-Al [J]. Intermetallic, 1999, 7: 1033-1041.
[3] KRUZIC J J, CAMPBELL J P, RITCHIE O. On the fatigue behaviour of γ-based titanium aluminides: Role of small cracks [J]. Acta Mater, 1999, 47(3): 801-816.
[4] NIEH T G, HSIUNG L M, WADSWORTH J. Superplastic behavior of a powder metallurgy TiAl alloy with a metastable microstructure [J]. Intermetallics, 1999, 7: 163-170.
[5] IMAYEV V M, IMAEV R M, KUZNETSOV A V, SHAGIEV M R, SALISHCHEV G A. Superplastic properties of Ti-45.2Al-3.5 (Nb, Cr, B) sheet material rolled below the eutectoid temperature [J]. Mater Sci Eng A, 2003, 348: 15-21.
[6] PARK Y S, NAM S W, HWANG S K, KIM N J. The effect of the applied strain range on fatigue cracking in lamellar TiAl alloy [J]. J Alloys Compd, 2002, 335: 216-223.
[7] XUE H Q, BAYRAKTAR E, BATHIAS C, TAO H. Very high cycle fatigue behaviour of TiAl alloy [C]// Proceedings on the VHCF-3: the 3rd International Conference on Very High Cycle Fatigue. Kyoto, Japan, 2004: 440-447.
[8] WIEZOREK J M K, DELUCA P M, FRASER H L. Mechanisms of plasticity and fracture of partially lamellar titanium aluminum [J]. Intermetallics, 2000, 8: 99-113.
[9] YAN Y Q. Microstructure observation and compressing tests of TiAl based alloys containing high Nb [J]. Mater Sci Eng A, 2000, 280(1): 197-191.
[10] LIN S K, LEE Y L, LU M W. Evaluation of the staircase and the accelerated test methods for fatigue limit distributions [J]. International Journal of Fatigue, 2001, 23: 75-83.
[11] XUE Hong-qian. Explanation on giga cycle fatigue of materials in tension, bending and torsion loading [D]. Paris: ITMA/CNAM, 2005.
[12] GNANAMOORTHY R, MUTOH Y, MIZUHARA Y. Effects of niobium addition on the sustained-load cracking characteristics in lamellar microstructure γ-base TiAl [J]. Mater Sci Eng A, 1995, 203: 348-355.
[13] WEGMANN G, GERLING R, SCHIMANSKY F P. Temperature induced porosity in hot isostatically pressed γ-titanium aluminide alloy powders [J]. Acta Mater, 2003, 51: 741-752.
[14] ROHATGI A, HARACH D J, VECCHIO K S, HARVEY K P. Resistance curve and fracture behaviour of Ti-Al3Ti metallic- intermetallic laminate (MIL) composites [J]. Acta Mater, 2003, 51: 2933-2957.
[15] UMAKOSHI Y, YASUDA H Y, NAKANO T. Plastic anisotropy and fatigue of TiAl PST crystals: A review [J]. Intermetallics, 1996, 4: S65-S75.
[16] CAMPBELL J P, KRUZIC J J, LILLIBRIDGE S, RAO K T V, RITCHIE R O. On the growth of small fatigue cracks in γ-based titanium aluminides [J]. Scripta Mater, 1997, 37(5): 707-712.
[17] ZHU S J, PENG L M, MORIYA T, MUTOH Y. Effect of stress ratio on fatigue crack growth in TiAl intermetallics at room and elevated temperatures [J]. Mater Sci Eng A, 2000, 290: 198-206.
[18] PIPPAN R, HAGENEDER P, KNABL W, CLEMENS H, HEBESBERGER T, TABERNIG B. Fatigue threshold and crack propagation in γ-TiAl sheets [J]. Intermetallics, 2001, 9: 89-96.
[19] HUANG B Y, HE Y H, WANG J N. Improvement in mechanical and oxidation properties of TiAl alloys with Sb additions [J]. Intermetallics, 1999, 7: 881-888.
Foundation item: Project(50775182) support by the National Natural Science Foundation of China; Project(2006E133) supported by the Natural Science Foundation of Shaanxi Province, China
Corresponding author: XUE Hong-qian; Tel: +86-29-88493962-606; Fax: +86-29-88491214; E-mail: xuedang@nwpu.edu.cn
(Edited by YUAN Sai-qian)

