���Ǿ��������Ե����β��ϱ�����Ϊ
��Դ�ڿ����й���ɫ����ѧ��(Ӣ�İ�)2017���3��
�������ߣ������� ͯ��Ȩ �·�
����ҳ�룺616 - 626
�ؼ��ʣ����Σ�������Ϊ���ߴ�ЧӦ��ģ�ͣ�����������
Key words��micro-forming; deformation behavior; size effect; model; intragranular heterogeneity
ժ Ҫ������ʵ�����ֵ��ģ����̽�������в��ϱ�����Ϊ�;���������Ϊ�Ĺ�ϵ������ʵ��������������Ӧ������ɢ�����Ⱦ����ߴ��(T/d)�ļ�С��������������Ӧ���ı仯�����෴����Ӳ�Ȳ��Խ��������ÿ��������������صı�����Ϊ������ֲ��������С�����������Խ�ٵ�����Խ�����γ��ױ������ͷ������μ��������������һ��ͬʱ���Ǿ����ߴ硢���γߴ���徧��������Ϊ�ijߴ�����ģ�ͣ���ͨ���Ա�ʵ��֤ʵ�˸�ģ�͵���Ч�Ժ�ʵ���ԡ�
Abstract: To describe the relationship between the whole material deformation behavior and each grain deformation behavior in micro-forming, experimental and numerical modelling methods were employed. Tensile test results reveal that contrary to the value of flow stress, the scatter of flow stress decreases with the increase of thickness-to-grain diameter (T/d) ratio. Microhardness evaluation results show that each grain owns unique deformation behavior and randomly distributes in each specimen. The specimen with less number of grains would be more likely to form an easy deformation zone and produce the concentration of plastic deformation. Based on the experiment results, a size-dependent model considering the effects of grain size, geometry size, and the deformation behavior of each grain was developed. And the effectiveness and practicability of the size-dependent model were verified by experimental results.
Trans. Nonferrous Met. Soc. China 27(2017) 616-626
Zhen-wu MA, Guo-quan TONG, Feng CHEN
College of Mechanical and Electrical Engineering, Nanjing University of Aeronautics and Astronautics, Nanjing 210016, China
Received 8 March 2016; accepted 15 June 2016
Abstract: To describe the relationship between the whole material deformation behavior and each grain deformation behavior in micro-forming, experimental and numerical modelling methods were employed. Tensile test results reveal that contrary to the value of flow stress, the scatter of flow stress decreases with the increase of thickness-to-grain diameter (T/d) ratio. Microhardness evaluation results show that each grain owns unique deformation behavior and randomly distributes in each specimen. The specimen with less number of grains would be more likely to form an easy deformation zone and produce the concentration of plastic deformation. Based on the experiment results, a size-dependent model considering the effects of grain size, geometry size, and the deformation behavior of each grain was developed. And the effectiveness and practicability of the size-dependent model were verified by experimental results.
Key words: micro-forming; deformation behavior; size effect; model; intragranular heterogeneity
1 Introduction
The inevitable trend of product miniaturization in many industries such as biological medicine, communication, aerospace, and military makes it necessary to develop efficient micro-manufacturing technologies for mass fabrication of micro-scaled parts. As one of the low-energy production methods, micro-forming process has attracted much attention due to its good product quality, low cost and high yield. However, the size effects of material deformation behavior have been observed by many research groups, which means that the mature macro-forming theories disabled in the analysis of micro-forming deformation behavior directly [1-3].
In order to obtain an in-depth understanding of material deformation behavior in micro-forming, plenty of experimental studies have been conducted. In the tensile test of thin-sheet, KALS and ECKSTEIN [3] found that surface grains are crucial in the overall deformation behavior and the flow stress reduces with the decrease of the specimen dimensions. CHAN et al [4] investigated the grain size effect via micro-bulk compression of pure copper. It was concluded that along with the increase of grain size, the strengthening effect of grain boundary gradually dwindles, thus leading to the decrease of flow stress. In addition, the studies on size effects have been extended to the complex micro- forming processes. WANG et al [5] investigated the effect of die cavity size on micro-formability by coining tests. They concluded that the deformation can be considered as the single grain deformation when the grain size is larger than the groove width. The investigation by EICHENHUELLER et al [6] showed that elevated temperatures are effective to minimize and control the scatter effects in micro-extrusion forming processes. XU et al [7,8] investigated the size effects on deformation behavior of brass foil via micro-blanking tests. They found that as the foil thickness decreases, the ultimate shearing strength increases and the fracture mechanism of micro-blanking significantly changes from shear dimple to slip separation.
Furthermore, in order to describe and predict the material deformation behavior in micro-forming process, appropriate constitutive models have been developed. GEIGER et al [9] developed a ��free surface layer�� model theory which was accepted by most researchers and used to interpret ��the smaller is weaker�� phenomena in some forming processes such as micro-bulk extrusion [10] and thin-sheet bending [11]. Besides, by combining free surface layer model with the theories of single crystal and polycrystal, LAI et al [12] proposed a mixed material model, which contains a size-independent part and a size-dependent part. Moreover, a composite model theory shows that material substrate is composed of grain-interiors and grain-boundary work-hardened layer [13]. Employing the composite model and the free surface layer model, LIU et al [14] developed a constitutive model considering the grain and geometry size effects simultaneously. In addition, some phenomenological models were developed [15-17].
The above reviews indicated that most investigations were focused on the phenomenon study of size effects on material deformation behavior. Actually, different from the macro-scale parts, micro-parts contain only a few grains. The deformation behavior of each grain plays a significant role in the whole material behavior, such as the scatter of process parameters and inhomogeneous material flow, which needs further research. The purpose of this study is to investigate the relationship between the whole material behavior and each grain deformation behavior and then develop a model to describe it. Firstly, tensile tests and micro-indentation tests were conducted to study the size effects on the deformation behavior of CuZn20 sheet foils, both qualitatively and quantitatively. Based on the experimental results, a size-dependent model considering the effects of grain size, geometry size and the deformation behavior of each grain was developed. Finally, the developed model was verified by two sets of different experimental data.
2 Experimental
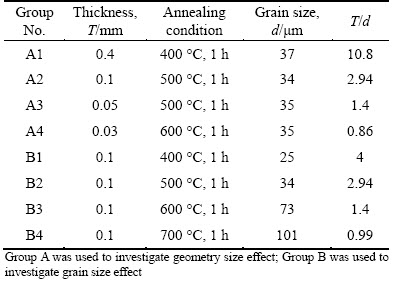
Sheet foils of CuZn20 with four thickness values of 0.4, 0.1, 0.05 and 0.03 mm were selected as the testing materials. To investigate both the geometry size effect and grain size effect, the materials were annealed at different annealing temperatures and holding time. The heat treatments were conducted in vacuum with a vacuum degree of 1.5 �� 10-3 Pa to avoid the sheet foils from oxidation. After being etched, the average grain size of the heat-treated sheet foils was measured by transversal method. The annealing conditions and corresponding group parameters are listed in Table 1.
Table 1 Annealing conditions and corresponding group parameters
The mechanical properties of the sheet foils were measured via uniaxial tensile tests. Based on the ASTM-E8 standard, the initial measuring length L0 and specimen width Lw for all specimens were kept constant at 50 and 12.5 mm, respectively. The elongations of the specimens were measured by an extensometer with the gauge length of 50 mm. The strain rate was 0.001 s-1 for all experiments. The true stress-strain curves of the sheet foils were obtained by averaging the data of 6 experiments for each group.
In order to investigate the deformation behavior of individual grains, the microhardness evaluation was performed on cross-section of the specimen perpendicular to the loading direction for all deformed sheet foils, as illustrated in Fig. 1. The sheet foils were molded, polished and etched. The Vickers hardness of the specimens was obtained with a 10 g load by holding 10 s. The indents were assured to locate in grain-interior and keep a distance of no less than 10 ��m from the edge and 20 ��m from the adjacent ones.

Fig. 1 Schematic illustration of microhardness measurement
3 Results and discussion
3.1 Geometry size effect on flow stress
The true strain�Cstress curves for different kinds of sheet foils with similar grain size are shown in Fig. 2(a). It can be seen that the flow stress and elongation decrease with the decrease of the thickness of sheet foils.
In the experiment performed by MIYAZAKI et al [18], they observed that there are only a few dislocations distributing inside the grain-interior and the three-fold node of grain-boundaries in the surface grains of material. Besides, according to the metal physics theory, grains located at the surface layer of material have less constraint than internal ones. Therefore, the strain hardening behavior of the surface grains is much weaker than that of the internal ones, so, plastic deformation of the surface grains is much easier. In micro-forming process, the geometry size and the grain size have the same order of magnitude, so, the surface grains are crucial to the overall material behavior. As shown in groups A1-A4 of Table 1, the grain sizes of sheet foils are all approximately 35 ��m, so, the share of surface grains increases with the decrease of the thickness, thus leading to easier plastic deformation and weaker strain hardening of the material. Therefore, the flow stress decreases with the decrease of the thickness of sheet foils.
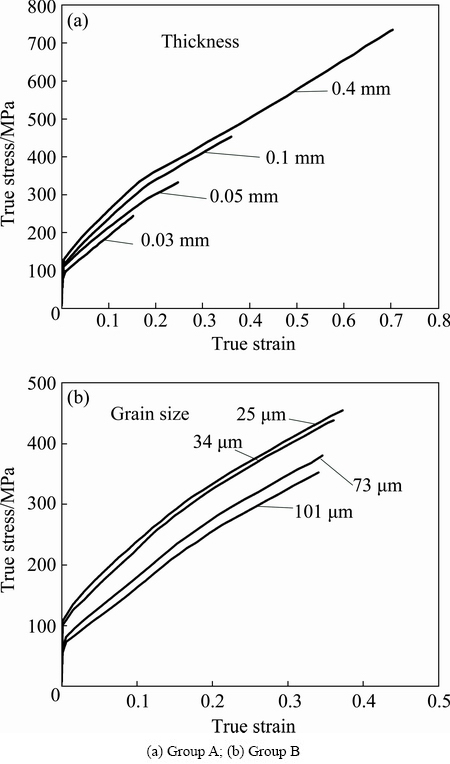
Fig. 2 True stress-true strain curves for different groups
3.2 Grain size effect on flow stress
Figure 2(b) shows the true strain�Cstress curves for sheet foils with different grain sizes but the same thickness, indicating that the flow stress and elongation decrease with the increase of the grain size.
The atomic arrangement at grain boundary is more disordered than that in grain-interior. The grain boundary works as a rigid network structure during plastic deformation. Dislocations slip towards and pile up against the grain boundary, which produce strain hardening [19]. As shown in groups B1-B4 of Table 1, the sheet foils own the same thickness, so, the total grain boundary area decreases with the increase of grain size. The dislocations move more easily but pile up more difficultly in the specimens with larger grain size, which eventually results in easier plastic deformation and less strain hardening of the material. Therefore, the smaller the grain size is, the higher the flow stress will be.
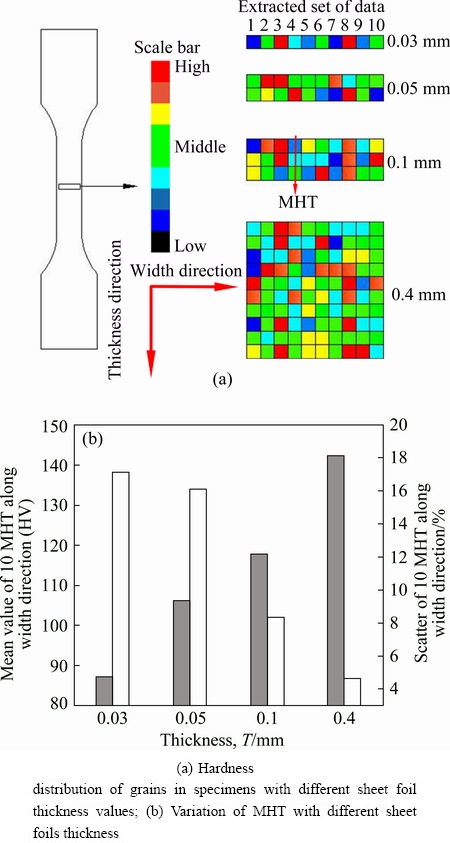
Fig. 3 Hardness of grains in different specimens
3.3 Deformation distribution of different grains
The effect of deformation hardening can be characterized by hardness evaluation because the plastic deformation has a positive correlation with hardness. In order to illustrate the hardness distribution of specimens better, the hardness values of grains are expressed as different colored blocks. As shown in Fig. 3(a), different colored blocks represent different hardness values of grains and the relative hardness of different colored blocks is annotated by the scale bar which is established based on certain testing results (Section 2). Ten sets of data are extracted along the width direction from multiple specimens with different thickness values, presenting that the hardness distribution of different grains is disturbed. Compared with other deformation directions, the thickness direction owns the minimum number of grains. To investigate the combined contribution of grains in the thickness direction, a hardness factor MHT is defined, which is the mean hardness value along the thickness direction. The variation trend of mean MHT value of the extracted 10 sets of data from sheet foils with different thickness values is shown in Fig. 3(b). It is found that with the increase of sheet foil thickness, the mean MHT value increases while the scatter value (ratio of standard deviation to mean MHT value) decreases. In addition, the scatter value of the sheet foil with thickness of 0.4 mm is small, which means that the layout of different grains along the thickness direction is substantially different while the MHT value in the width direction is almost the same.
Along the loading direction, the soft grains deform toward their favorable orientation, while the hard ones deform in their unfavorable orientation. As described in SACHS model [20], each grain undergoes the same stress, which is equal to the external stress. When the stress of a specimen is ��, the stress in each grain is also ��. Due to different properties of different grains, deformation will occur in soft grains more easily than in hard ones. Based on the assumption that the shape change performs in the way of minimizing energy consumption [21], soft grains consume the minimal plastic work. When it comes to a specimen with few grains, minimization of energy consumption can be achieved by developing a combination of soft grains with soft grains. Once this weak combination is formed, a significant deformation will be concentrated in this area, eventually leading to inhomogeneous deformation and premature fracture. As shown in Fig. 4, the specimen with less number of grains in the thickness direction is more likely to form the easy deformation zone which is composed of a high proportion of soft grains. This can explain why the specimen with small number of grains in thickness direction presents small elongation, as mentioned in Sections 3.1 and 3.2. For the specimen with many grains, soft grains and hard grains are evenly and randomly distributed, which is difficult to form the weak combination of soft grains. Deformation along different directions is homogeneous. Grains in the specimen are homogeneous hardening with the increase of strain, so, with the increase of grain number in specimens, the mean value of MHT increases and the scatter of MHT value decreases (Fig. 3(b)). Besides, shape change and rolling for some grains may occur during deformation, which play an important role in transferring hardening and reducing strain concentration. As the differences among grains narrow, the probability of forming the concentration of plastic deformation will be further reduced. Therefore, more homogeneous deformation and greater fracture strain will occur in specimens with large number of grains.
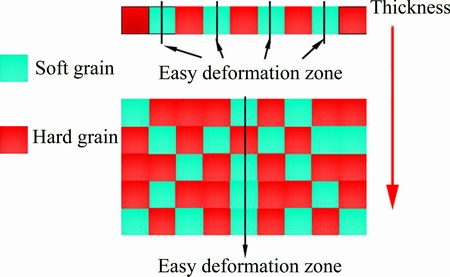
Fig. 4 Schematic illustration of easy deformation zone
3.4 Scatter of flow stress
Figure 5 depicts the coefficient of variation (ratio of standard deviation to mean flow stress) of flow stress in groups A and B, which quantifies the scatter of flow stress. In group A, sheet foils with thickness of 0.03 mm own the lowest fracture true strain of 0.15. Therefore, only the scatter effect of flow stress in each thickness with the true strain of 0.15 was investigated. As shown in Fig. 5(a), the coefficient of variation increases with the decrease of sheet foil thickness. The coefficient of variation reaches 3.1% at the thickness of 0.1 mm, which is almost the same with that of 0.4 mm. However, as the thickness of sheet foils decreases from 0.1 to 0.03 mm, the coefficient of variation increases promptly and the relative variation trend turns to be steep. In group B, the scatter of flow stress with the true strains of 0.1, 0.2 and 0.3 was investigated. As shown in Fig. 5(b), the variation trend is consistent with group A, decreasing with the increase of T/d ratio. Besides, the coefficient of variation decreases with the increase of true strain when the grain size is 25 ��m. However, with the increase of grain size, this trend is not obvious or even disappears. These results indicate obvious size effect.
As shown in Fig. 3(a), each grain owns unique deformation behavior and randomly distributes in each specimen. With the decrease of geometry size or increase of grain size, the number of grains becomes less and less in specimens. As the geometry size and the grain size are in the same order of magnitude, the deformation behavior of each grain will dominate the properties of the whole material. The strong anisotropy of the mechanical properties of different grains will lead to a strong scatter value in the forming properties of different specimens. With the increase of strain, deformation and rolling occur in some grains. The strain incompatibility and stress gradient which generates due to different properties of neighboring grains decrease during the plastic deformation [22]. However, with the reduction of the grain number in specimens, deformation and rolling for grains will become increasingly difficult or even impossible. The deformation of each grain is not only used to increase the strain compatibility among different grains but also it must comply with the shape development of the whole material. This difference can illustrate the reason why the scatter of flow stress shows different variation trends at different strains for specimens with different grain sizes.
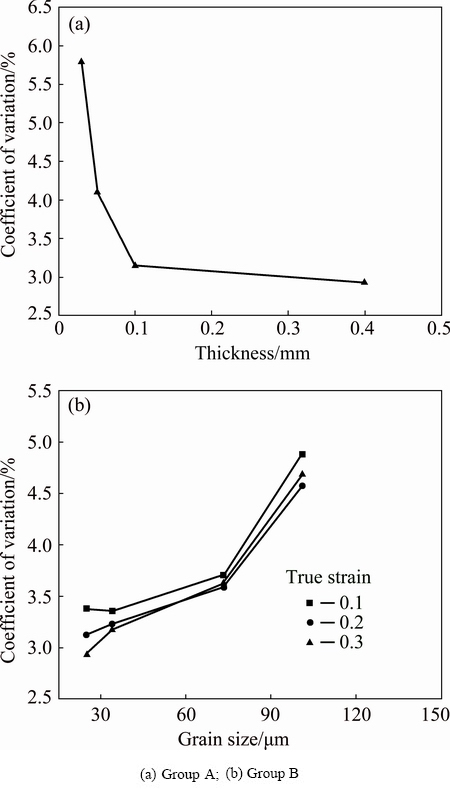
Fig. 5 Scatter of flow stress for different groups
4 Establishment of size-dependent model
Based on the above experimental results, it can be concluded that the material behavior in micro-forming has a close correlation with the grain size, geometry size and deformation behavior of each grain. In this section, these factors are coupled in model building.
4.1 Grain size effect
Previous studies have shown that the regions adjoining grain boundaries harden at a much higher rate than grain interiors. According to this model theory, the flow stress of polycrystalline aggregate can be redescribed as
��S=�Ȧ�GI+(1-��)��GB (1)
where ��=AGI is the grain size factor, representing the areal fraction of grain-interiors and (1-��)=AGB represents the share of grain-boundary layers. ��GI and ��GB are the flow stress values of grain-interiors and grain-boundary layers, respectively. It is known that the real shaped grains can be developed with crystal plasticity model theory [23]. However, considering that the thickness of grain-boundary layer is a key parameter in micro-forming, which is related to the grain diameter and can be calculated by the following equation [13]:
t=0.133d 0.7 (2)
The shape of grains is assumed to be regular hexagon, with diameter d and thickness of grain-boundary layer t. The areal fractions of the two regions are expressed by
 (3)
(3)
 (4)
(4)
Substituting Eq. (2) into Eq. (3), it can be found that the areal fraction of grain-interiors increases with the increase of grain size. Based on Eq. (1), it can be concluded that with the increase of grain size, the grain-interiors regions will play an increasing significant role in the whole material behavior.
4.2 Geometry size effect
Grains in specimen can be divided into two portions: surface portion and inner portion. Based on the experimental results, surface grains can induce weakening effect on micro-specimens [12,24].
The deformation behavior of surface grains resembles that of single crystals [25]. Therefore, the flow stress of surface grains is equal to that of grain-interiors, as shown in Fig. 6.
��Sur=��GI (5)
In contrast to the surface grains, grains located in the interior are surrounded by neighbouring ones, so their deformation behavior resembles that of polycrystal ones [25]. The flow stress of inner grains is equal to that of polycrystalline aggregate.
��Inner=��S=AGI��GI+AGB��GB (6)
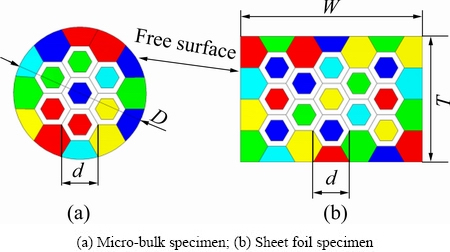
Fig. 6 Schematic illustration of free surface model
The flow stress of specimen with free surface is then represented by the weighted average of free surface grains and inner grains, which is expressed as follows:
��=�̦�Inner+(1-��)��Sur (7)
where �� is the geometry size factor representing the share of inner grains. For circular cross-section bulk specimen with diameter D, as shown in Fig. 6(a), �� is expressed as
 (8)
(8)
For rectangular cross-section sheet specimen with thickness T and width W, as shown in Fig. 6(b), �� is expressed as
 (9)
(9)
When geometry size factor �̡�0, the boundary condition of grains resembles that of the surface grains. Equation (7) can be simplified as ��=��Sur=��GI and the flow stress of material can be expressed as that of grain-interiors. When geometry size factor �̡�1, which means that free surface grains almost have no effect on the whole material behavior, Eq. (7) can be simplified as ��=��Inner=��S and the flow stress of material can be expressed as that of polycrystalline aggregate.
Substituting Eqs. (5) and (6) into Eq. (7), the flow stress of specimen with free surface is designated as follows:
 (10)
(10)
Therefore, the size-dependent model can be expressed as the size-independent term (��Ind) plus the size-dependent term (��Dep). In the formula, the size-independent term is expressed as polycrystalline aggregate and the size-dependent term is expressed as the missing grain-boundary strengthening effect of free surface.
4.3 Critical criterion
Size effects gradually disappear when the number of grains in micro-parts is large enough [26]. Distinguishing micro-forming and macro-forming is crucial in modeling the deformation behavior of micro-scale material. Based on the above analyses, the size-dependent term plays a vital role in the material deformation behavior. Therefore, a critical criterion is proposed to investigate the effect of the size-dependent term, quantitatively. The dependence factor �� is expressed as
 (11)
(11)
When dependence factor �� approaches the set threshold (5%), the corresponding number of grains in the characteristic direction is defined as the critical value Nc. The characteristic direction is a representative direction of specimen that can be the thickness for sheet, the diameter for cylinder bulk metal, and so on. When the number of grains N in the characteristic direction is less than Nc, the material deformation behavior can be regard as micro-forming. Both the size-independent term and the size-dependent term should be used in modeling of the material deformation behavior. On the contrary, the size-independent term is the main consideration when the number of grains N in the characteristic direction is more than Nc.
According to the above analyses, a detailed size-dependent model for forming can thus be obtained:
 (12)
(12)
4.4 Intragranular heterogeneity effect
Based on the experimental results, each grain owns unique deformation behavior and will dominate the properties of the whole material. Therefore, the deformation behavior of each grain must be considered in model building.
The grain-boundary layer is considered to response with high hardening rate. The rapid work-hardening grain-boundary layer is assumed to respond according to VOCE equation [27].
 (13)
(13)
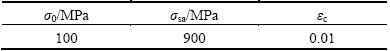
where ��0 represents the initial yield stress, ��sa represents the saturation stress, and ��c represents a characteristic strain.
For copper, the parameters in Eq. (13) for grain-boundary layer can be obtained from Ref. [13] and are shown in Table 2.
Table 2 Parameters for grain-boundary layer
The relationship among grain-boundary layer, composite grain-interiors and size-independent term is illustrated in Fig. 7. It can be concluded that the inhomogeneous material behavior is caused by the heterogeneity of composite grain-interiors, namely the different combinations of single grain-interiors. Therefore, the spread degree of the composite grain- interiors is the same as that of size-independent term.
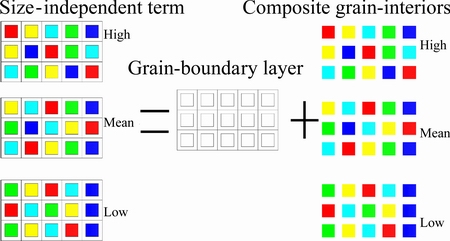
Fig. 7 Relationship among grain-boundary layer, composite grain-interiors and size-independent term
Equation (10) can be rewritten as
 (14)
(14)
For a given specimen, the geometry size and grain size are known. According to Eq. (14), if the flow stress of specimen is known, the flow stress of the composite grain-interiors can be calculated without considering the strengthening effect of grain-boundary layer.
Based on the assumption of CHAN et al [4], it can be concluded that the mean flow stress curves of single grain-interiors and composite grain-interiors are same. Besides, grains can be divided into seven classes according to the nano-indentation experiment results [28].
Following the fundamentals outlined above, the methodologies to estimate the heterogeneities of single grain-interiors are developed.
1) The upper bound and lower bound of single grain-interiors are calculated. As illustrated in Fig. 8(a), it is assumed that there are only three different composite grain-interiors properties (the mean, the upper bound, and the lower bound) calculated with Eq. (14). In addition, there are only three different single grain-interiors properties (the mean, the upper bound, and the lower bound) in the specimen. Two different single grain-interiors curves work together to produce one composite grain-interiors curve with equal contribution. Therefore, the spread degree of the single grain-interiors properties is 2-fold wider than that of the grain-interiors of composite.
2) The properties of single grain-interiors are divided into seven groups represented by their corresponding flow stress curves, which are evenly spaced within the upper bound and lower bound of flow stress of single grain-interiors, as shown in Fig. 8(b).
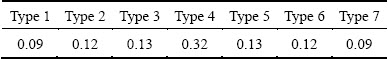
The distributions of the flow stress of different single grain-interiors are assumed to conform to the law of normal distribution. Based on the probability density function (PDF), the volume fraction for seven groups of single grain-interiors flow stress curves can be calculated and shown in Table 3.
Table 3 Volume fractions for seven groups of single grain-interiors
5 Verification and application
The micro-bulk specimens and the sheet foil specimens were employed to validate the developed size-dependent model.
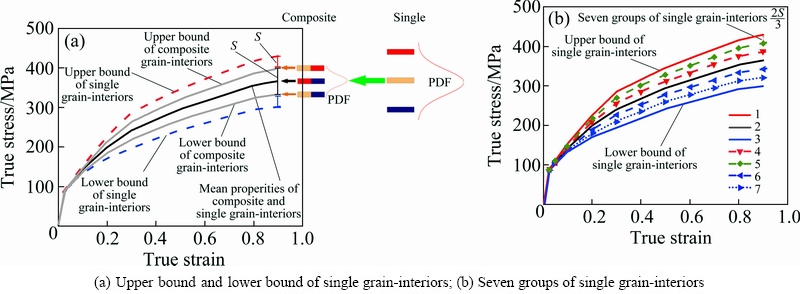
Fig. 8 Computational method of different groups of single grain-interiors (S is the stardard deviation)
5.1 Grain size effect in micro-bulk forming
The first case study was a micro-bulk upsetting experiment of copper conducted by CHAN et al [4]. The main geometry dimensions and process parameters are listed in Table 4.
The measured strain-stress curves and the variations of dependence factor �� are shown in Figs. 9(a) and (b), respectively. It can be illustrated that dependence factor �� decreases with the increase of grain number N (N=D/d) in the characteristic direction. The variations of critical value Nc with strains in characteristic directions are shown in Fig. 9(c). The results indicate that the critical value decreases with the increase of strain.
As illustrated in Fig. 9(c), both the numbers of grains N in the two cross-sections are less than Nc at all strains, so the material deformation behavior can be regarded as micro-forming. Grain size, geometry size, and the deformation behavior of each grain are considered to calculate the flow stress.
Applying the calculation procedure described in Section 4.4, seven groups of single grain-interiors properties are determined. Then, the methodologies to evaluate the material behavior of sample models are developed, as shown in Fig. 10.
1) The base material is configured with the method of distinguishing the mechanical property of each grain-interior. Seven groups of single grain-interiors are randomly assigned according to their volume fractions (Table 3).
2) Some regions having the same number of grains in characteristic direction with experimental specimen are extracted as sample models from the configured base material to estimate the flow stress of experimental specimen.
Table 4 Parameters for micro-bulk upsetting experiment
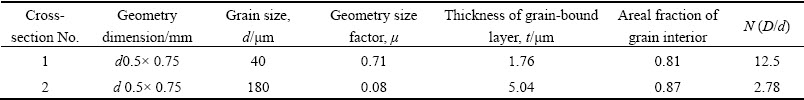
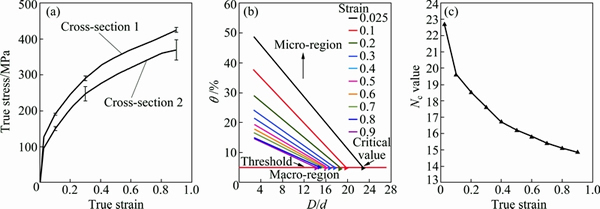
Fig. 9 True strain-stress curves from Ref. [4] (a), variation of dependence factor �� (b) and variation of critical value with strain (c)
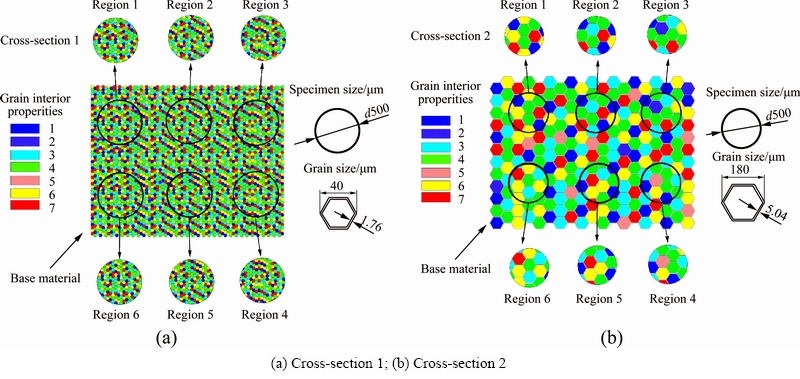
Fig. 10 Evaluation of material behavior of sample models for different cross-sections
3) The surface grains are regarded as grain-interiors in calculation.
The calculated results will be more approximate to experimental data when more regions are extracted, but in order to reduce computational complexity, only six regions are extracted as sample models from the base material in this study.
Figure 11 presents the comparison between the calculated results and the experimental ones, which shows that the calculated strain-stress curves distribute dispersedly. From cross-section 1 to cross-section 2, it can be observed that the scatter increases and the mean flow stress decreases with the increase of grain size. Moreover, the calculated results by the developed model match well with the experimental results.
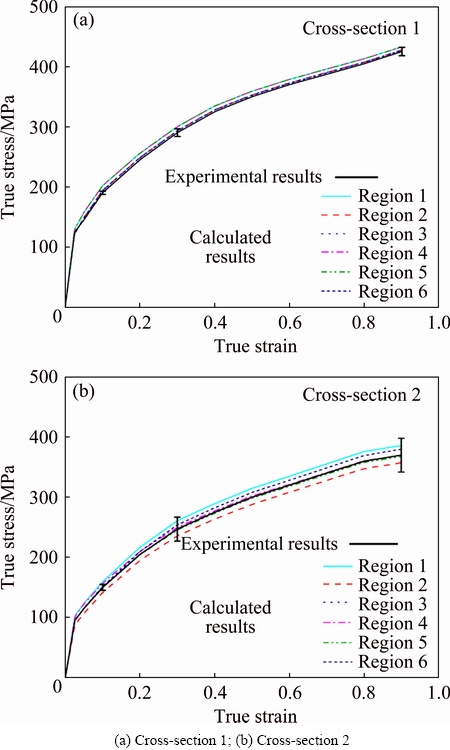
Fig. 11 Comparison of calculated and experimental results in micro-bulk forming
5.2 Geometry size effect in sheet foils forming
The second case study was the tensile experiment of sheet foils conducted in this work. Sheet foils with thickness values of 0.4 and 0.03 mm (A1 and A4 in Table 1) were selected to validate the developed model. The main geometry dimensions and process parameters are listed in Table 5.
Table 5 Parameters for sheet foils tensile experiment
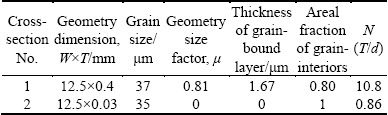
As shown in Table 5, the geometry size factor �� in cross-section 2 is 0. According to the definition of Eq. (7), the flow stress of the composite grain-interiors can be expressed as that of the experimental material. Based on the definition of Nc, the two cross-sections are regarded as micro-forming. According to the methodologies that estimate the heterogeneities of single grain-interiors in Section 4.4, seven groups of single grain-interiors are determined. Based on the methodologies to evaluate the material behavior of sample models in Section 5.1, six regions are extracted.
Figure 12 presents the comparison between the calculated results and the experimental ones, presenting that the calculated stress-strain curves distribute dispersedly and the mean flow stress decreases with the decrease of the geometry size. In addition, the predicted flow stress curves have a good agreement with the experimental results. The above comparison results show that the developed size-dependent model is effective in describing the material flow stress in micro-forming.
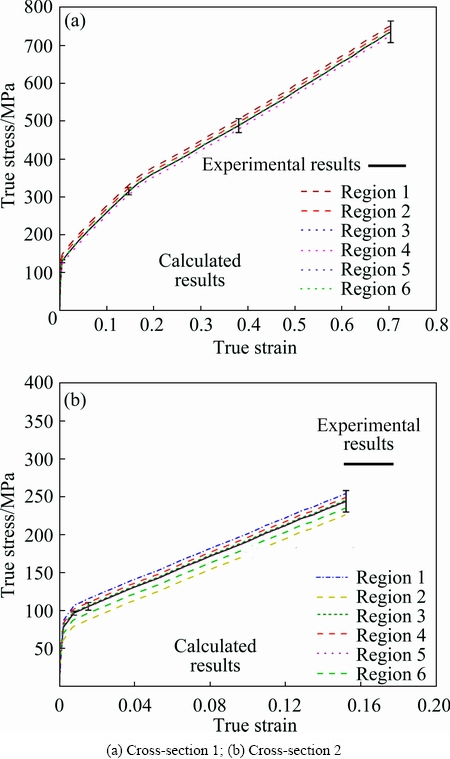
Fig. 12 Comparison of calculated and experimental results in sheet foils forming
6 Conclusions
1) The scatter of flow stress which shows an opposite trend with the value of flow stress decreases with the increase of T/d ratio. The elongation decreases with the decrease of T/d ratio.
2) Each grain owns unique deformation behavior and randomly distributes in the specimen. The specimen with less number of grains would be more likely to form an easy deformation zone and produce the concentration of plastic deformation.
3) The inhomogeneous material behavior in micro-forming is caused by different combinations of single grain-interiors.
4) A size-dependent model considering the effects of grain size, geometry size, and the deformation behavior of each grain has been developed.
5) New methodologies are proposed to estimate the heterogeneities of single grain-interiors and the material behavior of sample models.
6) As a further extension of this research endeavor, a size-dependent model with consideration of the grain shape in micro-forming will be carried out in the next work.
Acknowledgment
The author would like to thank Xin GUAN for helpful discussion.
References
[1] VOLLERTSEN F, HU Z, NIEHOFF H S, THEILER C. State of the art in micro forming and investigations into micro deep drawing [J]. Journal of Materials Processing Technology, 2004, 151: 70-79.
[2] ENGEL U, ECKSTEIN R. Microforming��From basic research to its realization [J]. Journal of Materials Processing Technology, 2002, 125: 35-44.
[3] KALS T A, ECKSTEIN R. Miniaturization in sheet metal working [J]. Journal of Materials Processing Technology, 2000, 103: 95-101.
[4] CHAN W L, FU M W, LU J, LIU J G. Modeling of grain size effect on micro deformation behavior in micro-forming of pure copper [J]. Materials Science and Engineering A, 2010, 527: 6638-6648.
[5] WANG C J, SHAN D B, ZHOU J, GUO B , SUN L N. Size effects of the cavity dimension on the microforming ability during coining process [J]. Journal of Materials Processing Technology, 2007, 187: 256-259.
[6] EICHENHUELLER B, EGERER E, ENGEL U. Microforming at elevated temperature-forming and material behaviour [J]. The International Journal of Advanced Manufacturing Technology, 2007, 33: 119-124.
[7] XU J, GUO B, WANG C, SHAN D. Blanking clearance and grain size effects on micro deformation behavior and fracture in micro-blanking of brass foil [J]. International Journal of Machine Tools and Manufacture, 2012, 60: 27-34.
[8] XU J, GUO B, SHAN D. Size effects in micro blanking of metal foil with miniaturization [J]. The International Journal of Advanced Manufacturing Technology, 2011, 56: 515-522.
[9] GEIGER M, MESSNER A, ENGEL U. Production of microparts��Size effects in bulk metal forming, similarity theory [J]. Production Engineering, 1997, 4: 55-58.
[10] CHAN W L, FU M W, YANG B. Study of size effect in micro-extrusion process of pure copper [J]. Materials & Design, 2011, 32: 3772-3782.
[11] LIU J G, FU M W, LU J, CHAN W L. Influence of size effect on the springback of sheet metal foils in micro-bending [J]. Computational Materials Science, 2011, 50: 2604-2614.
[12] LAI X, PENG L, HU P, LAN S, NI J. Material behavior modelling in micro/meso-scale forming process with considering size/scale effects [J]. Computational Materials Science, 2008, 43: 1003-1009.
[13] FU H H, BENSON D J, MEYERS M A. Analytical and computational description of effect of grain size on yield stress of metals [J]. Acta Materialia, 2001, 49: 2567-2582.
[14] LIU J G, FU M W, CHAN W L. A constitutive model for modeling of the deformation behavior in microforming with a consideration of grain boundary strengthening [J]. Computational Materials Science, 2012, 55: 85-94.
[15] WANG C J, GUO B, SHAN D B. Polycrystalline model for FE-simulation of micro forming processes [J]. Transactions of Nonferrous Metals Society of China, 2011, 21: 1362-1366.
[16] YU S, YU H P, RUAN X Y. Discussion and prediction on decreasing flow stress scale effect [J]. Transactions of Nonferrous Metals Society of China, 2006, 16: 132-136.
[17] CHENG L, WANG C, WANG C, GUO B, WANG Z L. Size effects on plastic deformation behavior in micro radial compression of pure copper [J]. Transactions of Nonferrous Metals Society of China, 2013, 23: 2686-2691.
[18] MIYAZAKI S, SHIBATA K, FUJITA H. Effect of specimen thickness on mechanical properties of polycrystalline aggregates with various grain sizes [J]. Acta Metallurgica, 1979, 27: 855-862.
[19] HALL E O. The deformation and ageing of mild steel: II. Characteristics of the l��ders deformation [J]. Proceedings of the Physical Society, 1951, 64: 742.
[20] MFCKING H. Deformation of polycrystals [J]. Strength of Metals & Alloys, 1979, 42: 1573-1594.
[21] FU M W, CHAN W L. Micro-scaled products development via microforming [M]. London: Springer-Verlag, 2014.
[22] MA Z, TONG G Q, CHEN F, WANG Q, WANG S. Grain size effect on springback behavior in bending of Ti-2.5Al-1.5 Mn foils [J]. Journal of Materials Processing Technology, 2015, 224: 11-17.
[23] ZHANG P, BALINT D, LIN J. An integrated scheme for crystal plasticity analysis: Virtual grain structure generation [J]. Computational Materials Science, 2011, 50: 2854-2864.
[24] XU J, GUO B, SHAN D, LI M, WANG Z. Specimen dimension and grain size effects on deformation behavior in micro tensile of SUS304 stainless steel foil [J]. Materials Transactions, 2013, 54: 984-989.
[25] ENGEL U, MEBNER A, GEIGER M. Advanced concept for the FE-simulation of metal forming processes for the production of microparts [C]//Proceedings of the Fifth International Conference on the Technology of Plasticity. Ohio, 1996: 903-906.
[26] LEU D K. Modeling of size effect on tensile flow stress of sheet metal in microforming [J]. Journal of Manufacturing Science and Engineering, 2009, 131: 123-136.
[27] VOCE E. A practical strain-hardening function [J]. Metallurgia, 1955, 51: 219-226.
[28] LU H N, WEI D B, JIANG Z Y, LIU X H, MANABE K. Modelling of size effects in microforming process with consideration of grained heterogeneity [J]. Computational Materials Science, 2013, 77: 44-52.
�����䣬ͯ��Ȩ���� ��
�Ͼ����պ����ѧ ���繤��ѧԺ���Ͼ� 210016
ժ Ҫ������ʵ�����ֵ��ģ����̽�������в��ϱ�����Ϊ�;���������Ϊ�Ĺ�ϵ������ʵ��������������Ӧ������ɢ�����Ⱦ����ߴ��(T/d)�ļ�С��������������Ӧ���ı仯�����෴����Ӳ�Ȳ��Խ��������ÿ��������������صı�����Ϊ������ֲ��������С�����������Խ�ٵ�����Խ�����γ��ױ������ͷ������μ��������������һ��ͬʱ���Ǿ����ߴ硢���γߴ���徧��������Ϊ�ijߴ�����ģ�ͣ���ͨ���Ա�ʵ��֤ʵ�˸�ģ�͵���Ч�Ժ�ʵ���ԡ�
�ؼ��ʣ����Σ�������Ϊ���ߴ�ЧӦ��ģ�ͣ�����������
(Edited by Wei-ping CHEN)
Corresponding author: Guo-quan TONG; Tel:+86-25-84891881; E-mail: meegqtong@nuaa.edu.cn
DOI: 10.1016/S1003-6326(17)60069-4

