System reliability analysis of seismic pseudo-static stability of rock wedge based on nonlinear Barton–Bandis criterion
来源期刊:中南大学学报(英文版)2020年第11期
论文作者:李得建 赵炼恒 焦康甫 左仕
文章页码:3450 - 3463
Key words:3D rock wedge; seismic pseudo-static stability; nonlinear Barton–Bandis failure criterion; system reliability; sensitivity analysis; stability probability curves
Abstract: Based on the nonlinear Barton–Bandis (B–B) failure criterion, this study considers the system reliability of rock wedge stability under the pseudo-static seismic load. The failure probability (Pf) of the system is calculated based on the Monte-Carlo method when considering parameter correlation and variability. Parameter analysis and sensitivity analysis are carried out to explore the influence of parameters on reliability. The relationships among the failure probability, safety factor (Fs), and variation coefficient are explored, and then stability probability curves of the rock wedge under the pseudo-static seismic load are drawn. The results show that the parameter correlation of the B–B failure criterion has a significant influence on the failure probability, but correlation increases system reliability or decreases system reliability affected by other parameters. Under the pseudo-static seismic action, sliding on both planes is the main failure mode of wedge system. In addition, the parameters with relatively high sensitivity are two angles related to the joint dip. When the coefficient of variation is consistent, the probability of system failure is a function of the safety factor.
Cite this article as: ZHAO Lian-heng, JIAO Kang-fu, LI De-jian, ZUO Shi. System reliability analysis of seismic pseudo-static stability of rock wedge based on nonlinear Barton–Bandis criterion [J]. Journal of Central South University, 2020, 27(11): 3450-3463. DOI: https://doi.org/10.1007/s11771-020-4558-9.

J. Cent. South Univ. (2020) 27: 3450-3463
DOI: https://doi.org/10.1007/s11771-020-4558-9

ZHAO Lian-heng(赵炼恒)1, 2, JIAO Kang-fu(焦康甫)1, LI De-jian(李得建)3, ZUO Shi(左仕)1
1. School of Civil Engineering, Central South University, Changsha 410075, China;
2. Key Laboratory of Heavy-Haul Railway Engineering Structure (Ministry of Education),Central South University, Changsha 410075, China;
3. School of Civil Engineering, Southwest Jiaotong University, Chengdu 610031, China
 Central South University Press and Springer-Verlag GmbH Germany, part of Springer Nature 2020
Abstract: Based on the nonlinear Barton–Bandis (B–B) failure criterion, this study considers the system reliability of rock wedge stability under the pseudo-static seismic load. The failure probability (Pf) of the system is calculated based on the Monte-Carlo method when considering parameter correlation and variability. Parameter analysis and sensitivity analysis are carried out to explore the influence of parameters on reliability. The relationships among the failure probability, safety factor (Fs), and variation coefficient are explored, and then stability probability curves of the rock wedge under the pseudo-static seismic load are drawn. The results show that the parameter correlation of the B–B failure criterion has a significant influence on the failure probability, but correlation increases system reliability or decreases system reliability affected by other parameters. Under the pseudo-static seismic action, sliding on both planes is the main failure mode of wedge system. In addition, the parameters with relatively high sensitivity are two angles related to the joint dip. When the coefficient of variation is consistent, the probability of system failure is a function of the safety factor.
Key words: 3D rock wedge; seismic pseudo-static stability; nonlinear Barton–Bandis failure criterion; system reliability; sensitivity analysis; stability probability curves
Cite this article as: ZHAO Lian-heng, JIAO Kang-fu, LI De-jian, ZUO Shi. System reliability analysis of seismic pseudo-static stability of rock wedge based on nonlinear Barton–Bandis criterion [J]. Journal of Central South University, 2020, 27(11): 3450-3463. DOI: https://doi.org/10.1007/s11771-020-4558-9.
1 Introduction
The stability of jointed rock slopes has always been an important and difficult concern in the field of rock mechanics. Slope instability accidents caused by joint are common in engineering. However, the complexity of the structure, the uncertainty of the physical, and mechanical characteristics result in a large number of uncertainties in the process of analyzing the stability of the slope [1-4]. These also cause great difficulties when studying the stability of jointed rock slopes.
The traditional stability analysis method uses a safety factor (or stability factor) to evaluate slope stability [5-8], but it is difficult to consider the variability in geotechnical engineering. Based on the first-order reliability calculation method, LOW [9, 10] conducted reliability analyses on a two-dimensional (2D) rock slope and three-dimensional (3D) wedge slope in Hong Kong, China. The effects of parametric correlations on the required reinforcing force for a target reliability index value were studied. HUANG and ZHOU estimated the probability of failure (Pf) of slope based on Chebyshev inequalities [11] and second-order orthogonal experimental design (SOED)-based response surface method (RSM) [12].
LI et al [13] analyzed the reliability of related non-normal random variables based on the stochastic response surface method. This method extended the application of the stochastic response surface method in reliability problems. Moreover, the validity and feasibility of this method were verified by conducting a reliability analysis of a 2D rock slope as an example. A large number of studies have been carried out based on the linear Mohr-Coulomb (M-C) failure criterion, considering 2D [10, 13, 14] and 3D rock slopes [15-18], to analyze the reliability of groundwater with respect to its stability.
Many scholars have carried out significant researches on the stability of a jointed rock slope, but most studies [19-22] only considered the static stability of the slope. In addition, fewer studies have been conducted on the stability of a 3D rock wedge slope when considering seismic effect. In addition, many studies [23, 24] only considered the horizontal seismic effect, and ignored the vertical seismic effect. Importantly, the existing study [25] showed that the effects of vertical seismic forces cannot be ignored, especially in the case of large horizontal seismic influence coefficients [26, 27]. Meanwhile, the shear behaviour of a rock mass structure plane does not always meet the linear M-C criterion. Thus, additional researchers have carried out stability analyses of a rock slope based on nonlinear failure criterion [28-32]. In the case of jointed rock slopes, the Barton–Bandis (B–B) empirical criterion for rock joint shear strength proposed by BARTON is the most commonly used [33]. Therefore, many studies [16, 34] have discussed common methods for transforming the parameters of the B–B failure criterion into the shear strength parameters of the linear M-C criterion. Through combining the B–B criterion with reliability theory, the effect of anchor and seismic action on the stability of a plane sliding rock slope was analyzed [35].
This study aims to explore the system reliability of rock wedge stability under seismic forces. Based on the B–B failure criterion, the expression of Fs is derived for the wedge slope under horizontal and vertical seismic pseudo-static forces, and the Monte-Carlo method is used to calculate the reliability of the system. The accuracy and applicability of the proposed method is verified by comparing the calculation results with those of SWEDGE numerical calculation software. The research results can provide new ideas for the reliability analysis of slopes, and provide a reference for parameter selection in slope engineering.
2 Rock slope failure model based on nonlinear Barton–Bandis criterion
2.1 Nonlinear Barton-Bandis criterion
Studies [28, 36, 37] summarized the direct shear characteristics and experimental results of rock joints, and proposed the B–B model. The shear strength of a rough rock surface depends on the relationship between the roughness, the rock strength and the normal stress, and can be defined by the following empirical equation:
 (1)
(1)
where τ is the shear strength of the rough rock surface; σn is the effective normal stress; JRC is the joint roughness coefficient; JCS is the compressive strength of the rock at the fracture surface; φb is the friction of the rock material. The parameters JRC, JCS and φb can be determined as suggested in the existing literatures [38-43] in actual engineering practice.
2.2 Seismic pseudo-static analysis
In the analysis of a 2D situation when considering the complexity of seismic action, the pseudo-static method is often used to analyze the dynamic stability of the rock-soil structure, owing to its simple calculation [40-42]. For the seismic force, the horizontal seismic influence coefficient is kh, the vertical seismic influence coefficient is kv and usually kv is expressed as a function of kh:
 (2)
(2)
In Eq. (2), ζ is the vertical earthquake influence proportional coefficient, in which the force direction is upwards when a positive value is taken. The force direction is downwards when a negative value is taken. In the analysis of the stability of a 3D sliding rock slope, an analytical model should be established. In this study, referring to the 2D pseudo-static analysis method, a 3D rock wedge stress diagram is constructed, as shown in Figure 1.
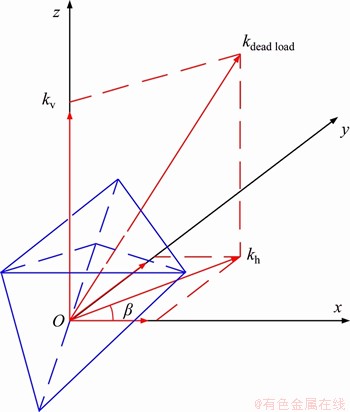
Figure 1 Force diagram of rock wedge
kdead load is the total introduced seismic pseudo-static coefficient, and β is the angle between kh and the positive direction of the x-axis (counterclockwise is positive). The seismic effect is characterized by applying a pseudo-static force to each of the three coordinate axes established by the analysis model. Then, through superimposing the seismic pseudo-static force on the gravity of the rock mass itself, a 3D rock wedge analysis model under the action of the pseudo-static force can be constructed. The force exerted on the rock wedge is expressed as a space force vector (t1, t2, and t3). Terms t1, t2, and t3 represent the forces of the rock wedge in the three directions of x, y and z, respectively, and the following equation is established, where W represents the gravity of the wedge.
 (3)
(3)
2.3 Wedge failure mechanism
GOODMAN [43] and WITTKE [44] discussed the possible failure modes of a 3D wedge. LI et al [16] and JOHARI et al [17] discussed the possible failure modes of 3D wedges under fissure water pressure, and analyzed the system reliability of wedges based on the M-C criterion. There are four possible failure modes of a wedge under the action of a seismic pseudo-static force: Case 1 (sliding along Plane 1 only), Case 2 (sliding along Plane 2 only), Case 3 (contact is lost on both planes), and Case 4 (separated from both planes). Assuming that all forces pass through the center of gravity of the wedge, no torque is generated, and no rotational slip or tipping occurs.
In this study, the analysis model shown in Figure 2 is used to carry out the research. In Figure 2, H is the height of the wedge; h is the height of the front slope; θ1 and θ2 are the two bottom angles of the triangle BCD in the horizontal plane; δ1 and δ2 denote the dips of the discontinuity planes 1 and 2, respectively; α is the front slope inclination angle; ε is the inclination angle of the plane where the two joints intersect; and Ω is the inclination of the upper slope surface.
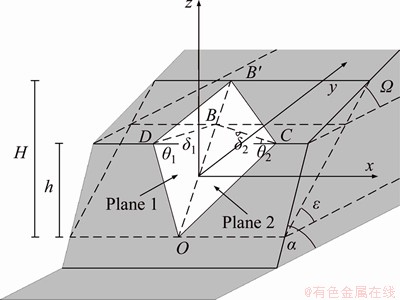
Figure 2 Stability analysis model of rock wedge
2.4 Failure mode and stability analysis
For the analytical model, only a static equilibrium condition between an anti-sliding effect and a slip-induced effect is considered in the calculation of the anti-sliding stability of the rock slope [44-46]. The expression of Fs is as follows:
 (4)
(4)
where Fresist is the total anti-sliding force, and Finduce is the sliding force.
Case 1: Sliding along Plane 1 only
According to the approximate force equation of a wedge proposed by LOW and EINSTEIN [47], the expression of Fs can be obtained based on the B–B criterion. The expression is a function of multiple parameters, such as the joint plane direction, wedge height, friction angle, JRC, JCS and seismic pseudo-static force coefficient.
When the condition expressed in Eq. (6) holds, the wedge will slide down along the joint of Plane 1, and Fs is solved according to Eq. (5) as follows (calculation details of each intermediate variable are listed in the appendix):
 (5)
(5)
 (6)
(6)
Case 2: Sliding along Plane 2 only
When Eq. (7) holds, the wedge will slide along Plane 2.
 (7)
(7)
The expression of Fs in this case is:
 (8)
(8)
Case 3: Contact is lost on both planes
The Fs of the biplane sliding of a wedge is expressed in Eq. (9), and is valid when Eq. (10) holds.

 (9)
(9)
 (10)
(10)
Case 4: Separating from both planes
When the condition of Eq. (11) holds, the wedge will separate from the slope and shift in space.
 (11)
(11)
It can be seen from the above analyses that the stability of the wedge is mainly affected by the basic geometric parameters, rock mechanics parameters, and seismic pseudo-static parameters of the wedge. In this study, relevant parameters are selected by referring to parameter value ranges given in the literatures [46-48], to analyze the influence of these parameters on the stability of the wedge.
3 Reliability analysis
3.1 System structure
The analysis shows that there are four failure modes of the wedge, and any failure mode will result in the instability of the wedge. Therefore, in the reliability analysis, each failure mode is regarded as a series relationship to constitute the whole system. Each failure mode (subsystem) is composed of its own conditions [13, 49, 50], which can be regarded as a parallel subsystem. Through superimposing the failure probabilities of the various subsystems to obtain the system failure probability, the calculation can be simplified [49, 50]. Figure 3 presents the structural system diagram of the wedge system reliability analysis, and the limit state equation of each subsystem, and its corresponding physical significance are listed in Table 1.

Figure 3 Structure diagram of wedge system
3.2 System reliability calculation
For a system, Pf of the system is related to not only the failure probability of individual subsystems, but also the interrelationship of these subsystems. Table 2 summarizes the probability calculation formulas of series and parallel systems in different situations.
Table 1 Physical interpretation of limit state functions for system reliability of wedge

The Monte-Carlo method avoids complex mathematical formulas in reliability analysis, and is simple to use. The accuracy of the results can be guaranteed by a sufficient number of simulations, and the correlation between the variables can be considered [51]. Therefore, the Monte-Carlo simulation method is used to solve the failure probability. The calculation steps are as follows:
1) Analyze all possible failure modes of the system.
2) Generate random numbers of random variables with known distributions by a computer, and use these random numbers to solve Fs. Count the frequency ni and failure (Fs less than 1) of each subsystem.
3) Calculate the relative probability Pi of each subsystem and the failure probability Pf,i:
 (12)
(12)
 (13)
(13)
4) Calculate the failure probability of the system Pf-sys. This study analyzes each failure mode as a mutually exclusive event, so the system failure probability is the sum of the failure superposition of each subsystem.
 (14)
(14)
4 Verification
To verify the correctness of the calculation method (Method 1), the theoretical calculation results are compared with those from SWEDGE software. The calculation model is presented in Figure 2. The values of the variables are shown in Table 3, where μ is the mean of the variables, and σ is the standard deviation. Figure 4 shows a comparison of the results of Method 1 and SWEDGE (Note: βOB' is the intersection line OB'projected at an angle in the horizontal plane and points out of the slope).
Table 2 Reliability calculation formula for series system and parallel system
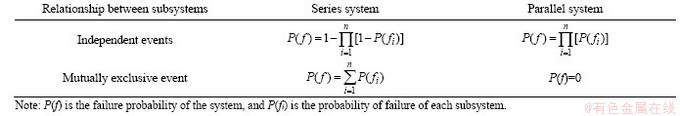
Table 3 Variable distribution type
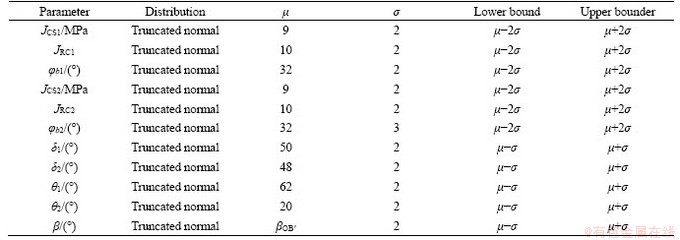
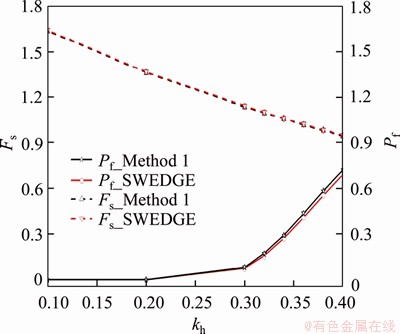
Figure 4 Comparison of calculation results of different methods
In order to obtain more accurate calculation results, the number of samples was increased during calculation (Method 1: 20000 samples; SWEDGE: 10000 samples). It can be seen from Figure 4 that Fs and failure probability calculated by Method 1 are very close to those of the SWEDGE calculation result. Moreover, it can be seen from the figure that due to the large number of Method 1 calculation samples, the calculated failure probability is larger, and the calculation result is more conservative.
With the calculation formulas of safety factors in four different instability modes having been derived, Method 1 can evaluate the reliability of each instability mode compared to SWEDGE, and Method 1 can also analyze the most unfavorable load position of the wedge.
5 Parameter analysis
Studies [10, 13] have shown that there is a negative correlation between the friction angle (φ) and the cohesion (c) in the linear M-C criterion. The reliability of a computing system that does not consider the correlation of parameters is lower than in reality. At present, few studies have analyzed the influence of correlation of nonlinear B–B criterion parameters on system reliability. Therefore, this section explores the effects of parameter correlation on system reliability under different kh. The setting form of the correlation coefficient matrix is shown in Eq. (15).
 (15)
(15)
where ρij represents the correlation of the parameters of row i, column j, and i, j∈{1, 2, 3, 4, 5, 6}. For example, ρ21 denotes the correlation coefficient between the parameter in the second row (JCS1) and the parameter in the first column (JRC1). When drawing, it is considered that the correlation coefficient between the three parameters is the same: φb, JRC, JCS (ρφb,JRC=ρφb,JCS=ρJRC,JCS).
Figures 5(a)-(c) show that the variation of system failure probability and the relative error with the correlation coefficient caused by different kh. Figure 5(d) shows the absolute error caused by considering parameter correlation under three different values of kh. The following important conclusions can be observed in Figure 5:
1) In the case of the correlation matrix values, parameter correlation has an impact on the reliability calculation results. Moreover, the relative and absolute errors caused by the parameter correlation on the calculation result increase with an increase in the correlation coefficient.
2) The effect of parameter correlation on the increase or decrease of failure probability is uncertain, and is affected by the value of other parameters. For example, when kh=0.3 and 0.35, consideration of parameter correlation increases the failure probability of the system. However, when kh=0.4, consideration of parameter correlation reduces the failure probability.
Based on the above conclusions, the correlation between the parameters is not considered in the subsequent analysis of the content, and the parameters are considered to be independent of each other.
To analyze the influence of the parameters on the stability of a rock slope, the basic parameters listed in Table 3 were used to determine the failure probability. In the process of parameter analysis, only the mean value and the upper and lower bounds of the analyzed parameters are changed. The results are shown in Figure 6.

Figure 5 Influence of correlation coefficient on system failure probability and error:
1) Figures 6(a)-(c) show that the probability of system failure increases with an increase in h and α. The mechanical parameters of the rock have a significant influence on the failure probability of the system. In addition, an increase in JRC, JCS and φb will reduce the failure probability of the system.
2) Figure 6(d) shows that the probability of system failure increases with an increase in ξ. For example, when h is 20 m, the probability of system failure is 0.42 for ξ=0, but 0.97 for ξ=1. ZHAO et al [52] concluded that “ignoring the vertical acceleration can lead to an overestimation of the slope stability” agrees with the results obtained in this paper.
3) Figure 6(e) shows that the failure probability of each failure mode varies with β. As the value increases from 0° to 360°, the failure probability curve of the system presents a waveform change trend, and the range of the value is large. This indicates that the direction of the seismic pseudo-static force has a significant influence on the failure probability of the system. Meanwhile, when the failure probability of the Case 3 failure mode contributes the most to the system, it corresponds to the the most unstable state of the system.
4) Figure 6(f) shows that when the pseudo- static coefficient of the earthquake is small, the failure of the wedge in the Case 3 mode is the main failure mode. As kh increases, the probability of the wedge failure in Case 3 decreases, but the probability of the wedge failure in Cases 1 and 2 increases. However, the probability of occurrence of Case 4 is always zero.
6 Sensitivity analysis
Under the action of seismic force, the reliability of the wedge system is affected by multiple factors, including the mechanical parameters of the rock mass, geometric parameters of the wedge, and seismic pseudo-static factors. Moreover, the mechanical parameters of rock have the problem of large dispersion, so the mechanical parameters measured in tests sometimes have serious distortion and poor reliability when applied to engineering practice. Therefore, a sensitivity analysis of parameters can distinguish the major and minor factors affecting the stability. Such a sensitivity analysis could be useful in cost analysis and design planning. For example, if the sensitivity of a variable is low, there is little need to be very accurate about the determination of this variable [16].
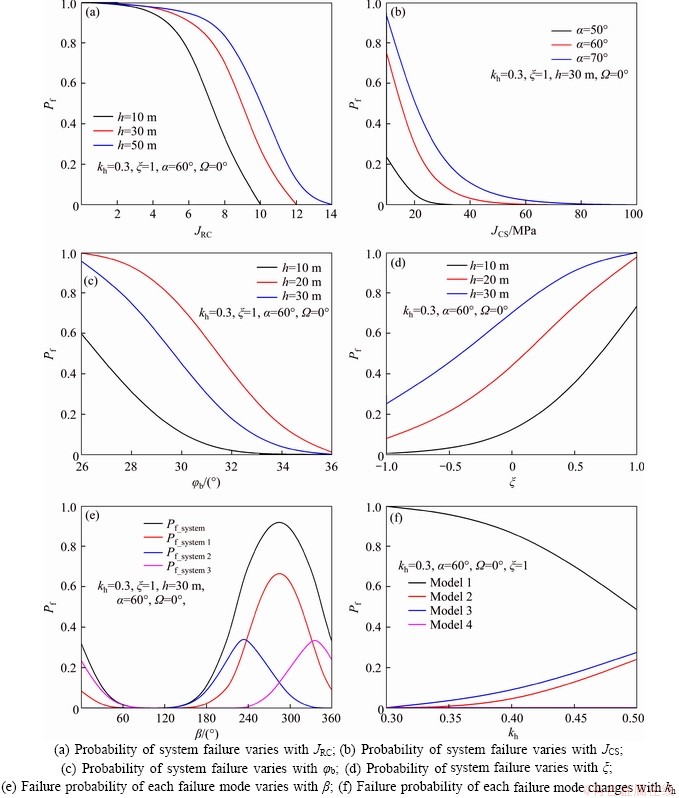
Figure 6 Variation of failure probability with different parameters:
The dimensionality of the factors affecting the stability is different; hence, it is impossible to compare the sensitivity of the factors. Based on single-factor sensitivity analysis, ZHANG et al [53], and LI et al [16] defined a dimensionless form of sensitivity coefficient α* for sensitivity comparison. The sensitivity coefficient α* represents the sensitivity of the reliability results calculated at design point X* to the variation of random variables [16]. A positive sign is often used when the corresponding basic variable is a load variable, while a negative sign is often used when it is a resistance variable [54]. The calculation results are shown in Figure 7.
Figure 7 presents the sensitivity coefficients of random variables for rock slope and the case for kh=0.3, h=20 m. In Figure 7, the parameters with relatively high sensitivity are δ1, δ2, φ1 and φ2, while JCS is always less sensitive. This indicates that changes in δ1, δ2, φ1 and φ2 have a significant influence on the reliability for wedge, while changes in JCS appear to be the least significant factor.
Based on these results, it can be seen that the changes in the rock joint dip and friction angle have a significant influence on the computed reliability. Accordingly, the determination of rock joint dip and friction angle with sufficient accuracy is of paramount importance for an adequate assessment of wedge stability.
7 Stability probability curves
The computational parameters required for the analysis of geotechnical engineering problems are obtained through sampling experiments. Usually, the parameters obtained through experiments are discrete, and this discreteness can be described by a coefficient of variation [55]. The discretization of calculated parameters results in the discretization of calculated results, and the degree of discretization of the calculated results is usually proportional to the degree of discretization of the calculated parameters. In the reliability calculation of a soil slope, DUNCAN et al [55] put forward a table for determining the Pf of the slope by the FMLV (i.e., the most likely value of factor of safety) and the coefficient of variation of the FMLV (COVFS). JOHARI et al [17] proposed probability curves to determine the probability of failure in rock wedge slopes of different heights. In this study, the reliability is calculated based on the Monte-Carlo method. The discrete degree of the parameters is controlled by adjusting the mean value (μ), standard deviation (σ), and the value range (lower bound, upper bound) of the parameters, to obtain results with different coefficients of variation. Moreover, the stability probability curves are drawn to explore the relationship between the failure probability of the wedge and the Fs, and the COVFS under the pseudo-static force of the earthquake (Note: β = βOB′ is maintained in the calculation process). For this purpose, the following procedures were followed:
1) Random shape parameters and seismic pseudo-static parameters are set (h, α, δ1, δ2, θ1, θ2, kh, ξ);
2) Random data are generated by changing the mean, standard deviation, and upper and lower limits of JRC, JCS, and φb;
3) Fs is calculated by Eqs. (1)-(11), and the standard deviation (σFs), mean (μFs), and coefficient of variation (COVFs=σFs/μFs) of the calculated results are counted;
4) The above steps 1, 2, and 3 are repeated.
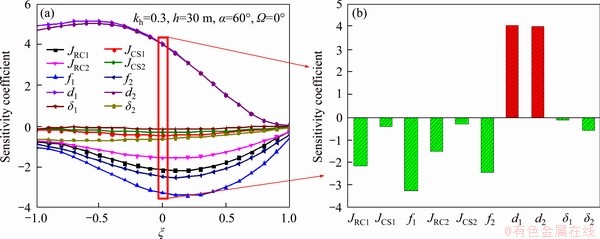
Figure 7 Variation of sensitivity factors with different ξ
Finally, probabilistic rock wedge stability curves are developed using the MATLAB curve fitting toolbox, for each group of COVFs.
Through the sorting of a large number of calculated data, the stability probability curves of rock wedges with kh values of 0.1, 0.2, and 0.3 are finally drawn. The results are shown in Figure 8.
An important advantage of failure probability is that it can judge the possibility of an acceptable risk level according to the potential failure cost. However, there is no universally applicable standard for failure probability at present [55]. The failure probability of an important advantage of failure probability is that it can judge the possibility of an acceptable risk level according to the potential failure cost. However, there is no universally applicable standard for failure probability at present [55]. According to the stability probability curve shown in Figure 8, the failure probability of a wedge under a seismic load can be uniquely determined by Fs and the corresponding variation coefficient. Thus, it can provide a reference for engineering design.
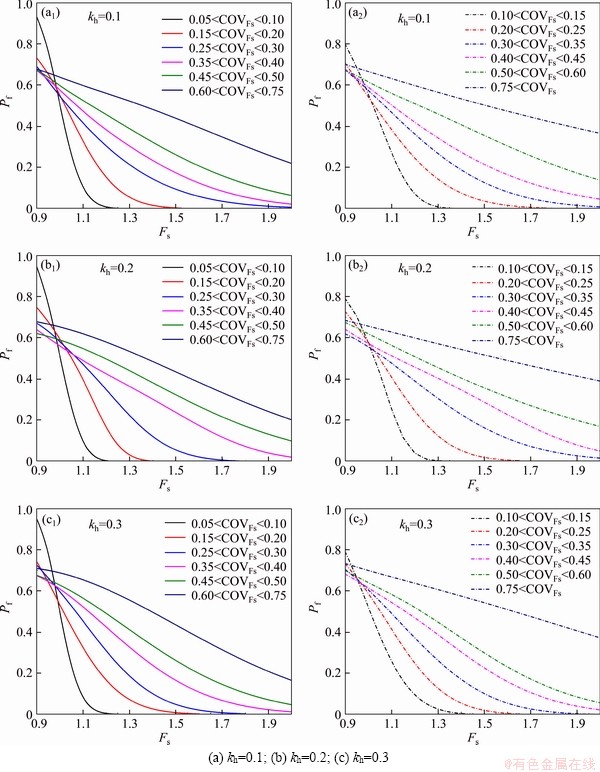
Figure 8 Probabilistic rock wedge stability curves:
8 Conclusions
In this study, the reliability of a 3D wedge system under an earthquake pseudo-static force is studied based on the nonlinear B–B failure criterion. The reliability is calculated based on the Monte- Carlo method. The correctness of the method is verified by comparison with the calculation results of SWEDGE calculation software. Subsequently, the parameter analysis is carried out, and the following conclusions are obtained:
1) In the case of the values of the correlation matrix, the reliability calculation result is considerably affected by the parameter correlation. The relative error and absolute error caused by the calculation result increase with the increase in the correlation coefficient.
2) The direction of the pseudo-static force has a significant influence on the failure probability of the wedge system. As the value of μβ ranges from 0° to 360°, the system failure probability first decreases and then increases, and the value varies considerably. The failure probability of the failure mode sliding on both planes (Case 3) contributes the most to the system failure probability, while the other three failure modes contribute relatively less to the system failure probability.
3) The sensitivity coefficient of each parameter is in a fluctuating state with the change of the ξ (kv=ξkh). The parameters with higher relative sensitivity are the angle parameters δ1 and δ2, related to the dip of the joint surface. Moreover, JCS is always less responsive.
4) The reliability of the system is affected by the safety factor and its coefficient of variation. When the coefficient of variation is consistent, the probability of system failure is a function of the safety factor.
Appendix
 (A1)
(A1)
 (A2)
(A2)


 (A3)
(A3)
 (A4)
(A4)
 (A5)
(A5)
 (A6)
(A6)
 (A7)
(A7)

 (A8)
(A8)
 (A9)
(A9)
 (A10)
(A10)
 (A11)
(A11)
Contributors
ZHAO Lian-heng provided the concept and supplied financial support for the whole study. JIAO Kang-fu edited the draft of manuscript and completed the experiment. LI De-jian provided directional guidance. ZUO Shi edited the pictures and examined the manuscript.
Conflict of interest
ZHAO Lian-heng, JIAO Kang-fu, LI De-jian and ZUO Shi declare that they have no conflict of interest.
References
[1] GRAVANIS E, PANTELIDIS L, GRIFFITHS D V. An analytical solution in probabilistic rock slope stability assessment based on random fields [J]. International Journal of Rock Mechanics and Mining Sciences, 2014, 71: 19-24. DOI: 10.1016/j.ijrmms.2014.06.018.
[2] ZHANG Jia-hua, ZHANG Biao. Reliability analysis for seismic stability of tunnel faces in soft rock masses based on a 3D stochastic collapse model [J]. Journal of Central South University, 2019, 26(7): 1706-1718. DOI: 10.1007/s11771- 019-4127-2.
[3] PARK H, WEST T R. Development of a probabilistic approach for rock wedge failure [J]. Engineering Geology, 2001, 59(3): 233-251. DOI: 10.1016/S0013-7952(00)000 76-4.
[4] LI D Q, JIANG S H, CHEN Y F, ZHOU C B. System reliability analysis of rock slope stability involving correlated failure modes [J]. KSCE Journal of Civil Engineering, 2011, 15(8): 1349-1359. DOI: 10.1007/ s12205- 011-1250-5.
[5] CHENG H, ZHOU X. A novel displacement-based rigorous limit equilibrium method for three-dimensional landslide stability analysis [J]. Canadian Geotechnical Journal, 2015, 52(12): 2055-2066. DOI: 10.1139/cgj-2015-0050.
[6] FANG Hong-wei, CHEN Y, DENG Xiao-wei. A new slope optimization design based on limit curve method [J]. Journal of Central South University, 2019, 26(7): 1856-1862. DOI: 10.1007/ s11771-019-4139-y.
[7] ZHOU X P, CHENG H. The long-term stability analysis of 3D creeping slopes using the displacement-based rigorous limit equilibrium method [J]. Engineering Geology, 2015, 195: 292-300. DOI: 10.1016/j.enggeo.2015.06.002.
[8] ZHAO Lian-heng, CHENG Xiao, LI De-jian, ZHANG Ying-bin. Influence of non-dimensional strength parameters on the seismic stability of cracked slopes [J]. Journal of Mountain Science, 2019, 16(1): 153-167. DOI: 10.1007/ s11629-017-4753-9.
[9] LOW B K. Efficient probabilistic algorithm illustrated for a rock slope [J]. Rock Mechanics and Rock Engineering, 2008, 41(5): 715-734. DOI: 10.1007/s00603-007-0146-7.
[10] LOW B K. Reliability analysis of rock slopes involving correlated nonnormals [J]. International Journal of Rock Mechanics and Mining Sciences, 2007, 44(6): 922-935. DOI: 10.1016/j.ijrmms.2007.02.008.
[11] HUANG X C, ZHOU X P. Probabilistic assessment for slope using the generalized Chebyshev inequalities [J]. International Journal of Geomechanics, 2020, 20(4): 06020003. DOI:10.1061/(asce)gm.1943-5622.0001638.
[12] HUANG X C, ZHOU X P. Reliability analysis of a large-scale landslide using SOED-based RSM [J]. Environmental Earth Sciences, 2017, 76(23): 794. DOI: 10.1007/ s12665-017-7136-1.
[13] LI D Q, CHEN Y F, LU W B, ZHOU C B. Stochastic response surface method for reliability analysis of rock slopes involving correlated non-normal variables [J]. Computers and Geotechnics, 2011, 38(1): 58-68. DOI: 10.1016/j.compgeo.2010.10.006.
[14] HUANG X C, ZHOU X P, MA W, NIU Y W, WANG Y T. Two-dimensional stability assessment of rock slopes based on random field [J]. International Journal of Geomechanics, 2017, 17(7): 04016155. DOI: 10.1061/(ASCE)GM.1943- 5622.0000858.
[15] LOW B K. Reliability analysis of rock wedges [J]. Journal of Geotechnical and Geoenvironmental Engineering, 1997, 123(6): 498-505. DOI: 10.1061/(ASCE)1090-0241(1997) 123:6(498).
[16] LI D Q, ZHOU C B, LU W B, JIANG Q H. A system reliability approach for evaluating stability of rock wedges with correlated failure modes [J]. Computer and Geotechnics 2009, 36(8): 1298-1307. DOI: 10.1016/j.compgeo.2009.05. 013.
[17] JOHARI A, LARI A M. System reliability analysis of rock wedge stability considering correlated failure modes using sequential compounding method [J]. International Journal of Rock Mechanics and Mining Sciences, 2016, 82: 61-70. DOI: 10.1016/j.ijrmms.2015.12.002.
[18] XU X, ZHOU X, HUANG X, XU L. Wedge-failure analysis of the seismic slope using the pseudodynamic method [J]. International Journal of Geomechanics, 2017, 17(12): 04017108. DOI: 10.1061/(asce)gm.1943-5622.0001 015.
[19] TIWARI G, LATHA G M. Reliability analysis of jointed rock slope considering uncertainty in peak and residual strength parameters [J]. Bulletin of Engineering Geology and the Environment, 2019, 78(2): 913-930. DOI: 10.1007/s10064- 017-1141-1.
[20] NEKOUEI AM, AHANGARI K. Validation of Hoek-Brown failure criterion charts for rock slopes [J]. International Journal of Mining Science and Technolgy, 2013, 23(6): 805-808. DOI: 10.1016/j.ijmst.2013.10.004.
[21] ZHOU X P , HUANG X C. Reliability analysis of slopes using UD-based response surface methods combined with LASSO [J]. Engineering Geology, 2018, 233: 111-123. DOI: 10.1016/j.enggeo.2017.12.008
[22] LIN Y L, ZHAO L H, YANG T Y. YANG G L, CHEN X B. Investigation on seismic behavior of combined retaining structure with different rock shapes [J]. Structural Engineering and Mechanics, 2020, 73(5): 599-612. DOI: 10.12989/sem.2020.73.5.599.
[23] AUSILIO E, CONTE E, DENTE G. Seismic stability analysis of reinforced slopes [J]. Soil Dynamics and Earthquake Engineering, 2000, 19(3): 159-172. DOI: 10.1016/S0267-7261(00)00005-1.
[24] YANG Xiao-li, SUI Zhi-rong. Seismic failure mechanisms for loaded slopes with associated and nonassociated flow rules [J]. Journal of Central South University of Technology, 2008, 15(2): 276-279. DOI: 10.1007/s11771-008-0051-6.
[25] CHEN W F, LIU X L. Limit analysis in soil mechanics [M]. Elsevier, 2012.
[26] ZHAO L H, CHENG X, LI L, CHEN J Q, ZHANG Y B. Seismic displacement along a log-spiral failure surface with crack using rock Hoek–Brown failure criterion [J]. Soil Dynamics and Earthquake Engineering, 2017, 99: 74-85. DOI: 10.1016/j.soildyn.2017.04.019.
[27] ZHAO L H, CAO J Y, ZHANG Y B, LUO Q. Effect of hydraulic distribution on the stability of a plane slide rock slope under the nonlinear Barton-Bandis failure criterion [J]. Geomech Eng 2015, 8(3): 391-414. DOI: 10.12989/gae. 2015.8.3.391.
[28] MENG F, WONG L N Y, ZHOU H, YU J, CHENG G T. Shear rate effects on the post-peak shear Behaviour and acoustic emission characteristics of artificially split granite joints [J]. Rock Mechanics and Rock Engineering, 2019, 52(7): 2155-2174. DOI: 10.1007/ s00603-018-1722-8.
[29] HU Bo, YANG Sheng-qi, XU Peng. A nonlinear rheological damage model of hard rock [J]. Journal of Central South University, 2018, 25(7): 1665-1677. DOI: 10.1007/s11771- 018-3858-9.
[30] ZHAO Lian-heng, LI Liang, YANG Feng, LUO Qiang, LIU Xiang. Upper bound analysis of slope stability with nonlinear failure criterion based on strength reduction technique [J]. Journal of Central South University of Technology, 2010, 17(4): 836-744. DOI: 10.1007/s11771- 010-564-7.
[31] ZUO S, ZHAO L H, DENG D P, WANG Z B, ZHAO Z G. Reliability back analysis of landslide shear strength parameters based on a general nonlinear failure criterion [J]. International Journal of Rock Mechanics and Mining Sciences, 2020, 126: 104189. DOI: 10.1016/j.ijrmms.2019. 104189.
[32] ZHAO L H, JIAO K F, ZUO S, YU C H, TANG G P. Pseudo-static stability analysis of wedges based on the nonlinear Barton-Bandis failure criterion [J]. Geomechanics and Engineering, 2020, 20(4): 287-297.
[33] WANG J, ZHANG Y, WANG P. Post-peak roughness degradation model based on Barton-Bandis criterion for rock joint [C]// IOP Conference Series: Earth and Environmental Science. 2019, 304: 52-57. DOI: 10.1088/1755-1315/304/ 5/052057.
[34] LUO Qiang, ZHAO Lian-heng, LI Liang, TAN Han-hua, LUO Wei. Stability analysis of anchored rock slope based on Barton-Bandis failure criterion [J]. Rock and Soil Mechanics, 2013, 34(5): 1351-1359. DOI: 10.16285/j.rsm.2013.05.004. (in Chinese)
[35] NAGPAL A, BASHA B M. NAGPAL A, BASHA B M. Reliability analysis of anchored rock slopes against planar failure [C]// Proceedings of Indian Geotechnical Conference. Delhi, Indian, 2012.
[36] BARTON N, CHOUBEY V. The shear strength of rock joints in theory and practice [J]. Rock Mechanics and Rock Engineering, 1977, 10: 1-54. DOI: 10.1007/BF01261801.
[37] BARTON N. The shear strength of rock and rock joints [J]. International Journal of Rock Mechanics and Mining Sciences & Geomechanics Abstracts, 1976, 13(9): 255-279. DOI: 10.1016/0148-9062(76)90003-6.
[38] LIU Ming-wei, FU Hua, WU Jin-liang. Current situation of determination METHODS OF SHEAR strength parameters of rock-mass discontinuities and new thoughts [J]. Journal of Chongqing Jiaotong University, 2005, 24(5): 65-67. (in Chinese)
[39] XIA C C, SUN Z G. Engineering rock mass joint mechanics [M]. Shanghai: Tongji University Press, 2002. (in Chinese)
[40] MACEDO J, CANDIA G. Performance-based assessment of the Seismic Pseudo-static coefficient used in slope stability analysis [J]. Soil Dynamics and Earthquake Engineering, 2020, 133: 106109. DOI: 10.1016/j.soildyn. 2020.106109.
[41] SIAD L. Seismic stability analysis of fractured rock slopes by yield design theory [J]. Soil Dynamics and Earthquake Engineering, 2003, 23(3): 21-30. DOI: 10.1016/S0267- 7261(02)00213-0.
[42] PAN Qiu-jing, QU Xing-ru, WANG Xiang. Probabilistic seismic stability of THREE-DIMENSIONAL SLOPES by pseudo-dynamic approach [J]. Journal of Central South University, 2019, 26(7): 1687-1695. DOI: https://DOI.org/10. 1007/s11771- 019-4125-4.
[43] GOODMAN R E. Introduction to rock mechanics [M]. New York: Wiley, 1980.
[44] WITTKE W. Coupling of stress-strain behavior and seepage flow [M]// Rock Mechanics Based on an Anisotropic Jointed Rock Model (AJRM). D-69451 Weinheim, Germany: Wiley-VCH Verlag GmbH, 2014: 165-179.
[45] TONON F, BERNARDINI A, MAMMINO A. Reliability analysis of rock mass response by means of random set theory [J]. Reliability Engineering & System Safety, 2000, 70(3): 263-282. DOI: 10.1016/S0951-8320(00)00059-4.
[46] HOEK E, BRAY J D. Rock slope engineering [M]. 3rd ed. London and New York: Taylor and Francis Group, 1981. Reprinted in 1999.
[47] LOW B K, EINSTEIN H H. Simplified reliability analysis for wedge mechanisms in rock slopes [C]// Proc 6th Int Symp Landslides. Rotterdam, the Netherlands: Balkema, 1992: 499-507.
[48] WYLLIE D C, MAH C W. Rock slope engineering: Civil and mining [M]. 4th ed. New York: Spon Press, 2004.
[49] JIMENEZ-RODRIGUEZ R, SITAR N. Rock wedge stability analysis using system reliability methods [J]. Rock Mechanics and Rock Engineering, 2007, 40(4): 419-427. DOI: 10.1007/s00603-005-0088-x.
[50] JIMENEZ-RODRIGUEZ R, SITAR N, CHACON J. System reliability approach to rock slope stability [J]. International Journal of Rock Mechanics and Mining Sciences, 2006, 43(6): 847-859. DOI: 10.1016/j.ijrmms.2005.11.011.
[51] HAMMAH R E, YACOUB T E, CURRAN J H. Probabilistic slope analysis with the finite element method [C]// Proc 41st US Symp Rock Mech, fourth US-Canada Rock Mech Symp. Asheville, North Carolina, USA, 2008.
[52] ZHAO L H, CHENG X, ZHANG Y B, LI L, LI D J. Stability analysis of seismic slopes with cracks [J]. Computers and geotechnics, 2016, 77: 77-90.
[53] ZHANG Guang, ZHU Wei-shen. Parameter sensitivity analysis and optimizing for test programs [J]. Rock and Soil Mechanics, 1993, 14(1): 51-58. (in Chinese)
[54] THOFT-CHRISTENSEN P, BAKER M J. Structural reliability theory and its applications [M]. Berlin, Germany: Springer-Verlag, 1982.
[55] DUNCAN J M, WRIGHT S G, BRANDON T L. Soil strength and slope stability [M]. 2nd ed. New York: John Wiley and Sons, 2014.
(Edited by YANG Hua)
中文导读
基于非线性B-B准则的三维楔体地震拟静力可靠度分析
摘要:本文基于非线性Barton-Bandis(B-B)破坏准则,对地震拟静力作用下三维楔体的系统可靠度展开研究。基于蒙特卡洛算法考虑参数相关性与变异性计算系统可靠度,将计算结果与SWEDGE软件计算结果对比,验证该方法的准确性与适用性。通过开展参数分析讨论各参数变化对系统可靠度的影响规律。探究失效概率、安全系数与变异系数三者相互关系,并绘制地震荷载作用下岩质楔体的稳定概率曲线。研究表明:B-B破坏准则参数相关性对失效概率的影响较大,但相关性对系统可靠度的增加或减小效应受其他参数取值影响;在地震力作用下,沿两不连续面发生破坏的概率对系统失效概率贡献最大,另外三种破坏模式的失效概率对系统失效概率贡献相对较小;随着地震拟静力方向的变化各参数的敏感性系数均处于波动状态,相对敏感性较高的参数是与节理面走向相关的参数θ1和θ2;系统的失效概率是安全系数的大小与其变异系数的函数。
关键词:三维岩质楔体;地震拟静力;非线性Barton-Bandis破坏准则;系统可靠度;敏感性分析;稳定概率曲线
Foundation item: Project(51878668) supported by the National Natural Science Foundation of China; Projects(2017-122-058, 2018-123-040) supported by the Guizhou Provincial Department of Transportation Foundation, China; Project([2018]2815) supported by the Guizhou Provincial Department of Science and Technology Foundation, China
Received date: 2020-01-31; Accepted date: 2020-07-22
Corresponding author: LI De-jian, PhD, Lecturer; Tel: +86-13687324221; E-mail: lidejian@csu.edu.cn; ORCID: https://orcid.org/ 0000-0002- 8230-730X

