��Ȼ��ͭ����ᄃ��ı����ԥ��Ϣ�����۷���
��Դ�ڿ����й���ɫ����ѧ��(Ӣ�İ�)2013���3��
�������ߣ������� �˾�˧ ������ �� ��
����ҳ�룺796 - 803
Key words��chalcopyrite; surface relaxation; reconstruction; sulfur-rich surface
ժ Ҫ��ͨ��XRD�ⶨ��ͭ����ľ���������������ͭ��ᾧ�������ڲ�ԭ�����й���ͨ��������ѧ���Է�����ָ����ͭ������ԥ���ֱ��渻��������AFM��û�ͭ��������ά�۽ṹ����ͼ�ͱ�������Ʒֲ���ά����ͼ��AFM�������Խ����������ͭ�����ԭ�ӵ�����ͺ��������뾧���ڲ���ȷ����˺ܴ�仯�������ϣ�ͭ��������ԭ�������ԭ����λ�÷���λ�ƣ��������˱����ԥ����ԥ�Ľ��ʹ����ԭ��λ�ڱ���������������ϣ�AFMͼ����ʾԭ�Ӽ������淢���ع����ع��Ľ��ʹ�ò�������������ԭ�ӿ������γ�ԭ�Ӿۼ��塣���û����ܶȷ������۵���������ƽ�沨�������Ʒ������ӽ��������ܽ�Ϲ����ݶȽ�����ʽ���Ծ��������Ż������������(001)�����ԭ���Ų���ò���������ԭ����Z���������ƣ�ͭ�����������������ӣ�����������ͣ����淢����ԥ������ṹ�����ع������ֱ����ԥ���ع����µĸ������Ͳ������ԭ�Ӿۼ��Ը�ѡ������ҪӰ�졣
Abstract: X-ray diffraction was used to measure the unit cell parameters of chalcopyrite crystal. The results showed that the chalcopyrite crystal is perfect, and the arrangement of its atoms is regular. A qualitative analysis of molecular mechanics showed that surface relaxation causes the chalcopyrite surface to be sulfur enriched. Atomic force microscope (AFM) was used to obtain both a microscopic three-dimensional topological map of chalcopyrite surface and a two-dimensional topological map of its electron cloud. The AFM results revealed that the horizontal and longitudinal arrangements of atoms on the chalcopyrite surface change dramatically compared with those in the interior of the crystal. Longitudinal shifts occur among the copper, iron and sulfur atoms relative to their original positions, namely, surface relaxation occurs, causing sulfur atoms to appear on the outermost surface. Horizontally, AFM spectrum showed that the interatomic distance is irregular and that a reconstruction occurs on the surface. One result of this reconstruction is that two or more atoms can be positioned sufficiently close so as to form atomic aggregates. The lattice properties of these models were calculated based on DFT theory and compared with the experimental results and those of previous theoretical works. On analyzing the results, the atomic arrangement on the (001) surface of chalcopyrite is observed to become irregular, S atoms move outward along the Z-axis, and the lengths of Cu��S and Fe��S bonds are enlarged after geometry optimization because of the surface relaxation and reconstruction. The sulfur-rich surface and irregular atomic aggregates caused by the surface relaxation and reconstruction greatly influence the bulk flotation properties of chalcopyrite.
Trans. Nonferrous Met. Soc. China 23(2013) 796-803
Shu-ming WEN, Jiu-shuai DENG, Yong-jun XIAN, Liu DAN
Faculty of Land Resource Engineering, Kunming University of Science and Technology, Kunming 650093, China
Received 9 January 2012; accepted 23 December 2012
Abstract: X-ray diffraction was used to measure the unit cell parameters of chalcopyrite crystal. The results showed that the chalcopyrite crystal is perfect, and the arrangement of its atoms is regular. A qualitative analysis of molecular mechanics showed that surface relaxation causes the chalcopyrite surface to be sulfur enriched. Atomic force microscope (AFM) was used to obtain both a microscopic three-dimensional topological map of chalcopyrite surface and a two-dimensional topological map of its electron cloud. The AFM results revealed that the horizontal and longitudinal arrangements of atoms on the chalcopyrite surface change dramatically compared with those in the interior of the crystal. Longitudinal shifts occur among the copper, iron and sulfur atoms relative to their original positions, namely, surface relaxation occurs, causing sulfur atoms to appear on the outermost surface. Horizontally, AFM spectrum showed that the interatomic distance is irregular and that a reconstruction occurs on the surface. One result of this reconstruction is that two or more atoms can be positioned sufficiently close so as to form atomic aggregates. The lattice properties of these models were calculated based on DFT theory and compared with the experimental results and those of previous theoretical works. On analyzing the results, the atomic arrangement on the (001) surface of chalcopyrite is observed to become irregular, S atoms move outward along the Z-axis, and the lengths of Cu��S and Fe��S bonds are enlarged after geometry optimization because of the surface relaxation and reconstruction. The sulfur-rich surface and irregular atomic aggregates caused by the surface relaxation and reconstruction greatly influence the bulk flotation properties of chalcopyrite.
Key words: chalcopyrite; surface relaxation; reconstruction; sulfur-rich surface
1 Introduction
Flotation is a major method of mineral processing and has been widely used to recover chalcopyrite. The absorption of the collector on the chalcopyrite surface is a precondition for flotation, and this absorption depends on the surface properties of chalcopyrite. Therefore, the study of the surface properties is of great theoretical and practical value in the flotation of chalcopyrite. The selectivity and recovery of this valuable mineral by flotation are tuned by controlling chalcopyrite surface oxidation and adding surfactant to the flotation pulp. In practice, these factors are manipulated empirically to achieve the desired particle surface chemistry properties so as to activate or depress mineral flotation [1].
The surface chemical heterogeneity observed in flotation has a significant impact on the floatability of the particles [2]. Changes in particle surface properties due to grinding and regrinding play a key role in mineral flotation performance [3]. The effects of grinding conditions on mineral floatability have been studied by PENG et al [4,5]. It has been observed that the flotation and surface properties of sulfide minerals, such as galena and chalcopyrite, are markedly affected by the chemical conditions during grinding [4-7]. Chalcopyrite is a very typical crystal mineral. In the process of crushing this mineral, the newly formed surface structure is related to the internal structure of the crystal, but it is not absolutely equivalent to the internal structure. This difference is due to the surface relaxation and reconstruction occurring during surface formation. The surface relaxation and reconstruction of the chalcopyrite surface greatly influence the surface properties of the crystals and thus determine chalcopyrite��s flotation properties.
Many different surface atomic sites with various broken bonds exist on the surface of a mineral. The surface may also be heterogeneous due to the crystal reconstruction, the various defects and the inherent anisotropic crystal structure of a number of minerals [8]. It has been reported that the wettability, aggregation, dispersion, and flotation of minerals are affected by their crystal structures and surface properties [9-11]. The band gap of sphalerite is reduced, and the conductivity is increased, when sphalerite crystals contain impurities, which is advantageous to the adsorption of oxygen on the sphalerite surface. In addition, vacancies greatly influence the geometric structure of the surrounding atoms, and an obvious surface relaxation occurs, which results in the alteration of the electronic properties of sphalerite [12].
Chalcopyrite (CuFeS2, space group  ) is an antiferromagnetic semiconductor with a structure similar to sphalerite. In chalcopyrite, two Fe atoms and two Cu atoms respectively replace the four Zn atoms of sphalerite, whereas the S atoms are unchanged [13]. The Fe and Cu positions alternate in the lattice; the unit cell size in the Z-direction is doubled from the cubic sphalerite. Chalcopyrite displays poor cleavage in all directions. Both sulfur and metal atoms are tetrahedrally coordinated: every one S atom to every four metal atoms and every one metal atom to every four S atoms [14]. The (001) surface was indicated by KLAUBER as the most adequate surface to explain his XPS data under inert conditions [15]. Although other surfaces such as (111), (101), (110), and (112) have been pointed out as relevant for chalcopyrite and similar structures [14,16,17], chalcopyrite is considered to have no preferential cleavage.
Furthermore, in chalcopyrite, surface reconstruction leads to the displacement of Fermi level to the right, and the Fe 3d electronic states are then occupied in the valence region. The antibonding character of these states explains the experimental observation that the Fe is released into solution from the surface prior to Cu [18,19]. It is known that further reaction on the reconstructed surface is probably assisted by water, leading to the oxidation of the sulfur center and the formation of polymetal oxides [20]. It is clear that the reconstruction of the surface is involved in the leaching mechanism and may be one of the factors responsible for the slow dissolution of chalcopyrite.
A high binding energy asymmetry was reported for the S 2p peak in the X-ray photoelectron spectrum of the virginal chalcopyrite (CuFeS2) surfaces. The Cu, Fe and S 2p spectra of freshly fractured surfaces of chalcopyrite have been found to display a loss feature at energies close to 2.6 eV, which is attributed to an interband transition, S 3p to Fe 3d, from occupied S levels to unoccupied Fe levels [15]. Calculation of the bulk electronic structure was performed [21]. Several previous cluster calculations were also performed [22].
The relatively complete information of surface relaxation and reconstruction of mineral crystal is only obtained under an absolute vacuum condition. But an absolute vacuum condition cannot be founded, researchers only can obtain some vestigial information of the surface relaxation and reconstruction in approach vacuum or inert gas condition. We can understand in certain degree the changes of surface characters caused by surface relaxation and reconstruction through this vestigial information. In this study, some vestigial information of the surface relaxation and reconstruction of chalcopyrite was investigated through atomic force microscopy (AFM) in inert gas condition and the process of relaxation was analysed by quantum chemistry calculations. Computational modeling was used as a tool to illuminate the relaxation and reconstruction processes of chalcopyrite in connection with surface science experiments, and the results were discussed. In this way, an improved understanding of the chalcopyrite surface and crystal structure properties was established. Accurate first-principle calculations were performed on the chalcopyrite structure [23,24]. Most of the prior theoretical studies on the semiconductor chalcopyrite focused on the bulk electronic properties and band structure [22]. The chemical reactivity and reconstruction of the chalcopyrite surface did not receive attention commensurate with its technological and industrial importance. No previous experimental studies on the surface relaxation and reconstruction were reported. The experimental results presented herein confirm the surface relaxation and structure reconstruction vestigial information of chalcopyrite, and the results of quantum chemical calculations are also in agreement with the experimental results.
2 Experimental
2.1 Minerals
The chalcopyrite sample was obtained from Yunnan Copper Industry Co., Ltd, China. It had a particle size of 20-30 mm and a good natural crystal habit, and it was surrounded with a quartz adhesion. After the quartz was eliminated, the sample was crushed to the desired granularity and used as a raw material which would be broken in inert gas condition for the experiments. The chalcopyrite was yellow, with greenish-black stripes and a metallic luster. Its Mohs hardness was 3-4, and its relative density was 4.2 g/cm. Mineral identification indicated that it was a natural chalcopyrite crystal; its elemental analysis results are shown in Table 1.
Table 1 Chemical composition of chalcopyrite (mass fraction, %)
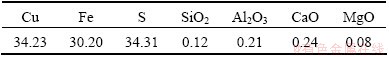
The chemical analysis of the chalcopyrite shows that the sample used in the experiment contains copper, iron and sulfur; their combined contents amount to 98.74% of the total. The contents of copper, iron and sulfur are consistent with the theoretical composition of chalcopyrite, which is 34.56% Cu, 30.52% Fe and 34.92% S, indicating that the purity of the chalcopyrite sample was high, approximately 99%. The mole ratios of copper, iron and sulfur were 1:1:2, as expected. The mole content of sulfur is 50%.
2.2 Methods
2.2.1 Instruments and experimental methods
Chalcopyrite with a purity of 98.74% was crushed to a particle size less than 100 ��m in an agate mortar, then put in sealed bags under argon atmosphere. Samples were tested by X-ray diffraction (XRD); Pattern analysis provided information on the unit cell parameters of the chalcopyrite crystals. The XRD instrument was a Rigaku Dmax with nickel-filtered Cu K�� (��=0.15406 nm, 40 kV, 30 mA) radiation and a graphite monochromator.
Chalcopyrite powder sample with size less than 100 ��m was taken out from the sealed bags, and was put into the AFM test bed to scan the surface of the chalcopyrite crystals in nitrogen atmosphere to obtain the atomic scale surface topography and the electron distribution topology. The AFM unit was an SPA-400SPM made in Japan, with a PPP-NCHR-50 probe used in tapping mode at a 1.0 Hz scanning rate.
2.2.2 Computational details
The calculation model was based on the X-ray diffraction analysis results. All calculations were performed based on density functional theory (DFT), as implemented in CASTEP code [25-29]. Ultrasoft pseudopotentials were used to represent the interactions between the ionic core and valence electrons. The exchange correction energy was calculated from the generalized gradient-corrected (GGA) function developed by PERDUW et al [30-33]. The total energy changes during the optimization process finally converged to 2.0��10-6 eV, and the force per atom was reduced to 0.05 eV/  . The Monkhorst�CPack scheme was used for k-point sampling in the first irreducible Brillouin zone (BZ), with a 2��2��1 mesh for all structures. The valence electron configurations included in this study were Cu: 3d104s1, Fe: 3d64s2 and S: 3s23p4. The Pulay density mixing scheme was applied for the electron energy minimization process. The maximum energy cutoff value was 280.0 eV for plane-wave expansions.
3 Results and discussion
3.1 Internal structure of chalcopyrite crystal
The chalcopyrite mineral was tested by XRD, and the results are shown in Fig. 1.
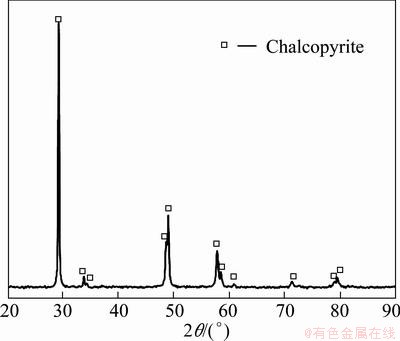
Fig. 1 XRD pattern of chalcopyrite crystal
Distinct diffraction peaks were obtained at the angles of 29.1�� and 49��, completely matching the reference diffraction peaks of chalcopyrite crystal, indicating that the studied chalcopyrite is consistent with the standard chalcopyrite. The standard chalcopyrite crystal parameters are given in the tetragonal system: a=b=5.289 , c=10.423 , and ��=��=��=90��. When the crystal was crushed, the broken chemical bonds were mainly those between sulfur and copper or between sulfur and iron.
The XRD testing results also showed that the diffraction absorption peak had a high intensity, and the full width at half maximum was small, which indicates that the chalcopyrite sample has thick crystal grains, the crystal��s internal structure is well-distributed, and its atoms are regularly arranged.
3.2 Qualitative analysis of molecular mechanics for crystal surface relaxation of chalcopyrite
Crystal surface relaxation manifests shifts in the directions of surface atoms that are perpendicular to the surface. From the perspective of molecular mechanics, the reason for the occurrence of surface relaxation is that when a new surface is formed, the stress on the surface atoms is out of balance, resulting in high surface energy. Such a surface is unstable; to reach stability, the surface atoms shift in a direction normal to the surface so as to lower the surface energy. The shift in each layer is different, and the more obvious changes occur closer to the surface. This surface reconstruction means that the surface structure and the structure of the body are different in nature. This reconstruction is characterized by the appearance of a superstructure on the surface, namely, the basic vectors of the two unit cells expand by an integral multiple. However, when influenced by atoms of foreign substances and when relaxation occurs, the integral-multiple expansion of the basic vector of the two-dimensional unit cells is also influenced, and irregular changes occur.
When a chalcopyrite crystal is crushed, the ideal arrangement of surface atoms is the same as that in the body. However, the broken chemical bonds unbalance the force of the chemical bonds of surface atoms in the normal direction. The surface atoms must redistribute so that their stresses reach a new equilibrium state. The surface relaxation of chalcopyrite crystal is illustrated in Figs. 2 and 3. Here, chalcopyrite crystal is broken along line A to form surface B. Each sulfur atom on the surface loses a copper atom or an iron atom, and thus, its extranuclear negative charge increases. Under the action of electropositive attraction of the adjacent copper and iron atoms, the increased negative charge shifts toward copper and iron atoms in the inner surface layer (Fig. 3(a)); thus, polarization appears in sulfur atom on the surface, and a dipole is formed. The electropositivity of copper and iron atoms on the inner side of the surface repels the positive pole of the sulfur dipole (Fig. 3(b)) and causes sulfur atom on the surface to shift outward. When this outward shifting occurs, the extranuclear electron of sulfur atom is redistributed; thus, the polarity of sulfur atom is reduced, and the chemical bonds between sulfur and copper and iron atoms are lengthened (Fig. 3(c)). The final outcome is that sulfur atom, copper atom and iron atom at the surface remain stable and balanced. The relaxation on the surface makes sulfur atoms relatively more abundant, resulting in a sulfur-rich surface.
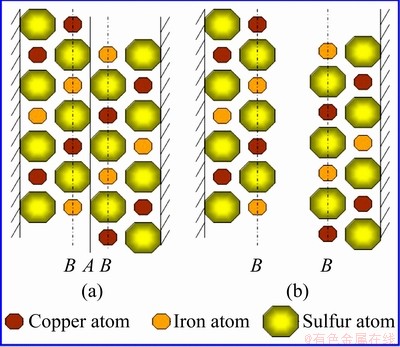
Fig. 2 Surface of chalcopyrite formed after crystal crushing
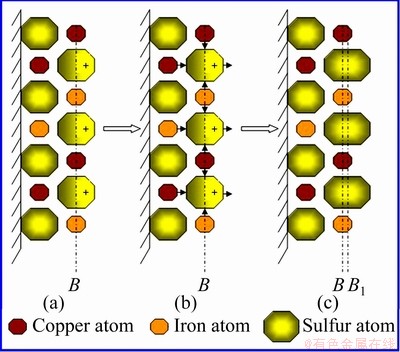
Fig. 3 Map of surface relaxation process of chalcopyrite
3.3 AFM study of surface relaxation and reconstruction vestigial information of chalcopyrite crystal
After the pure chalcopyrite being cut, the (001) surface of those most smooth surfaces was selected to be the object of AFM study. The (001) surface topological images of the pure chalcopyrite crystal are illustrated in Figs. 4-7. They are called topological images because when the surface is observed from the microscopic perspective of the atomic scale, the surface is no longer motionless; instead, it is constantly changing and in motion. The images scanned at different times are thus different, but their virtual surface elements are constant. Figure 4 shows the AFM three-dimensional images of the chalcopyrite surface on the atomic scale. Figure 5 shows ichnograph of the chalcopyrite crystal surface on the atomic scale. Figure 6 presents the two-dimensional topology of the electron cloud of a single atom on the chalcopyrite crystal surface. Figure 7 presents the two-dimensional topology of the electron cloud of more atoms on the chalcopyrite crystal surface.
As illustrated in Fig. 4, the chalcopyrite crystal surface is not smooth at all when observed at the atomic scale. From an even more microscopic perspective, the surface is different everywhere, showing that the atomic arrangement on the surface of chalcopyrite is very irregular compared with that of the interior of crystal.
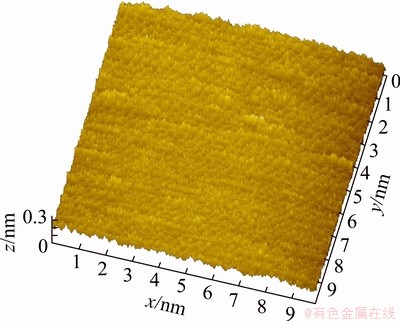
Fig. 4 AFM three-dimensional image of chalcopyrite crystal on atomic scale
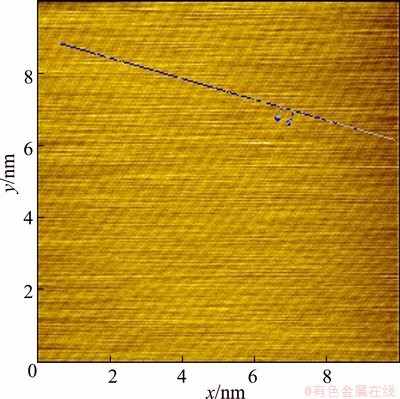
Fig. 5 Ichnograph of chalcopyrite crystal surface on atomic scale
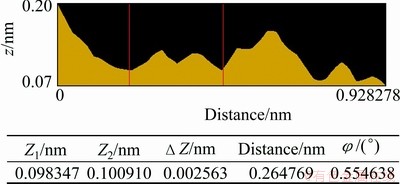
Fig. 6 Two-dimensional topological graph of electron cloud for a single atom on chalcopyrite crystal surface (Z1 and Z2 are relative positions in the Z axis)
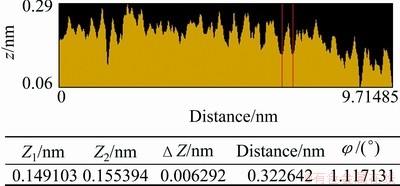
Fig. 7 Two-dimensional topological graph of electron cloud of more atoms on chalcopyrite crystal surface (Z1 and Z2 are relative positions in the Z axis)
TODD et al [34] argued cogently the Cu L2,3-edge NEXAFS spectrum of chalcopyrite, and the results indicated the presence of all Cu(II) rather than Cu(I). This conclusion appeared to be supported by the corresponding Fe L3-edge NEXAFS spectrum, in which an absorption peak at an energy is similar to that of mackinawite, and the author revealed the presence of Fe(II) rather than Fe(III). More recently, MIKHLIN et al [35] have also argued predominantly Fe(II) in chalcopyrite according to the total electron yield (TEY) Fe L2,3-edge spectrum of chalcopyrite. It is known that the atomic radii of Cu2+, Fe2+, and S2- are 0.072 nm, 0.076 nm and 0.184 nm, respectively. When Cu2+, Fe2+and S2- form bonds, the interatomic distances are smaller than those of the isolated ions combined. If the chalcopyrite surface is in orderly arrangement in a ratio of 1:1:2 of copper, iron and sulfur atoms, then the region shown in Fig. 4 contains more than 376 atoms, among which there are more than 94 copper atoms, more than 94 iron atoms and more than 188 sulfur atoms.
It can also be seen in Fig. 4 that the height of surface atoms differs in different directions in space; the difference is 0.3 nm, which is close to the diameter of a sulfur ion. In other words, on the normal chalcopyrite surface, there is a roughness on the order of magnitude of one sulfur atom. In Figs. 6 and 7, we also observe a 0.2-0.29 nm height difference in the two-dimensional distribution of atoms in different spatial directions, more clearly indicating the atomic roughness of the chalcopyrite surface. In other words, the atoms on the surface seemingly shift from their original positions, and surface relaxation occurs.
When the chalcopyrite surface is first formed, the broken chemical bonds are very unstable and have very high energy. To lower the surface energy, the broken chemical bonds can absorb atoms of foreign substances such as oxygen and carbon dioxide. Even in vacuum, the broken chemical bonds on the surface can also form bonds with others nearby to lower their energy. This bonding effect causes the surface atoms to shift from their original, regular positions and adopt random and irregular arrangements. These phenomena drive the reconstruction of the chalcopyrite crystal surface.
The AFM micrograph of the chalcopyrite surface on atomic scale shown in Fig. 4 indicates that the surface atoms are not only rugged but also unevenly distributed, which differs from the interior of the crystal, where some atoms are almost overlapping while others are very far away from each other horizontally. As shown in Fig. 7, the observed bivariate distribution of electron cloud of atoms on the chalcopyrite crystal surface also clearly indicates that the horizontal distances between the atoms are irregular. Some combinations are formed by two overlapping atoms, and others are formed by more than two atoms overlapping. The surface shows obvious signs of reconstruction.
In Fig. 5, it is seen that the arrangements of atoms are in stripes. The brighter stripes are the raised atomic arrangements. The less bright stripes are sunken atomic arrangements, and the atoms are in parallel arrangement at an angle of 45�� on the map. In Fig. 6, the region between the two vertical lines is the two-dimensional electron cloud distribution graph of the raised atoms in Fig. 5. It is calculated from this graph that the diameter of each atom is approximately 0.265 nm, which is within the diameter of S2-, close to the diameter of S2- when it loses a partial negative charge. Therefore, this can be generally regarded as a sulfur atom after forming a bond with copper ion or iron ion. The region between the two red lines in Fig. 7 corresponds to the raised atoms in Fig. 5, with a diameter of 0.323 nm, which is also close to the diameter of S2- when S2- loses a partial negative charge. Therefore, this can also be generally regarded as a sulfur atom. Together, these results show that the surface relaxation of chalcopyrite causes sulfur atoms to appear at the outermost layer of surface.
3.4 Quantum chemical calculations and simulation
Based on the quantum chemistry calculations, the results of the surface relaxation of chalcopyrite crystal are shown in Fig. 8. In Fig. 8(a) the model is not optimized, whereas in Fig. 8(b), the model is optimized.
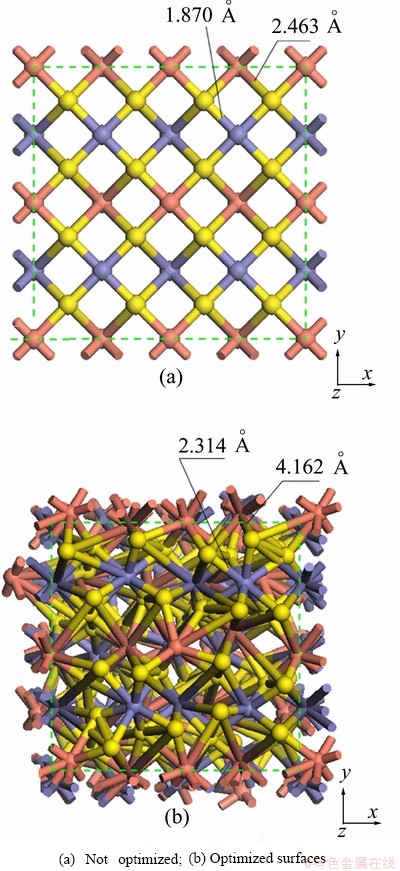
Fig. 8 (001) surface of chalcopyrite
The results shown in Fig. 8(a) indicate that sulfur, copper, and iron atoms are arranged in accordance with the rules on the (001) surface of chalcopyrite. Until the energy is optimized to convergence, as shown in Fig. 8(b), the surface atomic arrangement becomes irregular. The atomic arrangement of sulfur, copper, and iron is distorted, especially with respect to the sulfur atoms. The sulfur atoms shift outward significantly in the direction of Z-axis, and the unit cell appears to expand, corresponding to c values changing from 14.8105 to 18.0175 on Z-axis. The relaxation results in a lengthening of the S��Fe and S��Cu bonds from 1.870 and 2.463 to 2.314 and 4.162 , respectively. The increased S��Fe and S��Cu bond lengths result in sulfur atoms being exposed, leading to the formation of sulfur-rich surface. Atomic arrangements on both the X-axis and Y-axis also changed, leading to surface relaxation and reconstruction. The quantum chemistry calculation results are in very good agreement with the experimental data.
4 Conclusions
1) The interior of the chalcopyrite has a regular atomic arrangement, but on the surface, the atomic positions shift lengthwise, and surface relaxation appears.
2) The surface relaxation of chalcopyrite causes sulfur atom to occupy more outer positions, and a sulfur-rich surface appears.
3) The atoms on the surface also shift in a horizontal position, and surface reconstruction occurs, leading to aggregates, forming an irregular and reconstructed surface.
4) The lattice properties of these models were calculated based on DFT theory and compared with the experiments and previous theoretical works. On analyzing the results, we found that the atomic arrangement of the (001) surface of chalcopyrite became irregular, the Z axis expanded, with the c value changing from 14.8105 to 18.0175 , and S atoms moved outward along the Z axis, causing the lengths of the Cu��S and Fe��S bonds to enlarge after geometry optimization. The quantum chemistry calculation results coincide quite well with the experimental data and the qualitative analysis results of the molecular mechanics.
References
[1] ABREU S B E, SKINNER W. Predicting the surface chemistry contribution to the flotation recovery of chalcopyrite by ToF-SIMS [J]. Minerals Engineering, 2011, 24: 160-168.
[2] ABREU S B E, BRIEN C, SKINNER W. ToF-SIMS as a new method to determine the contact angle of mineral surfaces [J]. Langmuir, 2010, 26: 8122-8130.
[3] YE X, GREDELJ S, SKINNER W, GRANO S R. Regrinding sulphide minerals��Breakage mechanisms in milling and their influence on surface properties and flotation behaviour [J]. Powder Technology, 2010, 203:133-147.
[4] PENG Y J, GRANO S, FORNASIERO D, RALSTON J. Control of grinding conditions in the flotation of chalcopyrite and its separation from pyrite [J]. International Journal of Mineral Processing, 2003, 69: 87-100.
[5] PENG Y J, GRANO S, FORNASIERO D, RALSTON J. Control of grinding conditions in the flotation of galena and its separation from pyrite [J]. International Journal of Mineral Processing, 2003, 70: 67-82.
[6] PENG Y, GRANO S, RALSTON J, FORNASIERO D. Towards prediction of oxidation during grinding (I): Galena flotation [J]. Minerals Engineering, 2002, 15: 493-498.
[7] CULLINAN V J, GRANO S R, GREET C J, JOHNSON N W, RALSTON J. Investigating fine galena recovery problems in the lead circuit of Mount Isa Mines lead/zinc concentrator (part 1): Grinding media effects [J]. Minerals Engineering, 1999, 12: 147-163.
[8] MOON K S, FUERSTENAU D W. Surface crystal chemistry in selective flotation of spodumene (LiAl[SiO3](2)) from other aluminosilicates [J]. International Journal of Mineral Processing, 2003, 72: 11-24.
[9] SCHRADER M E, YARIV S. Wettability of clay minerals [J]. Journal of Colloid and Interface Science, 1990, 136: 85-94.
[10] CIONE A P P, SCHMITT C C, NEUMANN M G, GESSNER F. The effect of added salt on the aggregation of clay particles [J]. Journal of Colloid and Interface Science, 2000, 226: 205-209.
[11] HU Y H, SUN W, JIANG H, MILLER J D, FA K Q. The anomalous behavior of kaolinite flotation with dodecyl amine collector as explained from crystal structure considerations [J]. International Journal of Mineral Processing, 2005, 76: 163-172.
[12] CHEN Y, CHEN J H, LI Y Q. Effect of vacancy defects on electronic properties and activation of sphalerite (110) surface by first- principles [J]. Transactions of Nonferrous Metals Society of China, 2010, 20: 502-506.
[13] DEER W A, HOWIE R A, ZUSSMAN J. An introduction to the rock forming minerals [M]. London: Longman, 1992.
[14] von OERTZEN G U, HARMER S L, SKINNER W M. XPS and ab initio calculation of surface states of sulfide minerals: Pyrite, chalcopyrite and molybdenite [J]. Molecular Simulation, 2006, 32: 1207-1212.
[15] KLAUBER C. Fracture-induced reconstruction of a chalcopyrite (CuFeS2) surface [J]. Surface and Interface Analysis, 2003, 35: 415-428.
[16] HARMER S L, PRATT A R, NESBITT W H, FLEET M E. Sulfur species at chalcopyrite (CuFeS2) fracture surfaces [J]. American Mineralogist, 2004, 89:1026-1032.
[17] BARKAT L, HAMDADOU N, MORSLI M, KHELIL A, BERNEDE J C. Growth and characterization of CuFeS2 thin films [J]. Journal of Crystal Growth, 2006, 297: 426-431.
[18] HARMER S L, THOMAS J E, FORNASIERO D, GERSON A R. The evolution of surface layers formed during chalcopyrite leaching [J]. Geochimica et Cosmochimica Acta, 2006, 70: 4392-4402.
[19] HACKL R P, DREISINGER D B, PETERS E, KING J A. Passivation of chalcopyrite during oxidative leaching in sulfate media [J]. Hydrometallurgy, 1995, 39: 25.
[20] DUARTE H A, de OLIVEIRA C. Disulphide and metal sulphide formation on the reconstructed (001) surface of chalcopyrite: A DFT study [J]. Applied Surface Science, 2010, 257: 1319-1324.
[21] KURMAEV E Z, VAN EK J, EDERER D L, ZHOU L, CALLCOTT T A, PERERA R C C, CHERKASHENKO V M, SHAMIN S N, TROFIMOVA V A, BARTKOWSKI S, NEUMANN M, FUJIMORI A, MOLOSHAG V P. Experimental and theoretical investigation of the electronic structure of transition metal sulphides: CuS, FeS2 and FeCuS2 [J]. Journal of Physics-Condensed Matter, 1998, 10: 1687-1697.
[22] EDELBRO R, SANDSTROM A, PAUL J. Full potential calculations on the electron bandstructures of sphalerite, pyrite and chalcopyrite [J]. Applied Surface Science, 2003, 206: 300-313.
[23] HACKL R P, DREISINGER D B, PETERS E, KING J A. Passivation of chalcopyrite during oxidative leaching in sulfate media [J]. Hydrometallurgy, 1995, 39: 25-48.
[24] BALAZ P, KUPKA D, BASTL Z, ACHIMOVICOVA M. Combined chemical and bacterial leaching of ultrafine ground chalcopyrite [J]. Hydrometallurgy, 1996, 42: 237-244.
[25] PAYNE M C, TETER M P, ALLAN D C, ARIAS T A, JOANNOPULOS J D. Iterative minimization techniques for ab initio total-energy calculations: Molecular dynamics and conjugate gradients [J]. Reviews of Modern Physics, 1992, 62: 1045-1097.
[26] FRANCIS G P, PAYNE M C. Finite basis set corrections to total energy pseudopotential calculations [J]. Journal of Physics- Condensed Matter, 1990, 2: 4395-4404.
[27] HOHENBERG P, KOHN W. Inhomogeneous electron gas [J]. Physical Review, 1964, 136: 864-871.
[28] SEGALL M D, LINDAN P J D, PROBERT M J, PICKARD C J, HASNIP P J, CLARK S J, PAYNE M C. First-principles simulation: Ideas, illustrations and the CASTEP code [J]. Journal of Physics-Condensed Matter, 2002, 14: 2717-2744.
[29] KRESSE G, JOUBERT D. From ultrasoft pseudopotentials to the projector augmented-wave method [J]. Physical Review B, 1999, 59: 1758-1775.
[30] PERDEW J P, CHEVARY J A, VOSKO S H, JACKSON K A, PEDERSON M R, SINGH D J, FIOLHAIS C F. Atoms, molecules, solids, and surfaces: Applications of the generalized gradient approximation for exchange and correlation [J]. Physical Review B, 1992, 46: 6671-6687.
[31] PERDEW J P, BURKE K, ERNZERHOF M. Generalized gradient approximation made simple [J]. Physical Review Letters, 1996, 77: 3865-3868.
[32] PERDEW J P, ZUNGER A. Self-interaction correction to density-functional approximations for many-electron systems [J]. Physical Review B, 1981, 23: 5048-5079.
[33] GOVIND N, PETERSEN M, FITZGERALD G, KING-SMITH D, ANDZELM J. A generalized synchronous transit method for transition state location [J]. Computational Materials Science, 2003, 28: 250-258.
[34] TODD E C, SHERMAN D M, PURTON J A. Surface oxidation of pyrite under ambient atmospheric and aqueous (pH=2 to 10) conditions: Electronic structure and mineralogy from X-ray absorption spectroscopy [J]. Geochimica et Cosmochimica Acta, 2003, 67: 881-893.
[35] MIKHLIN Y, TOMASHEVICH Y, TAUSON V, VYALIKH D, MOLODTSOV S, SZARGAN R. A comparative X-ray absorption near-edge structure study of bornite, Cu5FeS4, and chalcopyrite, CuFeS2 [J]. Journal of Electron Spectroscopy and Related Phenomena, 2005, 142: 83-88.
���������˾�˧������������ ��
����������ѧ ������Դ����ѧԺ������ 650093
ժ Ҫ��ͨ��XRD�ⶨ��ͭ����ľ���������������ͭ��ᾧ�������ڲ�ԭ�����й���ͨ��������ѧ���Է�����ָ����ͭ������ԥ���ֱ��渻��������AFM��û�ͭ��������ά�۽ṹ����ͼ�ͱ�������Ʒֲ���ά����ͼ��AFM�������Խ����������ͭ�����ԭ�ӵ�����ͺ��������뾧���ڲ���ȷ����˺ܴ�仯�������ϣ�ͭ��������ԭ�������ԭ����λ�÷���λ�ƣ��������˱����ԥ����ԥ�Ľ��ʹ����ԭ��λ�ڱ���������������ϣ�AFMͼ����ʾԭ�Ӽ������淢���ع����ع��Ľ��ʹ�ò�������������ԭ�ӿ������γ�ԭ�Ӿۼ��塣���û����ܶȷ������۵���������ƽ�沨�������Ʒ������ӽ��������ܽ�Ϲ����ݶȽ�����ʽ���Ծ��������Ż������������(001)�����ԭ���Ų���ò���������ԭ����Z���������ƣ�ͭ�����������������ӣ�����������ͣ����淢����ԥ������ṹ�����ع������ֱ����ԥ���ع����µĸ������Ͳ������ԭ�Ӿۼ��Ը�ѡ������ҪӰ�졣
�ؼ��ʣ���ͭ�����ԥ���ع����������
(Edited by Sai-qian YUAN)
Foundation item: Project (u0837602) supported by the Key Program of the National Natural Science Foundation of China; Project (2010J056) supported by the Natural Science Foundation of Education Department of Yunnan Province, China; Projects (2009113, 2011464) supported by the Analysis and Testing Foundation of Kunming University of Science and Technology; Project (41118011) supported by the Excellent Doctoral Dissertation to Cultivate Foundation of Kunming University of Science and Technology
Corresponding author: Shu-ming WEN; Tel/Fax: +86-871-5153408; E-mail: shmwen@126.com
DOI: 10.1016/S1003-6326(13)62531-5

