J. Cent. South Univ. Technol. (2007)03-0404-04
DOI: 10.1007/s11771-007-0079-z

Approach to minish scattering of results for split Hopkinson pressure bar test
LI Xi-bing(李夕兵)1, ZHOU Zi-long(周子龙)1, ZHAO Yang-sheng(赵阳升)2
(1. School of Resources and Safety Engineering, Central South University, Changsha 410083, China;
2. Mining Technology Institute, Taiyuan University of Technology, Taiyuan 030024, China)
Abstract: Split Hopkinson pressure bar(SHPB) apparatus, usually used for testing behavior of material in median and high strain-rate, is now widely used in the study of rock dynamic constitutive relation, damage evolvement mechanism and energy consumption. However, the possible reasons of sampling disturbance, machining error and so on often lead to the scattering of test results, and bring ultimate difficulty for forming general test conclusion. Based on the stochastic finite element method, the uncertain parameters of specimen density ρs, specimen radius Rs, specimen elastic modulus Es and specimen length Ls in the data processing of SHPB test were considered, and the correlation between the parameters and the test results was analyzed. The results show that the specimen radius Rs has direct correlation with the test result, improving the accuracy in preparing and measuring of specimen is an effective way to improve the accuracy of test and minish the scattering of results for SHPB test.
Key words: split Hopkinson pressure bar test; data scattering; stochastic finite element method(SFEM)
1 Introduction
With the requirement of increasing safety sense and the precision for projects, the behavior of rock under dynamic loading has gained great attention in many fields, such as exploration, rock fragmentation, military defense and rock-burst. In recent years, deep-mining projects also cry for the dynamic characteristics and parameters of rock[1-5]. So the split Hopkinson pressure bar(SHPB) equipment, conventionally used only for metal experiments, is improved constantly and imported to carry out the dynamic test of rock. At the same time, the test precision problems stemming from inhomogeneity and brittle characteristics of rock have been researched. In order to get the constitutive relation under approximately constant strain rate loading, lots of work has been done by changing the loading waveform and improving data processing methods[6-11]. But the stochastic of specimen parameters brings great challenges to drawing general conclusions from tests all the time.
As we all know, in addition to the diversity of water-content and constituent, there are lots of micro-cracks in rock. All these features lead to the stochastic of rock properties in nature, and they make it very hard to get identical results in rock tests even with the same testing condition.
Based on stochastic finite element method(SFEM), the relevance between the stochastic of the input parameters for the data processing in SHPB test and the output result was analyzed, so as to find the main factors in the input parameters, which cause the stochastic of the output results.
2 Establishment of finite element model
LS-DYNA, as a nonlinear three-dimensional finite element code for dynamic analysis, has been developed by the United States National Laboratory of Lawrence Livermore. It has been successfully applied to the analysis for large displacement, large rotation and large strain problems. It was also used for simulation and analysis in this study.
The established model is made up of input bar, output bar and specimen, as shown in Fig.1. For the constitutive relation of the bar has no influence on the analysis in the study, the material of input bar and output bar was elastic. The specimen was modeled with ideal elastic-plastic material constitutive. Here the brittle material like rock was not used so as to avoid unexpected breakdown of simulation. The parameters of the model and the material are listed in Table 1.
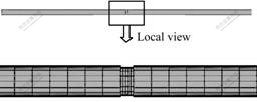
Fig.1 Finite element model and meshing
Table 1 Properties of elastic bars and specimen
3 Analysis with stochastic finite element method
3.1 Selection of parameters for SFEM analysis
Usually, the ratio of length to diameter of specimen, the parallelism of the end of specimen and the loading waveform are all the factors affecting the precision of the test results of SHPB test. In this paper, however, only the data processing formulas were analyzed to find a new way to improve the precision of the test results. Formulas (1)-(4) give out the data processing system for SHPB test. When tests are carried out on the same equipment of SHPB, the parameters of ρe, Ce, Re and Ee can be treated as invariables. The parameters of ρs, Rs, Es, and Ls, however, are stochastic caused by machining and the interior inhomogeneity, so they are determined to be the stochastic input parameters for analysis.
 (1)
(1)
 (2)
(2)
Δt=Ls/Cs (3)
 (i=e, s) (4)
where σi(t), σr(t), σt(t) are incident, reflected, and transmitted pulse respectively; ρe, Ce, Re and Ee are density, ultra-sonic velocity, radius and elastic modulus of elastic bars, respectively; ρs, Cs, Rs, Es and Ls are density, sonic velocity, radius, elastic modulus and length of specimen, respectively; Δt is the consumed time for stress pulse spreading through the specimen.
In order to get along with the laboratory experiments and meet the demand of projects, the selected parameters should be understood and expressed easily, so the dynamic strength of specimen was selected to investigate the influence of the stochastic of the input parameters bringing to the output parameter.
3.2 Determination of stochastic parameters
The determination of the distribution functions is the first thing to study the stochastic of parameters. The distribution functions of parameters ρ, E, R and L for materials including rock have been widely studied, and most of the conclusions show that normal distribution or logarithmic normal distribution describes their distribution well[12-15]. In order to improve the sampling efficiency of SFEM, the truncated normal distribution functions(Fig.2) were used to carry out analysis[16].
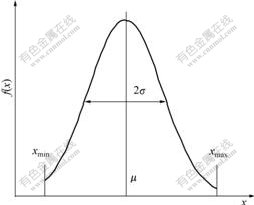
Fig.2 Density function of truncated normal distribution
The selected numerical characteristics of the truncated normal distribution for analysis are listed in Table 2.
Table 2 Input parameters for SFEM analysis
3.3 Stratified sampling Monte-Carlo simulation method
The Monte-Carlo simulation method is the most common for a probabilistic analysis. This method lets you simulate how virtual components behave the way they are built. The stratified sampling Monte-Carlo method is developed from the traditional method, which has the characteristics of high sampling efficiency, quick convergence speed, and being independent of stochastic variables[16]. The fundamental principle can be expressed as
 (5)
(5)
 (6)
(6)
 (7)
(7)
where Pf is the structural failure probability or safety probability;  is the safety probability with the stratified sampling Monte-Carlo method; f(ri) is the probability density function of the stochastic variable.
The field of integration G(X)<0 is divided into M mutually exclusive subintervals Lj, and then, Nj uniform distributed random vectors r are selected in every subinterval, where Nj equals the frequency that the uniform distributed random vector falls into the interval of [0,1].
3.4 SFEM simulation and results
With the stratified sampling Monte-Carlo method mentioned above, 256 points were sampled for the stochastic variables. Then the simulation was run on the 264MB RAM computer for 18 h. The LS-DYNA can give out the scatter diagrams between the input variables and the output variables automatically, at the same time, the correlation coefficients were given out. Figs.3-6 show the scatter diagrams between the density, elastic modulus, radius, length of specimen and the output variable.
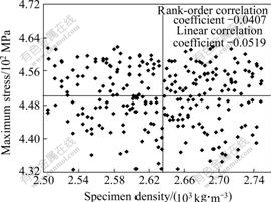
Fig.3 Scatter diagram of relation between specimen density and peak stress
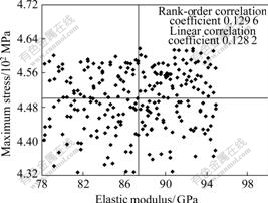
Fig.4 Scatter diagram of relation between specimen elastic modulus and peak stress
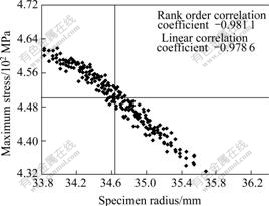
Fig.5 Scatter diagram of relation between specimen radius and peak stress
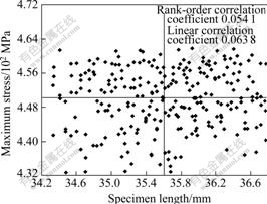
Fig.6 Scatter diagram of relation between specimen length and peak stress
It can be seen from Figs.3-6, the linear correlation coefficients between the density, elastic modulus, radius, length of specimen and the peak stress are -0.051 9, 0.128 2, -0.978 6 and 0.063 8, respectively, and their rank-order correlation coefficients are -0.040 7, 0.129 6, -0.981 1 and 0.054 1, respectively.
It can be seen that the radius of specimen has the direct correlation with the result, here is the peak stress of specimen, while the elastic modulus of specimen has little correlation with the result, the density and length of specimen almost have no correlation with the result, that is, the stochastic change of the radius of specimen will affect the test result largely. So attention must be paid to improve the machining accuracy in specimen sampling, to eliminate the measurement error in measuring. Only in this way can the scattering of the test results be reduced, then to find general laws from experiment.
4 Verification with test results
In order to verify the simulation results with SFEM, 10 specimens were sampled from the same rock block. The average strain rate was 30 s-1. The measured specimen parameters are listed in Table 3, and the test results are shown in Fig.7.
Table 3 Properties of specimen
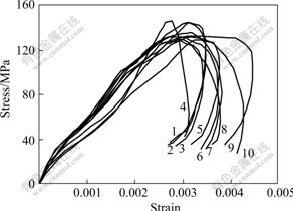
Fig.7 Stress―strain curves of different specimens
From Table 3 and Fig.7, it can be seen that, the specimens 3, 5, 7, 9 and 10, with the same diameter and different lengths, have the same strength of 130 MPa. The specimens 1 and 2, with the nearly the same parameters, have almost the same result curves. The specimens 1 and 7, with the same length and different diameters, have different strengths. Thus the test results also show that the specimen radius or diameter has large correlation with the test results in SHPB dynamic tests of rock. So it is key to ensure that the specimens of the same group have the same diameter in order to reduce the scatter of test results.
5 Conclusions
1) Among the variables of rock dynamic tests on SHPB set-up, the stochastic change of specimen radius has great influence on the scattering of test results, while the stochastic changes of elastic modulus, density and length of specimen have little influence.
2) In order to reduce the scattering of test results, it is an effective way to ensure that the specimens of the same group have the same radius through improving the machining accuracy and measuring accuracy.
References
[1] LI Xi-bing, GU De-sheng. Rock Impact Dynamics[M]. Changsha: Central South University of Technology Press, 1994. (in Chinese)
[2] LU F Y, CHEN W, FREW D J. The SHPB design of soft materials[J]. Explosion and shock waves, 2002, 22(1): 15-19. (in Chinese)
[3] LI Xi-bing, GU De-sheng, LAI Hai-hui. On the reasonable loading stress waveforms determined by dynamic stress-strain curves of rocks by SHPB[J]. Explosion and Shock Waves, 1993, 13(2): 125-130. (in Chinese)
[4] ZHAO Han, G?RARD G. On the use of SHPB techniques to determine the dynamic behavior of materials in the range of small strains[J]. Int J Solids Struct, 1996, 33(23): 3363-3375.
[5] LI Q M, MENG H. About the dynamic strength enhancement of concrete-like materials in a split Hopkinson pressure bar test[J]. Int J Solids Struct, 2003, 40(2): 343-360.
[6] LI Zhou-hua, LAMBROS J. Determination of the dynamic response of brittle composites by the use of the split Hopkinson pressure bar[J]. Composites Science and Technology, 1999, 59(7): 1097-1107.
[7] LI X B, LOK T S, ZHAO J, et al. Oscillation elimination in the Hopkinson bar apparatus and resultant complete dynamic stress strain curves for rocks[J]. Int J Rock Mech Min Sci, 2000, 37(7): 1055-1060.
[8] LOK T S, LI X B, LIU D, et al. Testing and response of large diameter brittle materials subjected to high stain rate[J]. ASCE, Journal of Materials in Civil Engineering, 2002, 14(3): 262-269.
[9] WANG Lu-ming, ZHAO Jian, HUA An-zen, et al. Research on SHPB testing technique for brittle material[J]. Chinese Journal of Rock Mechanics and Engineering, 2003, 22(11): 1798-1802. (in Chinese)
[10] LI X B, LOK T S, ZHAO J, et al. Dynamic characteristics of granite subjected to intermediate loading rate[J]. Rock Mech & Rock Engineering, 2005, 38(1): 1-19.
[11] BUSSAC M N, COLLET P, GARY G, et al. An optimization method for separating and rebuilding one-dimensional dispersive waves from multi-point measurements, application to elastic or viscoelastic bars[J]. J Mech Phys Solids, 2002, 50(2): 321-349.
[12] YAN Chun-feng, s\XU Jian. The Probabilistic Model of Rock Strength and its Application[M]. Chongqing: Chongqing University Press, 1999. (in Chinese)
[13] IMAN R L, CONOVER W J. Small sample sensitivity analysis techniques for computer model, with an application to risk assessment[J]. Communications in Statistics, 1980, A9(17): 1749-1842.
[14] ZHAO Guo-fan, JIN Wei-liang, GONG Jin-xin. The Reliability Theory for Structures[M]. Beijing: China Architecture & Building Press, 2000. (in Chinese)
[15] MURALHA J. The influence of mechanical and geometrical variability in rock mass deformability[J]. Int J Rock Mech Min Sci, 1997, 34(3/4): 699-707.
[16] HALLQUIST J O. LS-DYNA Theoretical Manual[M]. California: Livemore Software Technology Co., 1998.
(Edited by LI Xiang-qun)
Foundation item: Projects(50490274, 50534030) supported by the National Natural Science Foundation of China; Project supported by the Natural Science Foundatin of Hunan Province, China
Received date: 2006-05-24; Accepted date: 2006-07-21
Corresponding author: LI Xi-bing, Professor; Tel: +86-731- 8836450; E-mail: xbli@mail.csu.edu.cn

