����������û���������Ԥ��
��Դ�ڿ����й���ɫ����ѧ��(Ӣ�İ�)2021���3��
�������ߣ������� ���ﻪ �� ���� �ﶰ��
����ҳ�룺779 - 791
Key words��interaction mechanism; multi-crack initiation criterion; initiation prediction; multiple cracks; stress intensity factor
ժ Ҫ�����ø��亯���ͻ��ַ������������ƽ��б���Ƶ����I�ͺ�II��Ӧ��ǿ������KI,kmax(��)��KII,kmax(��) (0��<��<360��) ���������λ��(������ֱ����ˮƽ���)�ı仯ֵ����������������û��������õ�Ӧ��ǿ�����ӵ�ǿ�����������������������-��Ӧ��ǿ�����ӱȣ����������������оݣ���Ԥ���������ѽǡ����Ѻ��غ����ѻ�����Ԥ�������������������ѻ���ΪI�ͣ�Ϊ����ֹ�ѣ�������֮��Ĵ�ֱ���˵������ư볤�ı�����Ԥ�����뵥��ѹ������ƽ�����Ƶĺ�ɰ���������Լ��������ǺϽϺã���֤���������������Ч�ԡ�
Abstract: The maximum Mode I and Mode II stress intensity factors (SIFs), KI,kmax(��) and KII,kmax(��) (0��<��<360��), of inclined parallel multi-crack varying with relative positions (including horizontal and vertical spacings) are calculated by the complex function and integration method to analyze their interacting mechanism and determine the strengthening and weakening zone of SIFs. The multi-crack initiation criterion is established based on the ratio of maximum tension-shear SIF to predict crack initiation angle, load, and mechanism. The results show that multi-crack always initiates in Mode I and the vertical spacing is better not to be times of half crack-length for crack-arrest, which is in good agreement with test results of the red-sandstone cube specimens with three parallel cracks under uniaxial compression. This can prove the validity of the multi-crack initiation criterion.
Trans. Nonferrous Met. Soc. China 31(2021) 779-791
Qing-qing SHEN, Qiu-hua RAO, Zhuo LI, Wei YI, Dong-liang SUN
School of Civil Engineering, Central South University, Changsha 410075, China
Received 10 January 2020; accepted 26 December 2020
Abstract: The maximum Mode I and Mode II stress intensity factors (SIFs), KI,kmax(��) and KII,kmax(��) (0��<��<360��), of inclined parallel multi-crack varying with relative positions (including horizontal and vertical spacings) are calculated by the complex function and integration method to analyze their interacting mechanism and determine the strengthening and weakening zone of SIFs. The multi-crack initiation criterion is established based on the ratio of maximum tension-shear SIF to predict crack initiation angle, load, and mechanism. The results show that multi-crack always initiates in Mode I and the vertical spacing is better not to be times of half crack-length for crack-arrest, which is in good agreement with test results of the red-sandstone cube specimens with three parallel cracks under uniaxial compression. This can prove the validity of the multi-crack initiation criterion.
Key words: interaction mechanism; multi-crack initiation criterion; initiation prediction; multiple cracks; stress intensity factor
1 Introduction
In rock mass engineering, arbitrary cracks and joints existing in natural rocks usually initiate and propagate, and result in failure. Fracture failure is one of the most serious and harmful disasters. Research of multiple cracks interaction has become a hot issue and attracted more and more attention.
Currently, there are mainly two research methods for multiple cracks interaction: experimental and theoretical study. Uniaxial and biaxial compression tests have been adopted to study the effect of crack geometric parameters on stress and failure mode. Results showed that more secondary cracks occur when the vertical and horizontal spacings of double cracks are small under uniaxial compression loading [1]. The crack initiation stress is obviously lower than the peak strength when the inclined angle of double cracks with respect to the horizontal line was larger than 45�� [2,3]. When the inclined angle of the five parallel cracks is about 25��, the compressive strength reaches its minimum value [4,5]. In addition, the extension trajectory of cracks could be recorded by either naked eyes [6,7] or digital speckle correlation method (DSCM) and acoustic emission (AE) techniques [8-10] during tests. Results showed that the failure modes could be classified as five basic modes: tensile failure through the crack origin plane, tensile failure along the crack plane, shear failure along the crack plane, mixed-mode failure, and splitting failure, depending on the geometric parameters of nine equal-length parallel cracks. Also, the triaxial compression test was conducted to study the stress-strain curves of red sandstone samples with double cracks [11], but it is not convenient to observe the crack propagation process because the specimen was enclosed in a triaxial loading chamber. Due to the limit of experiments, the effects of multiple cracks geometric parameters on the initiation mechanism have not been systematically analyzed. Therefore, it��s necessary to seek the theoretical method for calculating stress intensity factor (SIF) and establishing a multi-crack fracture criterion.
Many researchers used different theoretical methods to calculate SIF of multiple cracks and study the interacting mechanism. For example, the boundary collocation method was used to calculate SIF of the single edge crack [12], the single central crack [13], and double edge cracks [14] in a finite two-dimensional plate. Complex variable method was adopted by BENTHEM and KOITER [15], and SNEDDON and LOWENGRUB [16] to solve some special multi-crack problems such as collinear, parallel, or star cracks. The pseudo-tension method is also widely applied. HORRI and NEMAT- NASSER [17,18] utilized the pseudo-tension method to calculate the SIF of double cracks and KACHANOV [19-21] simplified this method to estimate the SIF of double-crack by the superposition technique. Based on KACHANOV��s method, ZHU et al [22] investigated the interaction of two offset parallel cracks with different level intervals, vertical intervals, and crack lengths and indicated three kinds of interaction: reinforcing, shielding, and null. Besides, LI et al [23] improved the accuracy of KACHANOV��s method by only considering the effect of the linearly varying component (neglecting the non-uniform component). CHEUNG et al [24] adopted the Fredholm integral equation solution and weighted residual method to calculate the SIF of dual cracks. On the whole, current studies are mostly focused on the Mode I (KI(0)) and Mode II (KII(0)) SIFs of multiple cracks along the original crack plane. But multiple cracks do not always initiate and propagate in their original plane, e.g., the occurrence of wing cracks.
To understand the interaction mechanism of multiple cracks better, fracture criteria need to be established for predicting crack initiation. In classic fracture mechanics, there are mainly three types of mixed-mode fracture criteria: stress-based fracture criterion [25-27], strain-based fracture criterion [28], and energy-based fracture criterion [29-31], where the fracture mode (tensile or shear) is considered to be the same as the loading form. However, for brittle materials, the tensile strength is much smaller than its shear strength and thus the tensile (Mode I) fracture usually occurs even under pure shear loading. These fracture criteria can better predict Mode I fracture under arbitrary loading conditions (pure tensile, pure shear, and mixed-mode) but not the true shear (Mode II) fracture for brittle materials. Thus, a new fracture criterion of maximum tension-shear SIF ratio is proposed [32] to judge both Mode I and Mode II fracture of single crack for brittle materials. The criterion judges whether the crack is the tensile or shear failure by the ratio of maximum SIF at 360o along the crack tip. It is promising to be applicable to multiple cracks.
In this work, the maximum Mode I and Mode II SIFs, KI,kmax(��) and KII,kmax(��) (0��<��<360��), of inclined parallel multi-crack under uniaxial compression varying with the relative positions (including horizontal and vertical spacing) are calculated by the complex function and integration method to analyze their interacting mechanism, in order to determine strengthening and weakening zone of SIF. The initiation criterion of multi-crack is established based on the ratio of maximum tension-shear SIF for predicting the crack initiation (including initiation angle and load). Theoretical prediction results are verified by the uniaxial compression test of rock specimen with multi-crack.
2 Multiple cracks theory
2.1 SIF calculation formula of multiple cracks
Figure 1 shows an infinite plate of multiple cracks ( k=1, 2, ��, K) under uniform compressive and shear stresses at infinity 
 and
and  , let the tensile stress be positive and the compressive stress be negative). It is assumed that all cracks are non-closed. Set a global rectangular coordinate system (xoy) and a local rectangular coordinate system (xkokyk) at the centers of the kth crack (ok), where x axis is the horizontal direction and xk axis is along the direction of the kth crack. Let ak and ��k denote the half-length of the kth crack and the inclined angle with respect to the x axial. The anti-clockwise direction of ��k is defined to be positive.
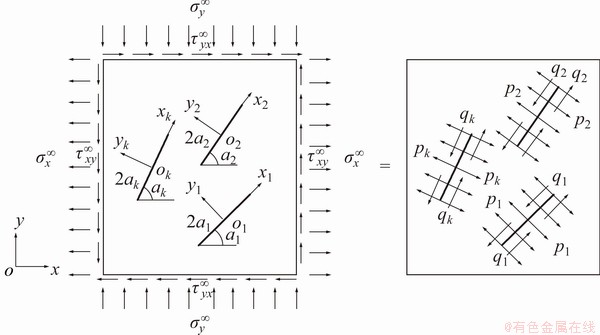
Fig. 1 Infinite plate containing k cracks
For SIF calculation of multi-crack, the remote uniform stresses (
 ) applied to the infinite plate of multi-crack can be equivalent to the uniform surface stresses (pk and qk) applied to each crack (Fig. 1):
 (1)
(1)
The actual normal and tangential stresses (Pk, Qk) existing on the surface of each crack are unknown, called as pseudo tractions [17,33]. The Pk and Qk can be regarded as the integration of the two pairs of self-balancing surface forces (P, Q), as shown in Fig. 2. In order to investigate the multi-crack interaction, it needs to first determine the normal and tangential tractions ( ,
,  ) of an arbitrary point z (z=x+iy) in any direction (angle ��), which is caused by two pairs of self-balancing surface forces (P, Q) at any point (s, 0) of a single crack, respectively.
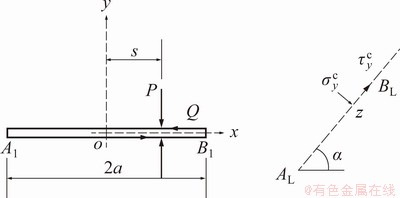
Fig. 2 Single crack under two pairs of self-balancing normal and tangential forces on crack surface
The stresses can be expressed in the form of the complex variable method as follows:
 (2)
(2)
The boundary condition is
 (3)
(3)
According to Muskhelishvili plane elastic mechanics solution [24], there are


 (4)
(4)
where

 (5)
(5)
When P=1 and Q=0, there is

 (6)
(6)
where fnn and fnt indicate the normal and tangential tractions of any point z in any direction (angle ��), caused by a pair of self-balancing unit normal forces (P=1) at any point (s, 0) on the crack surface, respectively.
When P=0 and Q=1, there is

 (7)
(7)
where ftn and ftt indicate the normal and tangential tractions of any point z in any direction (angle ��), caused by a pair of self-balancing unit normal forces (Q=1) at any point (s, 0) on the crack surface, respectively.
Considering the multi-crack interaction and superposition principle, the total normal and tangential stresses of any crack surface (k) are equal to the sum of Pk(sk) and Qk(sk) acting on the kth crack itself and additional pseudo tractions caused by Pl(sl) and Ql(sl) acting on the other crack surfaces (l��k). Therefore, the interacting surface normal and tangential stresses of any crack (Pk(sk) and Qk(sk)) can be calculated by solving the Fredholm integral equations [24]:


 (8)
(8)

 (9)
(9)
where pk(sk) and qk(sk) are obtained by Eq. (1).
The kernel function f can be calculated by Eqs. (6) and (7). Its subscript has a clear physical meaning, e.g., fnt,lk(sl, sk) means the effect of unit normal force at a point (sl, 0) of the lth crack on the normal force at a point (sk, 0) of the kth crack.
Mode I and Mode II SIFs of any crack ( k=1, 2, ��, K) on its original plane (��=0��) KI,k(0) and KII,k(0) can be determined by substituting Pk(sk) and Qk(sk) into the following equations [24] and making calculation program by Mathematica software:
 (10)
(10)
where the superscript ������ of K represents the left (+) and right (-) tips of the crack.
2.2 Initiation criterion of multiple cracks
For judging multi-crack initiation, it needs to calculate the interacting Mode I and Mode II SIFs of any crack (k=1, 2, ��, K) in any direction (0��<��<360��) based on the KI,k(0) and KII,k(0) on its original plane [32]:
 (11)
(11)
According to
 (12)
(12)
The maximum values of KI,k(0) and KII,k(0) at ��IC and ��IIC, KI,kmax(��) and KII,kmax(��), can be obtained, respectively.
According to the criterion of maximum tension-shear SIF ratio for the single crack [32], the multi-crack initiation criterion can be established by substituting the interacting SIF of multi-crack:
 (13)
(13)
where KIC and KIIC are Mode I and Mode II fracture toughnesses, respectively.
3 Calculation of three parallel cracks under uniaxial compression
3.1 Calculation model of three parallel cracks
Take the infinite plate of three equal-length (2a=30 mm) parallel cracks (��=45��) under remote uniform compressive stress as the calculation example. There are two cases for change of the horizontal and vertical spacings: (1) Fixing the lower crack A1B1 and the upper crack A3B3, moving the middle crack A2B2 (which is equivalent to the case of fixing the middle crack A2B2 and moving the lower crack A1B1 and the upper crack A3B3); (2) Fixing the lower crack A1B1 and the middle crack A2B2 and moving the upper crack A3B3 (which is equivalent to the case of fixing the upper crack A3B3 and moving the lower crack A1B1 and the middle crack A2B2). Let Ds and D��s denote the horizontal spacing (along the crack direction) of center-point connecting lines between A2B2 and A1B1, A3B3 and A1B1, respectively. Let Dh and D��h denote the vertical spacing (perpendicular to the crack direction) of center-point connecting lines between A2B2 and A1B1, A3B3 and A1B1, respectively. Effects of crack relative positions on interacting SIF are analyzed as follows.
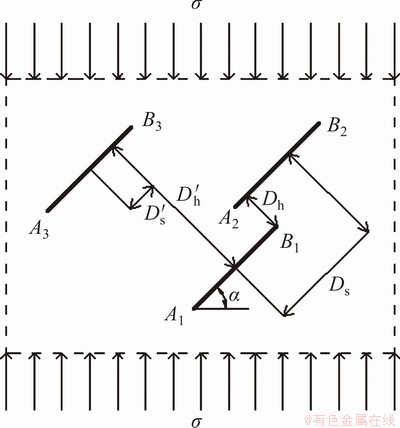
Fig. 3 Three parallel cracks
3.2 Effects of crack relative positions on interacting SIF
(1) Change of Ds
Let Dh=20 mm, D��h=40 mm, D��s=0 with only change of Ds (in term of Ds/a). Figure 4 illustrates the effects of Ds on the normalized Mode I and Mode II SIFs (in term of KI,kmax(��)/K0Imax(��) and KII,kmax(��)/K0IImax(��)) of each crack-tip for multi- crack. KI,kmax(��) and KII,kmax(��) are the maximum values of KI,k(0) and KII,k(0) at ��IC and ��IIC. K0Imax(��) and K0IImax(��) are the maximum values of Mode I and Mode II SIFs of the single crack with the same length (2a=30 mm) and inclined angle (��=45��), and they can be determined by the calculation method in Ref. [32]. Define KI,kmax(��)/K0Imax(��)<1 (or KII,kmax(��)/K0IImax(��)<1) as weakening-interaction, and KI,kmax(��)/K0Imax(��)>1 (or KII,kmax(��)/K0IImax(��)<1) as strengthening-interaction, and KI,kmax(��)/K0Imax(��)=1 (or KII,kmax(��)/K0IImax(��)=1) as non-interaction.
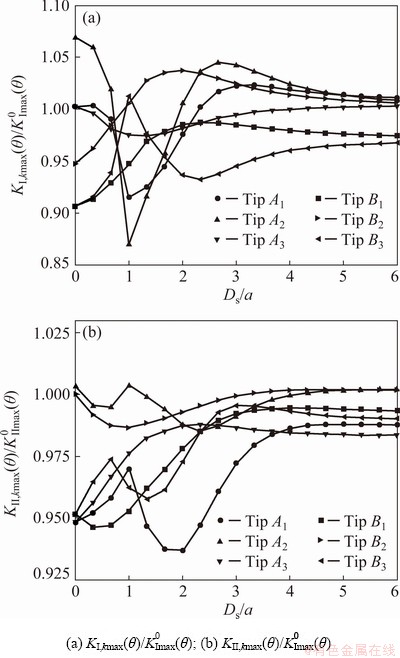
Fig. 4 Effects of horizontal spacing Ds on SIFs of all crack-tips
For the Mode I SIF, when Ds is 0 (central points of the three cracks are co-line), KI,kmax(��)/ K0Imax(��) of points A1 and A3 is equal to 1 and KI,kmax(��)/K0Imax(��) of point A2 is within 1.0-1.1, meaning that there is very few crack interaction. KI,kmax(��)/K0Imax(��) values of points A1, A2 and A3 are all decreased first when Ds/a is in the range of 0-1 (i.e., weakening-interaction of cracks is increased) and then increased for Ds/a larger than 1 (i.e., weakening-interaction of cracks is decreased). Finally, they tend to be stable values (KI,kmax(��)/ K0Imax(��)=1) when Ds/a becomes quite larger, i.e., the middle crack A2B2 is far away from the lower crack A1B1 and the upper crack A3B3 without any crack-interaction. Differently, KI,kmax(��)/K0Imax(��) of points B1, B2, and B3 is less than 1 when Ds/a is 0 (with weakening effect). It increases when Ds/a is less than 1 (i.e., weakening-interaction of cracks is decreased). Then, KI,kmax(��)/K0Imax(��) of points B1 and B2 increases and that of point B3 decreases (i.e., weakening-interaction of cracks is increased) for Ds/a larger than 1. Finally, it also tends to be stable value (KI,kmax(��)/K0Imax(��)����1) when Ds/a becomes quite larger.
For the Mode II SIF, KII,kmax(��)/K0IImax(��) values of all crack tips are nearly unchanged as Ds increases (KII,kmax(��)/K0IImax(��)=0.9-1). Furthermore, two crack-tips of each crack (A1 and B1, A2 and B2, A3 and B3) have almost the same values of KII,kmax(��)/K0IImax(��), because the moving of the middle crack A2B2 along the crack direction (i.e., the direction of shear stress) has little effect on the shear stress field. In addition, KII,kmax(��)/K0IImax(��) of points A1 and A3 is slightly smaller than 1 and that of point A2 is larger than 1 when Ds is 1. Therefore, the effect of Ds on Mode II SIFs of all crack tips could be neglected.
To sum up, when Ds changes, the strengthening zones of SIFs appear when the horizontal spacings are Ds/a=2.3-4.3 for the bottom crack (A1B1), Ds/a=1-4 for the middle crack (A2B2), and Ds/a=0.3-1 for the upper crack (A3B3), respectively. KI,kmax(��)/K0Imax(��) values of points A1, A2 and A3 are minimum when Ds/a is 1 (i.e., Ds/(2a)=0.5) and KI,kmax(��)/K0Imax(��) values of points B1, B2 and B3 have peak values when Ds/a is 2. This means that KI,kmax(��)/K0Imax(��) of all crack-tips reaches its maximum or minimum value when the horizontal spacing (Ds) is equal to times of half crack-length.
(2) Change of D��s
Let Dh=20 mm, D��h=40 mm and Ds=0 with only change of D��s (in term of D��s/a). Figure 5 illustrates the effects of D��s on the normalized Mode I and Mode II SIFs (in term of KI,kmax(��)/K0Imax(��) and KII,kmax(��)/K0IImax(��)) of each crack-tip.
For the Mode I SIF, KI,kmax(��)/K0Imax(��) values of points A1, A2 and A3 are nearly equal to 1 when D��s is 0, indicating that there is almost no crack-interaction. When D��s/a is in the range of 0-0.3, KI,kmax(��)/K0Imax(��) values of points A1, A2 and A3 all increase (i.e., strengthening-interaction of cracks is increased), and they decrease when D��s/a is in the range of 0.3-1. KI,kmax(��)/K0Imax(��) of points A1 and A3 increases and that of point A2 decreases for D��s/a larger than 1. Finally, the value tends to be stable (KI,kmax(��)/K0Imax(��)=1) when D��s/a becomes quite larger, i.e., the upper crack A3B3 is far away from both the lower crack A1B1 and the middle crack A2B2 without any crack-interaction. Differently, KI,kmax(��)/K0Imax(��) values of points B1, B2 and B3 are less than 1 (with weakening effect) when D��s is 0. They all increase when D��s/a is in the range of 0-1 (i.e., weakening-interaction of cracks is decreased). KI,kmax(��)/K0Imax(��) of points B1 and B3 increases and that of point B2 decreases (i.e., weakening-interaction of cracks is increased) for D��s/a greater than 1. Finally, it also tends to be stable value (KI,kmax(��)/K0Imax(��)����1) when D��s/a becomes quite larger.
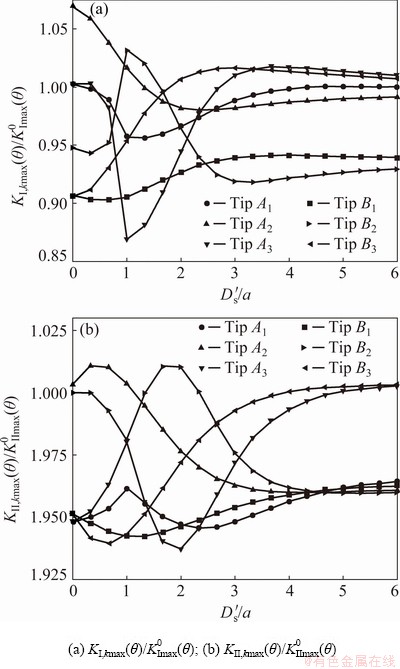
Fig. 5 Effects of horizontal spacing D��s on SIFs of all crack-tips
For the Mode II SIF, KII,kmax(��)/K0IImax(��) values of all crack tips are nearly unchanged as D��s increases (KII,kmax(��)/K0IImax(��)=0.9-1). Furthermore, two crack-tips of each crack (A1 and B1, A2 and B2, A3 and B3) have almost the same values of KII,kmax(��)/K0IImax(��), because the moving of the upper crack A3B3 along the crack direction (i.e., the direction of shear stress) has little effect on the shear stress field. In addition, KII,kmax(��)/K0IImax(��) of points B1, B2 and B3 is slightly less than 1 when D��s is 0. KII,kmax(��)/K0IImax(��) of points B1 and B3 is slightly less than 1 and that of point B2 is nearly equal to 1 when D��s/a is 0.3. Therefore, the effect of D��s on Mode II SIF of all crack tips could be neglected.
To sum up, KI,kmax(��)/K0Imax(��) and KII,kmax(��)/ K0IImax(��) of each crack always have a peak point when D��s/a is 1. By comparing Fig. 4 with Fig. 5, it is easy to find that the values of KII,kmax(��) of all cracks are all less than those of KI,kmax(��) whether the upper crack A3B3 moves or the middle crack A2B2 moves. It is indicated that Mode II fracture is hard to occur when the horizontal spacing (along the crack direction) of cracks varies.
(3) Change of Dh
Let Ds=0, D��s=0, D��h=40 mm with only change of Dh (in term of Dh/a). Figure 6 illustrates the effects of Dh on the normalized Mode I and Mode II SIFs of each crack-tip.
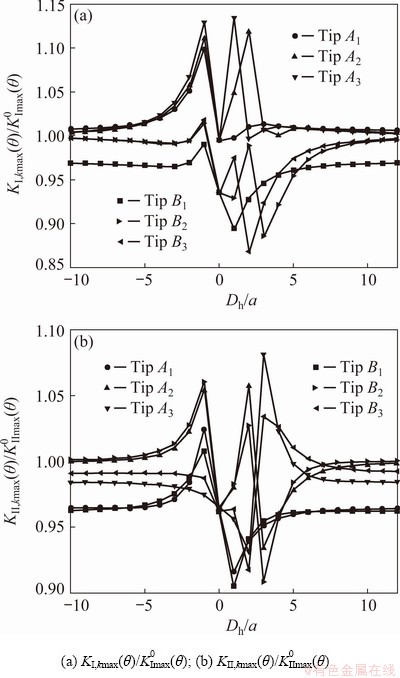
Fig. 6 Effects of vertical spacing Dh on SIFs of all crack-tips
For the Mode I SIF, all of the crack-tips A1, A2, A3 and B1, B2, B3 have similar tendencies with the change of Dh, since the three central points of the three cracks are always colinear and the effects on the two-tips of each crack are almost the same. Differently, KI,kmax(��)/K0Imax(��) values of points A1, A2, A3 are always larger than 1 (i.e., strengthening- interaction) while those of points B1, B2, B3 are always less than 1 (i.e., weakening-interaction). When Dh/a is less than -5, KI,kmax(��)/K0Imax(��) values of all crack tips tend to be stable, since the middle crack A2B2 is far away from the lower crack A1B1. When Dh/a is in the range from -5 to -1, they all increase, and when Dh/a varies from -1 to 0, they all decrease, because the middle crack A2B2 is gradually close to the lower crack A1B1. When Dh/a increases from 0 to 1, KI,kmax(��)/K0Imax(��) values of points A1, A2, A3 and B3 increase while those of points B1 and B2 decrease. When Dh/a is in the range of 1-2, KI,kmax(��)/K0Imax(��) values of points A1, A2, B1 and B2 increase while those of points A3 and B3 decrease. When Dh/a increases from 2 to 3, KI,kmax(��)/K0Imax(��) values of points A1, A3, B1 and B3 increase while those of points A2 and B2 decrease, because A2B2 begins to keep away from A1B1 and close to A3B3. KI,kmax(��)/K0Imax(��) values of all crack-tips also tend to be stable for Dh/a greater than 3, since the middle crack A2B2 is far away from the upper crack A3B3.
For the Mode II SIF, KII,kmax(��)/K0IImax(��) of cracks A1B1 and A2B2 nearly have the same fluctuation characteristics as KI,kmax(��)/K0Imax(��), but the crack A3B3 has different fluctuation characteristics of KII,kmax(��)/K0IImax(��). They all tend to be stable when Dh/a becomes quite larger. Furthermore, two crack-tips of each crack (A1 and B1, A2 and B2, A3 and B3) have almost the same values of KII,kmax(��)/K0IImax(��).
To sum up, when Dh changes, strengthening zones of SIFs appear when the vertical spacings (Dh/a) are in the range from -4 to -1 for the bottom (A1B1) and upper cracks (A3B3), and from -5 to -1 for the middle (A2B2) crack. Thus, the strengthening zone is from -4 to -1 for all cracks. When Dh/a is equal to 1 or -1, the SIFs of the crack tips have the peak values. KI,kmax(��)/K0Imax(��) and KII,kmax(��)/ K0IImax(��) of both the cracks A2B2 and A3B3 reach the peak values (i.e., dangerous case) at Dh/a=2 and Dh/a=3, respectively, i.e., the interacting of multi- crack is the strongest when the vertical spacing is equal to times of half crack-length. The study of the strongest interacting zone is of great significance for cracking arrest in engineering.
(4) Change of D��h
Let Ds=0, D��s=0, Dh=20 mm with only change of D��h (in term of D��h/a). Figure 7 illustrates the effects of D��h on the normalized Mode I and Mode II SIFs of each crack-tip.
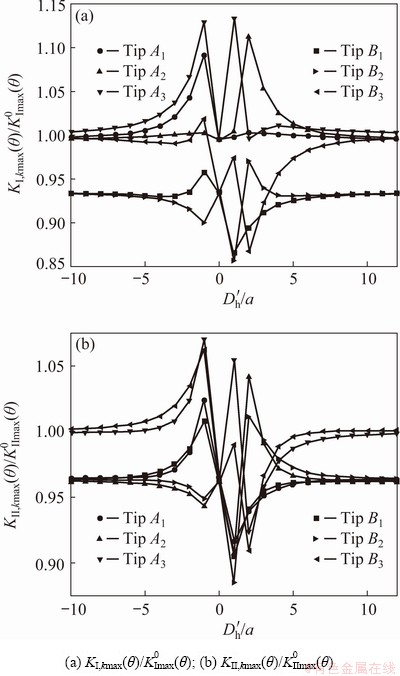
Fig. 7 Effects of vertical spacing D��h on SIFs of all crack-tips
For the Mode I SIF, all of the crack-tips A1, A2, A3, B1, B2 and B3 almost have similar tendencies with change of D��h. Differently, KI,kmax(��)/K0Imax(��) values of points A1, A2 and A3 are always larger than 1 (i.e., strengthening-interaction) while those of points B1, B2 and B3 are always less than 1 (i.e., weakening-interaction). When D��h/a is less than -4, KI,kmax(��)/K0Imax(��) values of all crack tips tend to be stable, since the upper crack A3B3 is far away from the lower crack A1B1. When D��h/a is in the range from -4 to -1, KI,kmax(��)/K0Imax(��) of point B2 decreases while that of all other points increases. When D��h/a varies from -1 to 0, KI,kmax(��)/K0Imax(��) of point B2 increases while that of all other points decreases. When D��h/a increases from 0 to 1, KI,kmax(��)/K0Imax(��) values of points A1, A2, A3 and B3 increase while those of points B1 and B2 decrease. When D��h/a is in the range from 1 to 2, KI,kmax(��)/K0Imax(��) values of points A1, A2, B1 and B2 increase while those of points A3 and B3 decrease. This is because when D��h/a varies from -4 to 0, the upper crack A3B3 is gradually close to the lower crack A1B1 and the middle crack A2B2. When D��h/a is 0, the crack A3B3 coincides with the crack A1B1; when D��h/a is in the range of 0-2, A3B3 begins to keep away from A1B1 and close to A2B2. KI,kmax(��)/K0Imax(��) values of all crack-tips tend to be stable for D��h/a larger than 2.
For the Mode II SIF, the cracks A1B1 and A3B3 have the same fluctuation characteristics of KII,kmax(��)/K0IImax(��) as those of KI,kmax(��)/K0Imax(��), but the crack A2B2 has different fluctuation characteristics of KII,kmax(��)/K0IImax(��). They all tend to be stable when D��h/a becomes quite larger. Furthermore, two crack-tips of each crack have almost the same values of KII,kmax(��)/K0IImax(��).
To sum up, when D��h changes, strengthening zones of SIFs appear when the vertical spacings (D��h/a) are from -3 to -1 for the bottom crack (A1B1), from -3 to 2 for the middle crack (A2B2) and from -4 to 1 for the upper crack (A3B3). Thus, the strengthening zone of all cracks is D��h/a from -3 to -1. Therefore, the vertical spacing of multi-crack is better not to be times of half crack-length for crack-arrest. In addition, the values of KI,kmax(��) are always larger than those of KII,kmax(��) and therefore the tensile (Mode I) fracture is more likely to occur than the shear (Mode II) fracture. When Dh/a or D��h/a tends to zero (i.e., two cracks would coincide with each other), the value of SIF fluctuates greatly. It is indicated that the change of the multi-crack number would result in the fluctuation of SIF.
Figure 8 shows calculation results of KII(0) compared with those in Refs. [23,34]. They agree very well (with an error of less than 5%), indicating that Eq. (10) is valid and feasible.
3.3 Initiation prediction of three parallel cracks
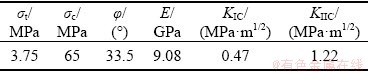
For predicting the initiation parameters of the three equal-length (2a=20 mm) parallel cracks (��=45��) in the infinite plate under remote uniform compressive stresses, red sandstone was adopted as rock material and its basic mechanical parameters are listed in Table 1, including compressive strength ��c, tensile strength ��t, elastic modulus E, Mode I and Mode II fracture toughness KIC and KIIC.
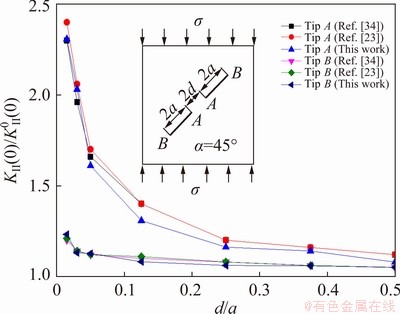
Fig. 8 Normalized KII(0) versus d/a
Table 1 Mechanical parameters of red sandstone
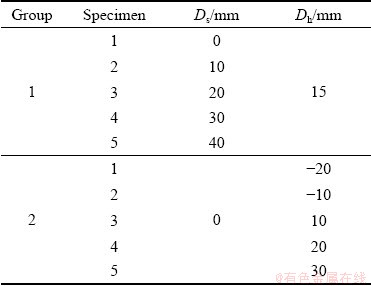
Based on the analytic results (i.e., the interaction among cracks is related to times of half crack-length), two groups of three-crack relative position parameters were selected for predicting initiation (Table 2). In the first group, D��s (D��s=0), Dh (Dh=15 mm), and D��h (D��h=30 mm) are unchanged and Ds is equal to times of half crack-length (a=10 mm). In the second group, Ds (Ds=0), D��s (D��s=0) and D��h (D��h=30 mm) are unchanged and Dh is equal to times of half crack-length (a=10 mm).
Table 2 Relative positions of three parallel cracks (D��s=0, D��h=30 mm, ��=45��)
Take Specimen 1 in Group 1 as an example for illustrating how to predict the crack initiation. Firstly, Mode I and Mode II SIFs of each crack-tip were calculated by Eq. (10), and these SIFs were substituted into Eq. (13) to obtain the initiation load, initiation angle, and fracture mechanism of each crack-tip. And then, the actual initiation tip (A2) can be determined according to the minimum initiation load of the crack-tip (Table 3). The prediction results of all specimens are listed in Table 4. It is seen that the initiation load is changed less with the increase of the Ds/a and the initiation mechanism of multi-crack is Mode I.
Table 3 Prediction results of initiation parameters of Specimen 1 in Group 1
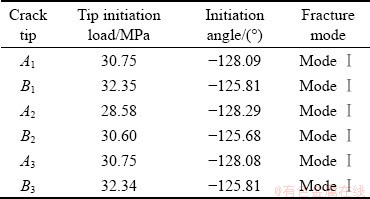
Table 4 Prediction results of multi-crack initiation parameters

4 Test verification
4.1 Test arrangement
The red sandstone from Wuding County, Chuxiong city of Yunnan province, China, was chosen as rock material. Its basic mechanical parameters are given in Table 1.
The DNS100 electro-hydraulic servo universal testing machine (Fig. 9(a)) was adopted for the uniaxial compression test with a maximum loading force of 1000 kN. The displacement loading rate was 0.1 mm/s. During the tests, stress-strain curves of all specimens were recorded for determining the crack initiation load. After the tests, fracture trajectories of all specimens were analyzed to obtain the multi-crack initiation angle. Figure 9(b) shows a cuboid specimen (100 mm �� 100 mm �� 20 mm) with three equal-length (2a=20 mm) parallel cracks (��=45��). The relative positions of the three cracks are given in Table 2.
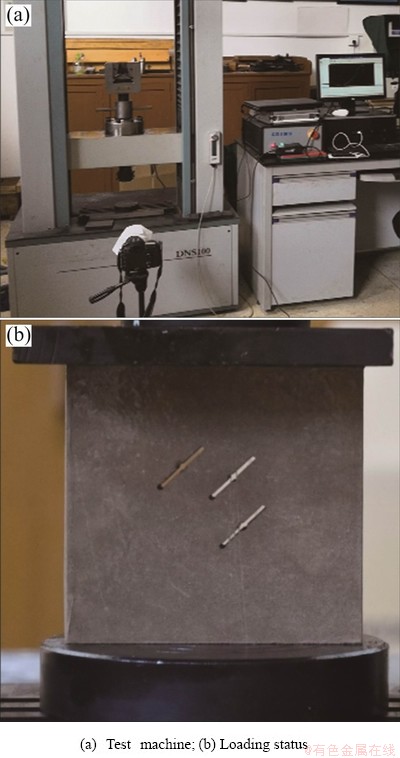
Fig. 9 Uniaxial compression test
4.2 Results and analysis
Figure 10 shows the stress-strain curve of Specimen 1 as an example. It is divided into four stages (which is consistent with Refs. [35,36]): initial compaction (OA, where the slope is gradually increased), linear elastic deformation (AB, where the slope is constant), nonlinear deformation (BC, where the slope is gradually decreased) and post- peak failure (CD). The crack initiation load can be determined by the distinguishing point (B) of linear elastic deformation and nonlinear deformation.
Fracture trajectories of the red sandstone specimens are shown in Figs. 11 and 12. It can be found that the cracks first initiate at one crack tip, then propagate stably, and finally link up until failure. For example, the tip A2 of Specimen 1 initiates first, and then tips A1, B1, B2 and B3 begin to initiate. After that, the tips A2 and B3 are connected and finally the tips A1 and B2 are connected until failure. It is worth noting that the initiation of the secondary crack is accompanied by the propagation of main cracks, due to the redistribution of crack-tip stress caused by the initiation of the wing crack.
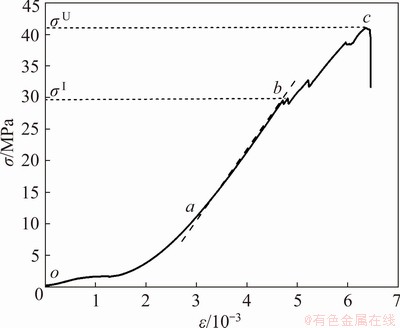
Fig. 10 Stress-strain curve of Specimen 1
Table 5 lists the test results of crack initiation parameters for all specimens. The fracture mechanism of all red sandstone specimens in uniaxial compressive is tensile (Mode I) fracture. By comparing Table 5 with Table 4, it can be concluded that the test results are in good agreement with the prediction results, which can verify the validity of the interacting mechanism and the multi-crack initiation criterion.
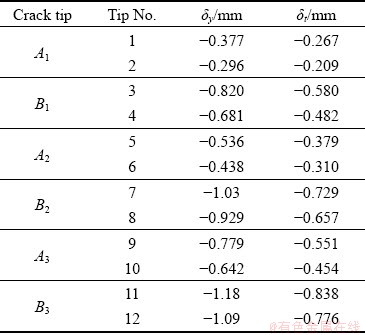
According to the displacement results of the finite element method, the initial open crack is still open under compression before the crack initiates (��=0). Take Specimen 1 in Group 1 (100 mm��100 mm��20 mm) with three equal-length parallel cracks (length 2a=20 mm and width t=1.5 mm) as example. Figure 13 shows nephogram of y-direction displacement (��y) at the peak stress ��U=40.97 MPa, where DMX and SMN are the maximum and minimum displacement. Table 6 lists ��y and its projected displacement (��t) onto vertical direction of the original crack (��t=��ysin45��) of each crack tip. It can be seen that all ��t ��t, indicating that the initial crack is still open before the crack initiates. Similar results can be also obtained from other rock specimens.
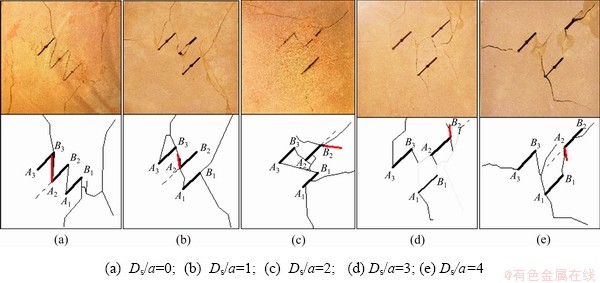
Fig. 11 Fracture trajectories of red sandstone specimens with different Ds
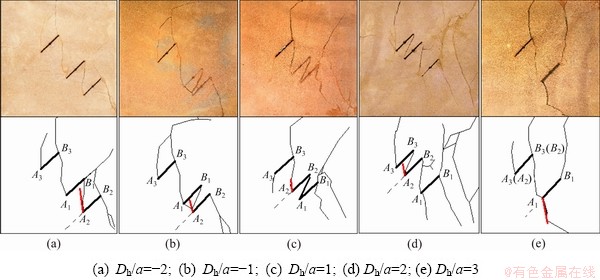
Fig. 12 Fracture trajectories of red sandstone specimens with different Dh
Table 5 Test results of crack initiation parameters for all specimens
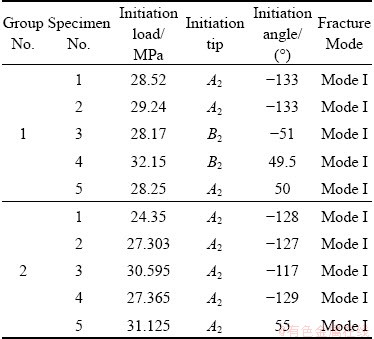
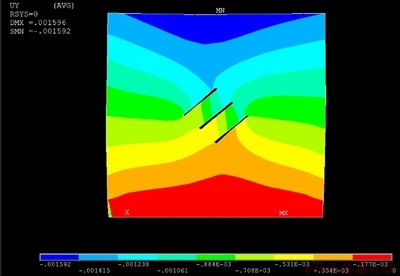
Fig. 13 Nephogram of y-direction displacement
Table 6 Displacement of each crack tip
5 Conclusions
(1) The maximum Mode I and Mode II SIFs KI,kmax(��) and KII,kmax(��) (0��<��<360��) of the inclined parallel multi-crack under uniaxial compression varying with the relative positions (including horizontal and vertical spacing) are calculated by the complex function and integration method to analyze their interacting mechanism. The accuracy of this method is validated by comparing the test results obtained with the approximate method and the Kachanov method.
(2) The multi-crack initiation criterion is established based on the ratio of maximum tension-shear SIF in order to predict the multi- crack initiation angle, load, and mechanism. It can provide a theoretical basis for safety assessment and crack-arrest design in rock mass engineering.
(3) The horizontal and vertical spacings have greater effect on KI,kmax(��) than on KII,kmax(��). The SIF strengthening zones of all cracks appear only when the vertical spacings are Dh/a from -4 to -1 and D��h/a from -3 to -1. It is better not to let the vertical spacing of multi-crack equal to times of half crack-length for avoiding the strengthening zone and possible fracture. The initiation load changes less with the increase of the Ds/a and the initiation mechanism of multi-crack is Mode I.
(4) The test results of the red-sandstone cube specimens with three parallel cracks under uniaxial compression agree well with the prediction results and can prove the validity of the multi-crack initiation criterion.
Acknowledgments
The authors are grateful for the financial supports from the National Natural Science Foundation of China (51874351, 51474251), Hunan Provincial Innovation Foundation For Postgraduate, China (CX2018B047), the Open Sharing Fund for the Large-scale Instruments and Equipments of Central South University, China (CSUZC201923).
References
[1] XU Jun, ZHENG Zhe-yuan, XIAO Xiao-chun, LI Zhao-xia. Crack propagation and coalescence due to dual non- penetrating surface flaws and their effect on the strength of rock-like material [J]. Journal of Geophysics and Engineering, 2018, 15: 938-951.
[2] YANG Sheng-qi. Crack coalescence behavior of brittle sandstone samples containing two coplanar fissures in the process of deformation failure [J]. Engineering Fracture Mechanics, 2011, 78: 3059-3081.
[3] YANG Sheng-qi, TIAN Wen-ling, HUANG Yan-hua, RANJITH P G, JU Yang. An experimental and numerical study on cracking behavior of brittle sandstone containing two non-coplanar fissures under uniaxial compression [J]. Rock Mechanics and Rock Engineering, 2016, 49: 1497-1515.
[4] CAO Ping, CAO Ri-hong, ZHAO Yan-lin, ZHANG Ke, PU Cheng-zhi, FAN Wen-cheng. Propagation-coalescence and rheologic fracture behavior of rock cracks [J]. The Chinese Journal of Nonferrous Metals, 2016, 26: 1737-1762. (in Chinese)
[5] ZHAO Yan-lin, WAN Wen, WANG Wei-jun, WANG Min, PENG Qing-yang. Fracture experiments on ordered multi-crack body in rock-like materials under uniaxial compression and numerical simulation of wing cracks [J]. Chinese Journal of Geotechnical Engineering, 2013, 35: 2097-2109. (in Chinese)
[6] YANG Xu-xu, JING Hong-wen, TANG Chun-an, YANG Sheng-qi. Effect of parallel joint interaction on mechanical behavior of jointed rock mass models [J]. International Journal of Rock Mechanics and Mining Sciences, 2017, 92: 40-53.
[7] SAGONG M, BOBET A. Coalescence of multiple flaws in a rock-model material in uniaxial compression [J]. International Journal of Rock Mechanics and Mining Sciences, 2002, 39: 229-241.
[8] CHEN Miao, YANG Sheng-qi, GAMAGE R P, YANG Wen-dong, YIN Peng-fei, ZHANG Yuan-chao, ZHANG Qiang-yong. Fracture processes of rock-like specimens containing nonpersistent fissures under uniaxial compression [J]. Energies, 2019, 12: 79.
[9] WONG L N Y, EINSTEIN H H. Crack coalescence in molded gypsum and carrara marble: Part 1. Macroscopic observations and interpretation [J]. Rock Mechanics and Rock Engineering, 2009a, 42: 475-511.
[10] WONG L N Y, EINSTEIN H H. Crack coalescence in molded gypsum and carrara marble: Part 2. Microscopic observations and interpretation [J]. Rock Mechanics and Rock Engineering, 2009b, 42: 513-545.
[11] XIAO Tao-li, LI Xin-ping, JIA Shan-po. Failure characteristics of rock with two pre-existing transfixion cracks under triaxial compression [J]. Chinese Journal of Rock Mechanics and Engineering, 2015, 34: 2455-2462. (in Chinese)
[12] WANG Y H, THAM L G, LEE P K K, TSUI Y. A boundary collection method for cracked plates [J]. Computers and Structures, 2003, 81(28-29): 2621-2630.
[13] KOBAYASHI A S, CHEREPY R D, KINSEL W C. A numerical procedure for estimating the stress intensity factor of a crack in a finite plate [J]. Journal of Fluids Engineering, 1964, 86: 681-684.
[14] CHEUNG Y K, WOO C W, WANG Y H. The stress intensity factor for a double edge cracked plate by boundary collocation method [J]. International Journal of Fracture, 1988, 37: 217-231.
[15] BENTHEM J P, KOITER W T. Asymptotic approximations to crack problems [M]. Leyden: Springer, Dordrecht, 1973: 131-178.
[16] SNEDDON I N, LOWENGRUB M. Crack problems in the classical theory of elasticity [M]. New York: Wiley, 1969: 713-751.
[17] HORII H, NEMAT-NASSER S. Compression-induced microcrack growth in brittle solids: Axial splitting and shear failure [J]. Journal of Geophysical Research, 1985, 90: 3105-3125.
[18] HORRII H, NEMAT-NASSER S. Elastic fields of interacting inhomogeneities [J]. International Journal of Solids and Structures, 1985, 21: 731-745.
[19] KACHANOV M. Effective elastic properties of cracked solids: Critical review of some basic concepts [J]. Applied Mechanics Reviews, 1992, 45: 304-335.
[20] KACHANOV M. Elastic solids with many cracks: A simple method of analysis [J]. International Journal of Solids and Structures, 1987, 23: 23-43.
[21] KACHANOV M. A simple technique of stress analysis in elastic solids with many cracks [J]. International Journal of Fracture, 1985, 28: 11-19.
[22] ZHU Di-jie, CHEN Zhong-hui, XI Jing-yi, YANG Deng-feng. Interaction between offset parallel cracks in rock [J]. Chinese Journal of Geotechnical Engineering, 2017, 39: 235-243. (in Chinese)
[23] LI Yin-ping, THAM L G, WANG Yuan-han, TSUI Y. A modified Kachanov method for analysis of solids with multiple cracks [J]. Engineering Fracture Mechanics, 2003, 70: 1115-1129.
[24] CHEUNG Y K, WOO C W, WANG Y H. A general method for multiple crack problems in a finite plate [J]. Computational Mechanics, 1992, 10: 335-343.
[25] ERDOGAN F, SIH G C. On the crack extension in plates under plane loading and transverse shear [J]. Journal of Basic Engineering, 1963, 85: 519-527.
[26] MAITI S K, SMITH R A. Comparison of the criteria for mixed mode brittle fracture based on the preinstability of stress-strain field. Part II: Pure shear and uniaxial compressive loading [J]. International Journal of Fracture, 1984, 24: 5-22.
[27] YU Mao-hong. Twin shear stress yield criterion [J]. International Journal of Mechanical Sciences, 1983, 25: 71-74.
[28] CHANG K J. On the maximum strain criterion��A new approach to the angled crack problem [J]. Engineering Fracture Mechanics, 1981, 14: 107-124.
[29] SIH G C. Strain energy density factor applied to mixed mode crack problems [J]. International Journal of Fracture, 1974, 10: 305-321.
[30] PALANISWAMY K, KNAUSS W G. Propagation of a crack under general in-plane tension [J]. International Journal of Fracture, 1972, 8: 114-117.
[31] SHEN Bao-tang, STEPHANSSON O. Modification of the G-criterion for crack propagation subjected to compression [J]. Engineering Fracture Mechanics, 1994, 47: 177-189.
[32] RAO Qiu-hua, SUN Zong-qi, STEPHANSSON O, LI Chun-lin, STILLBORG B. Shear fracture (Mode II) of brittle rock [J]. International Journal of Rock Mechanics and Mining Sciences, 2003, 40: 355-375.
[33] DENG H, NEMAT-NASSER S. Microcrack interaction and shear fault failure [J]. International Journal of Damage Mechanics, 1994, 3: 3-37.
[34] CHEN Yi-zhou. General case of multiple crack problems in an infinite plate [J]. Engineering Fracture Mechanics, 1984, 20: 591-598.
[35] LI Zhuo, RAO Qiu-hua, LI Peng, YI Wei. Crack initiation rate of brittle rock under thermal-hydro-mechanical coupling condition [J]. Transactions of Nonferrous Metals Society of China, 2018, 28: 2107-2113.
[36] YI Wei, RAO Qiu-hua, LI Zhuo, SHEN Qing-qing. A new measurement method of crack propagation rate for brittle rock under THMC coupling condition [J]. Transactions of Nonferrous Metals Society of China, 2019, 29: 1728-1736.
�����磬���ﻪ���� ���� �����ﶰ��
���ϴ�ѧ ��ľ����ѧԺ����ɳ 410075
ժ Ҫ�����ø��亯���ͻ��ַ������������ƽ��б���Ƶ����I�ͺ�II��Ӧ��ǿ������KI,kmax(��)��KII,kmax(��) (0��<��<360��) ���������λ��(������ֱ����ˮƽ���)�ı仯ֵ����������������û��������õ�Ӧ��ǿ�����ӵ�ǿ�����������������������-��Ӧ��ǿ�����ӱȣ����������������оݣ���Ԥ���������ѽǡ����Ѻ��غ����ѻ�����Ԥ�������������������ѻ���ΪI�ͣ�Ϊ����ֹ�ѣ�������֮��Ĵ�ֱ���˵������ư볤�ı�����Ԥ�����뵥��ѹ������ƽ�����Ƶĺ�ɰ���������Լ��������ǺϽϺã���֤���������������Ч�ԡ�
�ؼ��ʣ�����û����������������оݣ�����Ԥ�⣻�����ƣ�Ӧ��ǿ������
(Edited by Bing YANG)
Corresponding author: Qiu-hua RAO; Tel: +86-731-88876841; E-mail: raoqh@csu.edu.cn
DOI: 10.1016/S1003-6326(21)65538-3
1003-6326/ 2021 The Nonferrous Metals Society of China. Published by Elsevier Ltd & Science Press

