J. Cent. South Univ. Technol. (2011) 18: 848-853
DOI: 10.1007/s11771-011-0772-9
Simulation of pore scale fluid flow of granular ore media in heap leaching based on realistic model
YANG Bao-hua(杨保华)1,2, WU Ai-xiang(吴爱祥)2, YIN Sheng-hua(尹升华)2
1. Hunan International Economics University, Changsha 410205, China;
2. School of Civil and Environment Engineering, University of Science and Technology Beijing,
Beijing 100083, China
? Central South University Press and Springer-Verlag Berlin Heidelberg 2011
Abstract: Two-dimensional images of the granular ore media with different grain sizes were obtained from the X-ray computed tomography. Combined with the digital image processing and finite element techniques, the original grayscale images were transformed into the finite element models directly. By using these models, the simulations of pore scale fluid flow among particles were conducted with the COMSOL Multiphysics, and the distribution characteristics of fluid flow velocity and pressure were analyzed. The simulation results show that there exist obvious preferential flow and leaching blind zone in each granular medium. The flow velocity at pore throat is larger than that of pore body and the largest velocity reaches 0.22 m/s. The velocity decreases gradually from the center of pore throat and body to the surface of particles. The flow paths of granular media with larger grain size distribute equally, while the fluid flow velocities in most of areas of granular media with smaller grain size are lower, and some of them approach to zero, so the permeability is very low. There exist some pore clusters with different pressures, which is the basic reason for the uneven flow velocity distribution.
Key words: heap leaching; granular ore; fluid flow; image processing; computer simulation
1 Introduction
The granular ore in heap leaching is one kind of unconsolidated porous media composed of ore particles with different sizes and shapes. The structure of pores among particles is very complex and evolves continuously with the processing of leaching reaction. Such unstable pore structure necessarily causes the fluid flow paths changing constantly, so the rules of fluid flow are very complicated [1]. The traditional seepage flow theory mainly focused on the changes of some macro-parameters, such as porosity, saturation degree, permeability, but the fluid flow characteristics among particles were ignored [2-4]. However, to study the complex flow problems in heap leaching system, the effect of pore structure on fluid flow should be taken into account.
To understand the pore scale fluid flow rules in granular media during heap leaching, the prerequisite is to obtain the real pore geometry model through new experimental method and technology, and to do simulation based on it with effective numerical method. Previously, in the research fields of porous media, such as rock and soil, the geometry models used for simulation were generally established by the method of inhomogeneous medium description based on statistics or sometimes were drawn directly [5-10]. These models were feasible to some extent, but there may be large difference between the simulation results and the real situation. Hence, in this work, the X-ray CT technology was used to collect the images of granular ore media. Combined with the digital image processing and finite element technique [11], the original grayscale image was transformed into the finite element model, and then the simulation of pore scale fluid flow was conducted with the COMSOL Multiphysics software. The simulation based on the real physical model can reflect the flow rules more accurately. So, establishing the real physical model is a development trend for the simulation of different rules in heap leaching process in the future [12-15].
2 Experimental
2.1 CT scanning of granular ore media
The ore particles used in the experiment are the screened copper sulfide minerals, from Dexing Copper Mine in Jiangxi Province, China. Four samples S1, S2, S3 and S4 with different grain sizes, were selected for analysis and the corresponding grain sizes are 9-10 mm, 8-9 mm, 7-8 mm, and 6-7 mm, respectively. The leaching column used for installing ores is made of organic glass and its inner diameter is 60 mm. The ore samples were installed into the column according to their grain size, from smaller to larger. The CT machine used for scanning leaching column is spiral, SOMATOM Sensation 16. It combines multi-section images collecting technology, reconstruction technology and high speed of rotating as well. The images of 32 sections can be collected per second and can be displayed with spacial resolution of 0.35 mm×0.35 mm, so it can meet the requirement of images collection in this experiment. The CT scanner is shown in Fig.1 and the scanning results are shown in Fig.2.
2.2 Meshing and finite element model generation
The prerequisite of simulating pore scale fluid flow is to establish finite element model based on the grayscale image of granular ore media. The accuracy of simulation results depends on the accuracy of model directly. The model generation procedure includes several steps. Taking the image of ore sample S1 for example, firstly, the original image is cropped, as shown in Fig.3(a); then it needs to ascertain the boundary between particles and pores, which can be realized by thresholding and boundary extracting techniques, as shown in Fig.3(b) and Fig.3(c); thirdly, the obtained boundary image of pores is transformed into vectorgraph, as shown in Fig.3(d); lastly, the vectorgraph of pore structure is meshed and the finite element model is generated, as shown in Fig.4(a). Later, the model can be imported into the COMSOL Multiphysics to do pore scale fluid flow simulation. With the same way, the finite element models of other granular ore samples can be obtained, as shown in Fig.4(b), Fig.4(c), and Fig.4(d). The image processing, including cropping, thresholding, and meshing, were accomplished by MATLAB programming.
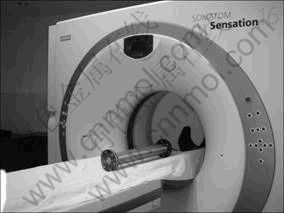
Fig.1 CT machine used for scanning leaching column
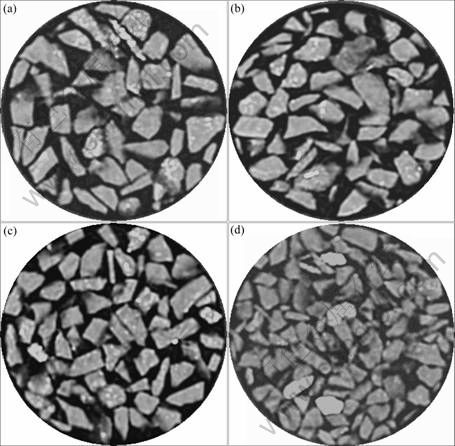
Fig.2 Two-dimensional images of four ore samples: (a) S1; (b) S2; (c) S3; (d) S4
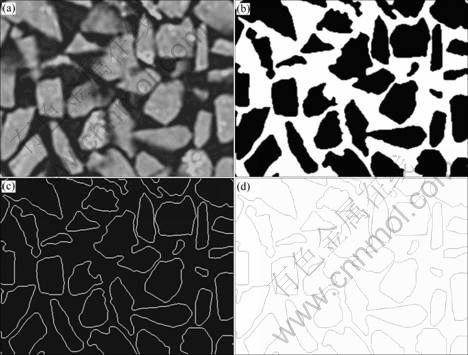
Fig.3 Vectorgraphs of pore structure of granular ore medium: (a) Original grayscale image; (b) Binary pore image; (c) Pore boundary image; (d) Pore vectorgraph
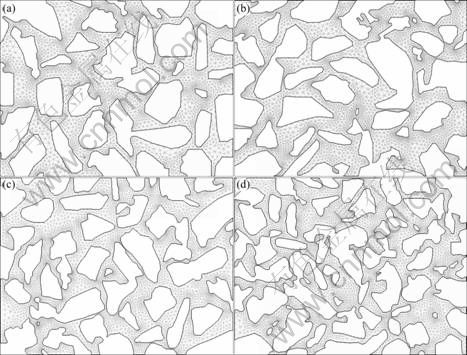
Fig.4 Finite element models of four granular ore samples: (a) S1; (b) S2; (c) S3; (d) S4
3 Simulation of pore scale fluid flow
3.1 Hypothesis
For simplifying the analysis process, the model needs the following hypothesis:
1) Fluid flow only occurs in the pores, so we just need to study the fluid in pores.
2) Ore particles, the skeleton of granular ore media in heap leaching, are considered with fixed location.
3) The fluid in the pores is considered as incompressible fluid and the temperature keeps constant; namely, the density and temperature of fluid during flowing process do not change.
4) Fluid flows under gravity from top to bottom, ignoring the capillary action.
5) The fluid is considered to be continuous, which means that there is no gap in fluid, such as air bubbles.
3.2 Continuity equation of fluid flow in pores of granular ore media
The momentum conservation equation of incompressible fluid can be described by the Navier-Stokes equation [16]. The change rate of fluid momentum with time equals the whole external forces acting on it:
 (1)
(1)
where the vector u is the velocity, p is the fluid pressure, ρ is the fluid density, η is the fluid viscosity and F is a vector of directional forces.
3.3 Calculation parameters and boundary conditions
For the above four models, the same boundary and initial conditions are applied, so the final results can be compared with each other. The parameters used in the model are listed in Table 1.
Table 1 Key parameters in fluid flow model
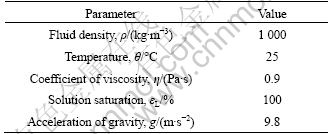
The physical model has top, bottom, left, right boundary and ore particle surface boundary. The left and right boundaries are not pervious and there is no slip in the model.
1) The bound water on the surface of ore particle almost does not flow, so
 (2)
(2)
2) The pressure that top and bottom boundary act on fluid is uniform, and
 (3)
(3)
 (4)
(4)
3) There is no transverse fluid flow at the left and right boundary, so
 (5)
(5)
where n is the normal unit vector. The above formula means that there is no velocity component in the direction perpendicular to boundary.
After the meshed model is imported into the COMSOL Multiphysics and the calculation parameter, boundary conditions and initial conditions are put into the computational model, the work of solving and post-processing can be done.
3.4 Simulation results and discussion
The cloud maps of velocity distribution, contour maps of velocity and cloud maps of pressure distribution of pore scale fluid flow of the above four samples are shown in Fig.5.
The cloud maps of fluid flow velocity distribution show that there is obvious preferential flow in each ore sample and the fluid flow mainly occurs in the connected pores across the whole model. For each model, there are some areas with fluid in static state, where flow velocity is nearly zero. This indicates that once the preferential flow emerges in the media, some zones with no fluid flowing are certain to form inevitably. These zones sometime are called leaching blind zone, where fluid cannot flow into the pores, except under the roles of capillary force, surface tension and osmotic pressure. In such a case, the solute can transfer only by diffusion, so the leaching rate is low. Moreover, the isograms of fluid flow velocity indicate that in the pore network, the flow velocity at pore throat is larger, while that of pore body is lower. The velocity decreases gradually from the center of pore throat and body to the surface of particles and near zero at the surface of ore particles.
By comparing the cloud maps of fluid flow distribution and the contour maps of flow velocity of the four models, for the ore sample with larger grain size, such as S1, the ratio of pore body size to pore throat size is lower, so the size of flow path is larger and distributes more evenly. As a result, the effect of preferential flow on the whole region is smaller. However, for the ore sample with smaller grain size, such as S4, except for preferential flow path, the flow velocity in most of pores are low, even zero in some area, where the effect of preferential flow on the whole leaching region is very large. The main reason is that the pore network of granular ore media with small grain size is very complicated. There are many tiny pore throats, which make the curvature of pore path increase. Except the preferential path, the resistance of fluid flow is large. As a result, the permeability of the media becomes poor.
From the contour map of flow velocity, it can be obtained that the maximum flow velocities of the fluid in pores of the four samples, S1, S2, S3, S4, are 0.220, 0.139, 0.166 and 0.211 m/s, respectively, and S1>S4> S3>S2; the minimum flow velocities are 5.64×10⁻³, 3.57×10⁻³, 4.24×10⁻³ and 5.41×10⁻³ m/s, respectively, and S1>S4>S3>S2. We can find that the order of the maximum flow velocity of the four samples is the same as the minimum one. Both the maximum and the minimum flow velocity of S1 are larger than those of the other samples. The maximum and the minimum flow velocities of sample S4 are the second in the ordering. The values of sample S3 and sample S4 are the third and the fourth. The ratio of the maximum flow velocity to the minimum one of each sample is about 39. So, the maximum and the minimum fluid flow velocities in the pores are not proportional to the grain size. However, they relate to the size of pore body and throat of preferential path, the ratio of them, and the topology of pore network, but the maximum flow velocity may occur at the smallest pore throat in the preferential flow.
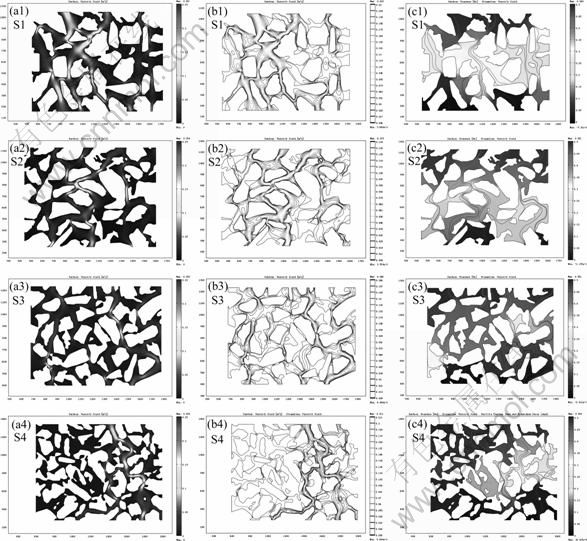
Fig.5 Simulation results of pore scale fluid flow in each ore sample: (a) Cloud map of fluid flow velocity; (b) Contour map of fluid flow velocity; (c) Cloud map of pressure distribution
The cloud maps of pressure distribution show that there are large differences in the inner pressure distribution in the four models, although the initial pressures at fluid entrance and exit are the same. The pressure at the smaller pore throat changes rapidly, which causes some pore clusters with different pressures. It is the basic reason for uneven flow velocity distribution.
4 Conclusions
1) Fluid flow mainly occurs in those connected pores across the whole media, forming obvious preferential flow. Except the preferential flow paths, the flow velocity in other areas is low and the fluid in some pores is static. This place is generally called leaching blind zone, where the leaching rate is very low.
2) The flow velocity at pore throat is larger than that of pore body. The maximum and the minimum fluid flow velocities in the pores are not proportional to the grain size, but relate to the sizes of pore body and throat of the preferential path and the topology of pore network.
3) The pressure at the smaller pore throat changes rapidly, which results in some pore clusters with different pressures. It is the basic reason for uneven flow velocity distribution.
4) By combining the digital image processing and finite element techniques, the finite element model of granular ore media is established directly based on the grayscale image obtained. It can facilitate the numerical simulation of flow and other processes, having broad application prospects.
References
[1] YANG Bao-hua, WU Ai-xiang, JIANG Huai-chun. Evolvement of permeability of ore granular media during heap leaching based on image analysis [J]. Transaction of Nonferrous Metals Society of China, 2008, 18(2): 426-431.
[2] CARIAGA E, CONCHA F, SEPULVEDA M. Flow through porous media with applications to heap leaching of copper ores [J]. Chemical Engineering Journal, 2005, 111(2): 151-165.
[3] BOUFFARD S C, DIXON D G. Investigative study into the hydrodynamics of heap leaching processes [J]. Metallurgical and Materials Transactions, 2001, 32(5): 763-776.
[4] LIU Jin-zhi, WU Ai-xiang. Study on the hydrodynamics of heap leaching process [J]. Mathematical Theory and Applications, 2006, 26(3): 123-125.
[5] Acharya R C, VAN DER ZEE S E A T M, LEIJNSE A. Approaches for modeling longitudinal dispersion in pore-networks [J]. Advances in Water Resources, 2007, 30(2): 261-272.
[6] CROSS M, BENNETT C R, CROFT T N, MCBRIDE D, GEBHARDT J E. Computational modeling of reactive multi-phase flows in porous media: Applications to metals extraction and environmental recovery processes [J]. Minerals Engineering, 2006, 19(10): 1098-1108.
[7] SHEIKHZADEH G A, MEHRABIAN M A, MANSOURI S H, SARRAFI A. Computational modeling of unsaturated flow of liquid in heap leaching―using the results of column tests to calibrate the model [J]. International Journal of Heat and Mass Transfer, 2005, 48(2): 279-292.
[8] MICHALIS V K, KALARAKIS A N, SKOURAS E D, BURGANOS V N. Mesoscopic modeling of flow and dispersion phenomena in fractured solids [J]. Computers & Mathematics with Applications, 2008, 55(7): 1525-1540.
[9] MOUSAVI S M, JAFARI A, YAGHMAEI S, VOSSOUGHI M, SARKOMAA P. Computer simulation of fluid motion in a porous bed using a volume of fluid method: Application in heap leaching [J]. Minerals Engineering, 2006, 19(4): 1077-1083.
[10] LIU Jian-jun, DAI Li-qiang, LI Shu-tie. Numerical simulation of microcosmic flow in porous media [J]. Journal of Liaoning Technical University, 2005, 24(5): 680-682.(in Chinese)
[11] TSAFNAT N, TSAFNAT G, JONES A S. Automated mineralogy using finite element analysis and X-ray microtomography [J]. Minerals Engineering, 2009, 22(2): 149-155.
[12] BOEK E S, VENTUROLI M. Lattice-Boltzmann studies of fluid flow in porous media with realistic rock geometries [J]. Computers & Mathematics with Applications, 2010, 59(7): 2305-2314.
[13] OVAYSI S, PIRI M. Direct pore-level modeling of incompressible fluid flow in porous media [J]. Journal of Computational Physics, 2010, 229(19): 7456-7476.
[14] VIDELA A R, LIN C L, MILLER J D. Simulation of saturated fluid flow in packed particle beds―The lattice-Boltzmann method for the calculation of permeability from XMT images [J]. Journal of the Chinese Institute of Chemical Engineers, 2008, 39(6): 117-128.
[15] ROBERTO M A, WILLIAMS R A, JIA Xiao-dong. Combining X-ray microtomography with computer simulation for analysis of granular and porous materials [J]. Particuology, 2010, 8(2): 81-99.
[16] KUTAY M E, AYDILEK A H, MASAD E. Laboratory validation of lattice Boltzmann method for modeling pore-scale flow in granular materials [J]. Computers and Geotechnics, 2006, 33(8): 381-395.
(Edited by YANG Bing)
Foundation item: Projects(50934002, 51074013) supported by the National Natural Science Foundation of China
Received date: 2010-07-19; Accepted date: 2010-11-25
Corresponding author: YANG Bao-hua, PhD; Tel: +86-10-62334680; E-mail: yangbaohuar2004@126.com

