950~1100 ��C�´���NaF����������Ķ���ѧ�о�
��Դ�ڿ����й���ɫ����ѧ��(Ӣ�İ�)2014���6��
�������ߣ�H. R. KARIMI ZARCHI M. SOLTANIEH M. R. ABOUTALEBI X. GUO
����ҳ�룺1959 - 1968
Key words��pack aluminizing; titanium aluminizing; aluminizing kinetics; titanium aluminides
ժ Ҫ�����¶�Ϊ950��1025��1100 ��C�������ɷ�Ϊ10%Al+5%NaF+85%Al2O3(��������)�������£��ڴ���������0~6 h������Ʒ�ϵ�����������˱���������ѧ�о���������������ͨ����������ɢ���������ʿ��Ʋ��衣ͨ������õ��������Ļ��Ϊ161.8 kJ/mol��ͨ��������м���Ʒ��������ķ�ѹԤ����Ʒ����������ء���950 ��C������Ԥ��ֵ��ʵ��ֵ�Ǻϵúܺã�����1025 ��C�� 1100 ��C������Ԥ��ֵ��ʵ��ֵ�ߡ�
Abstract: Pure titanium samples were aluminized at 950, 1025 and 1100 ��C for 0-6 h in a pack containing 10%Al+5%NaF+ 85%Al2O3 in mass fraction. The aluminized layers formed on the samples were characterized. The kinetic studies indicated that the diffusion of Al-bearing gases through the pack is the rate-controlling step in this process. The activation energy of 161.8 kJ/mol was calculated for this step. In addition, the mass gains of the aluminized samples were predicted using the partial pressures of gases in the pack and those adjacent to the samples surface. The predicted values are in good agreement with the experimental measurements at 950 ��C but are higher than those measured at 1025 and 1100 ��C.
Trans. Nonferrous Met. Soc. China 24(2014) 1959-1968
H. R. KARIMI ZARCHI1, M. SOLTANIEH1, M. R. ABOUTALEBI1, X. GUO2
1. Centre of Excellence for High Strength Alloys Technology, School of Metallurgy and Materials Engineering, Iran University of Science and Technology, Narmak, Tehran 168463114, Iran;
2. State Key Laboratory of Solidification Processing, Northwestern Polytechnical University, Xi��an 710072, China
Received 24 September 2013; accepted 23 December 2013
Abstract: Pure titanium samples were aluminized at 950, 1025 and 1100 ��C for 0-6 h in a pack containing 10%Al+5%NaF+ 85%Al2O3 in mass fraction. The aluminized layers formed on the samples were characterized. The kinetic studies indicated that the diffusion of Al-bearing gases through the pack is the rate-controlling step in this process. The activation energy of 161.8 kJ/mol was calculated for this step. In addition, the mass gains of the aluminized samples were predicted using the partial pressures of gases in the pack and those adjacent to the samples surface. The predicted values are in good agreement with the experimental measurements at 950 ��C but are higher than those measured at 1025 and 1100 ��C.
Key words: pack aluminizing; titanium aluminizing; aluminizing kinetics; titanium aluminides
1 Introduction
Titanium-based alloys have been recently studied in order to replace the nickel-based alloys due to their higher melting temperatures and nearly 45% (mass fraction) lower density [1,2]. Nevertheless, the lower oxidation resistance of these alloys in comparison with the nickel-based alloys is the main drawback due to the formation of a brittle and fragile TiO2 surface layer at temperatures higher than 600 ��C [3,4]. Aluminizing with a pack containing filler material (Al2O3), aluminum source (Al powder) and an activator (such as: NaF) is the conventional and industrial method for improving the oxidation problem [5,6]. Pack aluminizing enhances the oxidation resistance of titanium alloys by forming aluminide layers on their surfaces [7,8]. These layers are susceptible to Al2O3 formation in oxidative conditions. Contrary to the TiO2 layer, the Al2O3 layer is dense and adhesive to the surface, so it hinders the further oxidation progress in high temperatures [9].
Regardless of the type of the sample which is aluminized, four steps occur in the pack aluminizing processes. These steps include: 1) the formation of Al-bearing gases, 2) the transfer or diffusion of these gases from the pack to the sample surface, 3) the Al release from the reactions between these gases occurring on the sample surface, and 4) the final stage, i.e., the reaction between the released Al and the sample and then its inward diffusion [10,11]. The second step has been considered by many researchers as the rate-controlling stage in the kinetic studies of the pack aluminizing processes of pure nickel [10,12,13], nickel alloys [11], pure iron [14,15] and steels [16,17]. To the best of the authors' knowledge, there are no reported studies on the kinetics of pack aluminizing of pure titanium samples. Thus, in this study, the kinetics of pack aluminizing of pure titanium samples was investigated. A model based on the rate-controlling of both the second and third steps was developed and applied in the present work in order to investigate the kinetics of the NaF-activated pack aluminizing process of pure titanium samples. More precisely, the rate-controlling stage was determined for this process in addition to the calculation of the activation energy. Furthermore, based on the LEVINE and CAVES model [11], the mass gains of the pure titanium samples during this process were calculated by using the aluminum-containing gases pressures in the pack and those on the samples surfaces. Then, the calculated results were compared with the experimental measurements.
2 Kinetic models
2.1 Second step as rate-controlling stage
LEVINE and CAVES [11] were the first who considered the gases transfer (the second step) as the rate-controlling stage and developed a kinetic model for pack aluminizing of the IN-100 samples. The IN-100 is a nickel-based alloy which contains: 5.5% Al, 15.3% Co, 9.6% Cr, 3.2% Mo, 4.3% Ti, 0.9% V, 0.17% C, Ni balance (mass fraction). They applied packs containing pure Al powder and different activators including: NaX and NH4X (X is F, Cl, Br or I) in order to aluminize the IN-100 samples. Based on their model, an Al-depleted zone is formed in front of the IN-100 samples inside the pack, and the mass gain of the samples is controlled by the diffusion of the Al-bearing gases through this zone. This model was later modified and used by SEIGLE et al for pack aluminizing of commercially pure nickel [10,18] and Ni-Cr alloys [19]. As a result of their studies, a parabolic behavior was derived and suggested for the kinetics of the samples�� mass gain during pack aluminizing processes, in which the diffusion of the Al-bearing gases is the rate-controlling step [10,11,18]:
 (1)
(1)
where w is the increase of the sample mass; t the aluminizing time; k the growth rate constant; w0 the initial mass gain. It is worth noting that they derived Eq. (1) by integrating Eq. (2) over the boundary condition of w=w0 when t=0.
 (2)
(2)
In addition, LEVINE and CAVES suggested Eq. (3) in order to calculate the growth rate constant k [10,11,18]:

 (3)
(3)
where �� is the aluminum density in the pack; �� is the pack porosity; l is the pack tortuosity; mAl is the Al atomic mass; NAl is the rate of transport of Al; d is the diffusion distance of the Al-bearing gases; A is the surface area of the samples; Di is the diffusivities of the Al-bearing gases; pi and p��i are the equilibrium partial pressures of the Al-bearing gases inside the pack and adjacent to the samples surface respectively; R is the mole gas constant; T is the aluminizing temperature.
Furthermore, on the basis of model by LEVINE and CAVES [11], KANDASAMY et al [12,13] derived and calculated a kinetic model for the mass gain of pure nickel samples as a function of the amount of AlF3 activator in a pack containing 4% pure Al powder. Their results indicated that the same parabolic relationship (Eq. (1)) also governs the mass gain of the nickel samples, although the calculation of the growth rate constant k is much more complicated. Moreover, the amount of the activator in the pack plays a main role in determining the aluminizing kinetics. When a very small amount of the activator is used, all the activator reacts with the Al source to form gaseous species. Therefore, no condensed activator phase remains in the pack and the partial pressures of the gaseous species become strongly dependent on the initial amount of the activator. When the amount of the activator is increased, the consumption of the activator gets less pronounced and a condensed activator phase becomes stable in the pack at aluminizing temperature. The presence of a condensed activator phase regulates the vapor pressures of the gases. As a consequence, the partial pressures of the gases in the pack become independent of the amount of the activator used [12,13].
NCIRI and VANDENBULCKE [16,17] investigated the thermodynamics of NH4Cl-activated pack aluminizing of pure iron and various steels. Moreover, KUNG and RAPP [14,15] studied the kinetics of NaCl-activated pack aluminizing of pure iron under both argon and forming gas (5%H2+Ar) atmospheres at 900 ��C. The kinetic model that they developed and applied, did not deviate from those used by LEVINE and CAVES [11]. Their results also showed that the Al-bearing gases diffusion is the rate-controlling step in the pack aluminizing of pure iron and various steels.
2.2 Third step as rate-controlling stage
In the third step, the Al release from the Al-bearing gases controls the rate of aluminizing in the pack processes, then a linear kinetics (Eq. (4)) governs the samples mass gain [20]:
w=k��t+w0 (4)
where w is the mass gain; w0 is the initial mass gain; k�� is the linear growth rate constant; t is the aluminizing time. Eq. (4) is derived by the integration of Eq. (5) with the boundary condition of w=w0 when t=0:
 (5)
(5)
2.3 A mixture of the second and third steps as rate- controlling stages
When both of the second and the third steps have a portion in controlling the rate of aluminizing in the pack processes, Eq. (2) and Eq. (5) have to be added together (Eq. (6)) in order to find the time (dt) required for the mass increase (dw) of the treated samples. By integration of Eq. (6) over the boundary condition, the kinetic model (Eq. (7)) is obtained for this case [20].
 (6)
(6)
 (7)
(7)
In the above equations, k'mix and kmix are the linear growth rate constant and the parabolic growth rate constant in a case that the mixture of both the second and third steps controls the pack aluminizing processes.
3 Experimental
Pure titanium cubes (99.99%) with the dimensions of 8 mm��8 mm��10 mm were prepared and used in this work. The samples were ground up to 1000 grit emery paper, washed in acetone, ultrasonically cleaned in ethanol for 15 min and dried using a hairdryer. The dried specimens were then weighed by a balance with the precision of �� 0.001 g before the aluminizing process. A 100 g of powder mixture containing 10%Al-5%NaF- 85%Al2O3 was used as the aluminum-giving source for each run after being mixed up by tumbling in a ball mill for 4 h.
The samples were treated in a pack cementation system under argon atmosphere at temperatures of 950, 1025 and 1100 ��C. The system was heated up to the aluminizing temperatures in 1 h for each run and was held at those temperatures for 0-6 h.
After the aluminizing treatment, the samples were washed with water, ultrasonically cleaned in ethanol, dried and then weighed by a precise balance. They were sectioned and observed by an SEM. The thicknesses of the coating layers were measured from SEM images using Clemex Vision software. Further phases and chemical analyses were done using an XRD (Panalytical X��pert Pro) with Cu K�� radiation and an electron probe micro analyzer (EPMA). In addition, the required thermodynamic data were extracted from HSC chemistry software version 5.11.
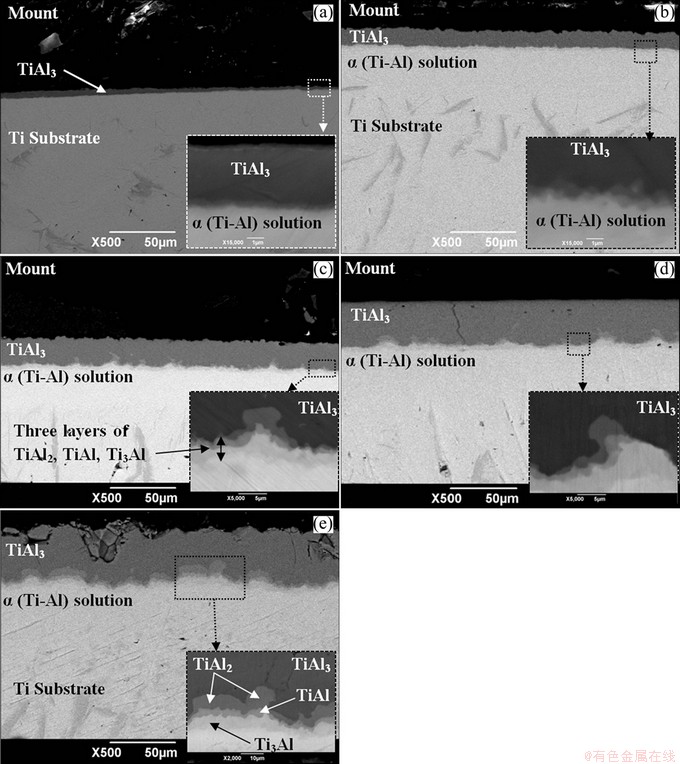
Fig. 1 Cross-sectional microstructures of aluminized titanium samples at 950 ��C for 0 h (a), 0.25 h (b), 1 h (c), 3 h (d), 6 h (e)
4 Results and discussion
4.1 Aluminizing results and microscopic observations
The cross-sectional microstructures of the aluminized samples at 950 ��C are shown in Fig. 1. Five layers of TiAl3, TiAl2, g-TiAl, ��2-Ti3Al and ��-Ti-Al solid solution were formed and observed on each samples aluminized at 950 ��C for time longer than 1 h. The three layers of TiAl2, ��-TiAl, ��2-Ti3Al were not observed on the samples treated in time shorter than 1 h (using the SEM with the maximum 15000 magnification). As shown in Fig. 1, two layers of TiAl3 and ��-Ti-Al solid solution were much thicker and constituted nearly the whole aluminized coatings. In addition, both the layers were thickened with increasing the treatment time. Further investigations showed the thicknesses of the three layers of TiAl2, ��-TiAl, ��2-Ti3Al were very uneven and vastly dependent on their growth orientations. The reason for thinner thicknesses of TiAl2, ��-TiAl, ��2-Ti3Al layers was attributed to much lower diffusion coefficients of Al and Ti elements in these layers in comparison with those of TiAl3 and ��-Ti-Al solid solution ones [20].
The cross-sectional microstructures of the samples treated at 1025 and 1100 ��C showed that the same five aluminide layers were formed on these samples. For the same as the previous aluminizing temperature, the thicknesses of the TiAl3 and ��-Ti-Al solid solution were much thicker in comparison with the TiAl2, ��-TiAl, ��2-Ti3Al layers. Moreover, although the ��-Ti-Al solid solution layer in samples treated at 1025 and 1100 ��C was grown and thickened with increasing the aluminizing time but a different behavior was observed for the TiAl3 layer. The microstructures of the treated titanium samples at 1100 ��C are shown in Fig. 2. As is seen, the TiAl3 layer started to decompose at time longer than 3 h; Nearly most of the TiAl3 layer was decomposed and its thickness reached 18 ��m when the aluminizing time was 6 h. Instead, ��-Ti-Al solid solution layer in this sample was grown to 278 ��m. The reason for the TiAl3 decomposition in these samples is related to the decrease in the rate of Al transfer from the pack due to the formation and growth of the Al-depleted zone. Since the rate of Al transferred to the samples surface is decreased gradually in the aluminizing process and on the other hand, the rate of outward diffusion of the Ti element is nearly unchanged; then the formed TiAl3 layer reacts with the Ti element in order to form the Ti-rich layers.
Figure 3 shows the mass gain versus aluminizing time. It can be clearly seen that the higher the aluminizing temperature or the longer the treatment time, the more the mass of the sample is increased. In other words, despite the fact that the aluminizing rate decreases gradually in a pack aluminizing process and causes some microstructural changes, but the masses of the treated titanium samples are permanently increased with prolonging the aluminizing time and/or elevating the treatment temperature.

Fig. 2 Cross-sectional microstructures of aluminized titanium samples at 1100 ��C for 0 h (a), 1 h (b), 3 h (c) and 6 h (d)

Fig. 3 Variation of mass gains of treated titanium samples versus aluminizing time and temperature
4.2 Kinetic investigation
4.2.1 Rate-controlling step
The pressure measurements in the pack aluminizing system showed when the temperature was around 450 ��C during the heating-up cycle, the NaF activator started to act. Further recordings indicated that the total pressure became nearly fixed in each test run when the system reached the aluminizing temperature. This proves that there are no prohibitions in the formation of the gaseous species and all the gases are formed shortly after the NaF activator reacts. Thus, the first step, i.e., the formation of the Al-bearing gases, does not control the pack aluminizing process of the pure titanium samples.
Moreover, the 4th step, i.e., the reaction between the released Al and the sample and then its inward diffusion, does not control the pack aluminizing process in this research work. It is clear when the 4th step is the rate-controlling stage, then a pure Al layer is expected to form on the treated samples surfaces. Because when the rate of the Al release and deposition on the samples surface is greater than the rate of the Al reaction and diffusion into the sample, then the excess Al is piled up on the samples surface and eventually a pure Al layer has to be formed. Since any pure Al layers were not formed on the treated titanium samples, it could be concluded that this step does not control the aluminizing process either.
In order to determine which stage among the second step (the Al-bearing gases diffusion) or the third step (the Al release from the Al-bearing gases on the samples surfaces) is controlling the rate of aluminizing in the present process, it is assumed that both steps had a contribution (Eq. (7)). Then, Eq. (7) was fitted to the measured mass gains of the aluminized titanium samples.
The fitting results are presented in Table 1. It can be seen that the value of the coefficient 1/k��mix is fixed at 0 for two temperatures of 950 and 1100 ��C. In addition, there is no reasonable relationship between the calculated 1/k��mix coefficients and the aluminizing temperatures. Therefore, the linear part of Eq. (7) has no contributions to the measured mass gains. Consequently, it can be concluded that the third step does not control the pack aluminizing process of the pure titanium samples.
Table 1 Fitting results of Eq. (7) to measured mass gains for each temperature

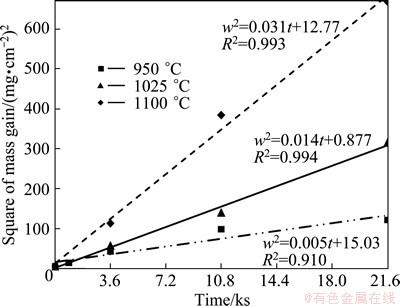
Fig. 4 Results of fitting parabolic equation (Eq. (1)) to measured mass gains of aluminized titanium samples

Fig. 5 Plot of natural logarithm of growth rate constants against inverse of aluminizing temperatures (Eq. (9))
On the other hand, the results of fitting Eq. (1) to the measured mass gains are shown in Fig. 4. It can be seen that nonzero values of 0.005, 0.014 and 0.031 mg2/(cm4��s) were calculated for the growth rate constants at 950, 1025 and 1100 ��C, respectively. Furthermore, the values of the growth rate constants are increased with increasing the aluminizing temperature due to their dependency on the temperature according to the Arrhenius equation:
k=k0exp[-Q/(RT)] (8)
In the above equation, k is the growth rate constant; Q is the activation energy; R is the universal gas constant; T is the aluminizing temperature. As a result, it is observed that there is a good fitness between Eq. (1) and the measured mass gains of the aluminized samples. Thus, it can be concluded that only the second step is controlling the process.
4.2.2 Activation energy calculation
Equation (9) is achieved by taking the logarithm of both sides of Eq. (8). This equation implies that if the natural logarithms of the calculated growth rate constants are plotted against the inverse of the absolute temperatures and a linear regression is used, then the activation energy can be calculated from the slope of the line.
ln k = ln k0-[Q/(RT)] (9)
The results of the activation energy calculation are shown in Fig. 5. The calculated activation energy for the Al-bearing gases diffusion is equal to 161.8 kJ/mol in the present pack aluminizing process of pure titanium samples. The researchers who carried out the kinetic studies in the Ti-Al system have reported the values of 20.7 to 237 kJ/mol (4.9 to 56.7 kcal/mol) [21] for the activation energies of different controlling stages in various synthesizing processes (Table 2). These values are related to either the diffusion stage in the solid TiAl3 layer or the reaction between titanium and aluminum elements. While the activation energy calculated in the present work is related to the diffusion phenomenon of the aluminum-containing gases through pack. Therefore, the calculated activation energy in this work and the reported values (Table 2) originate from different physical stages.
In addition, when the reported values of the activation energies in Table 2 are compared quantitatively with the calculated one in this work, it is easily understood that the calculated activation energy (161.8 kJ/mol) is relatively high and lies in the upper limit of the range of the reported activation energies. This indicates that the gases diffusion in the NaF-activated pack aluminizing is slower than either the reaction between titanium and aluminum or the diffusion in the solid titanium.
On the other hand, the activation energy for mass gain of the IN-100 samples in NaCl-activated aluminizing packs was calculated by using the growth rate constants reported by LEVINE and CAVES [11]. As a result, the value of 203.6 kJ/mol was attained. This value is also high and near to the calculated activation energy in this work (161.8 kJ/mol). Due to the fact that both activation energies are related to the diffusion of aluminum-bearing gases in the pack aluminizing processes, then the calculated activation energies are close.
Table 2 Summary of reported activation energies for different controlling stages in various synthesizing processes of Ti-Al intermetallics

4.2.3 Mass gain predictions
Up to now, the kinetic study was focused on the evaluation and analysis of the measured mass changes of the treated pure titanium samples. There still is another point of view for investigating the kinetics in the present work. That is the prediction of the growth rate constants for each temperature by the partial pressures of gases according to Eq. (3). When the growth rate constant (k) in each temperature is known, then it can be applied to calculation of mass gains of titanium samples by using Eq. (1). The following parameters were taken into account while using Eq. (3) in order to calculate the growth rate constant values in each temperature.
1) The values of 0.01 g/cm3, 0.79 and 4 were calculated and considered for the aluminum density of the pack (��), the pack porosity (��) and the pack tortuosity (l), respectively.
2) The diffusivities (Di) of different gases species were estimated using the Gilliland equation [32]. The molar volumes of the gases species at their normal boiling points required for the diffusivity calculations were estimated using the contribution group method suggested by SCHOTTE [33].
3) The equilibrium partial pressures of the gaseous species in the pack (pi) and adjacent to the titanium samples surfaces (p��i) required for the calculation of the growth rate constant (Eq. (3)) were computed from solving the sets of equations listed in Tables 3 and 4, respectively. The sets of equations were derived from the thermodynamic equilibrium conditions of the reactions occurring either in the pack or adjacent to the samples surfaces. Additional equations required in order to solve the sets were derived from the mass balances of the Na and F elements.
Table 3 Set of equations solved for extracting equilibrium partial pressures (pi) in pack

Table 4 Set of equations solved for extracting equilibrium partial pressures (p��i) adjacent to samples surface

4) The values of 4.93��10-1, 5.14��10-1 and 5.35��10-1 were calculated for the Al activities in the samples surface at 950, 1025 and 1100 ��C using the partial aluminum pressures measured by ECKERT et al [34] in the Ti-Al system. In addition, the values of 1.32��10-5, 4.47��10-5 and 1.10��10-4 were calculated for the Ti activities at these temperatures, respectively by using the Gibbs-Duhem equation [20].
The computed results for growth rate constants (k) are summarized in Table 5. In addition, the initial measured mass gains of the aluminized samples at various temperatures are also listed in this table. Now the mass gains of the titanium samples can be predicted according to Eq. (1). These predicted results are shown by curves in Fig. 6. Comparison of the experimental measurements with the calculated mass gains (Fig. 6) shows that the values of mass gains calculated at 950 ��C are in good agreement with the experimental measurements; but those values calculated at 1025 and 1100 ��C were much higher than those measured at these temperatures. These disagreements at temperatures 1025 and 1100 ��C do not originate from the non-validity of the Levine and Caves model, but also they originate from the parameters applied for the calculation of the growth rate constants at these temperatures. This is because the investigations in section 4.2.1 show the parabolic relationship (as a result of Levine and Caves model) is governing the time dependency of the mass gains of the titanium samples. As a result, the parameters including the Ti and Al activities and gases diffusivities may cause the overestimations of mass gains. If the values of Al activities of the samples surfaces computed by thermodynamic data presented by ECKERT et al [34] are lower than the real activities, then they can cause the greater differences in the calculated partial pressures of AlF, AlF2, AlF3, Al2F6 and Al gases between the samples and the pack. As a consequence, it could be understood that the greater values of ��pi are achieved for the computation of the growth rate constants. Hence, the growth rate constants are overestimated and, as a consequence, the mass gains of the samples are calculated to be higher than the real values. Other possible reason for disagreements between measured and calculated mass gains at 1025 and 1100 ��C may return to errors in the calculations of gases diffusivities by using SCHOTTE [33] and GILLILAND [32] equations.
Table 5 Results of growth rate constant (k) calculations by using Eq. (3) at 950, 1025 and 1100 ��C
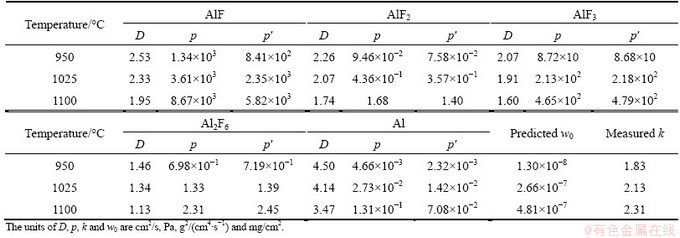
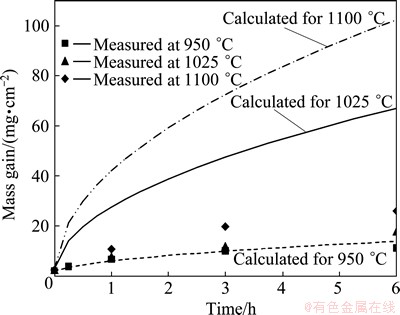
Fig. 6 Comparison of measured mass changes of treated titanium samples with those calculated by partial pressures of gases according to Eq. (3)
5 Conclusions
1) Pack aluminizing of pure titanium samples using 5%NaF+10%Al+85%Al2O3 powder mixture at various temperatures and aluminizing times resulted in the formation of a coating layer mainly composed of TiAl3 intermetallic phase and an ��-Ti-Al solid solution. Three very thin layers of TiAl2, TiAl and Ti3Al were formed and observed between the TiAl3 and ��-Ti-Al solid solution phases.
2) The kinetic investigations indicated that the diffusion of the Al-bearing gases is the rate-controlling step in the NaF-activated pack aluminizing process of pure titanium samples.
3) The value of 161.8 kJ/mol (38.7 kcal/mol) was calculated for the activation energy of the rate-controlling step in this process.
4) The mass gain calculations based on the partial pressures of gases (Levine and Caves model) conformed well to the values measured at 950 ��C. But they were higher than those measured at 1025 and 1100 ��C. These disagreements are not related to the non-validity of the model but also they are most likely due to the errors in the values of the Al and Ti activities as well as the gases diffusivities that were applied to the calculation of growth rate constants.
Acknowledgement
The authors would like to thank Mr. Xuan LI and Mr. Ping ZHANG from Northwestern Polytechnical University, China for experimental help. We are also grateful to Dr. Mostafa MIRJALILI from Ferdowsi University of Mashhad for great discussions.
References
[1] LEYENS C, PETERS M. Structure and properties of titanium and titanium alloys [M]. Wiley-VCH, 2003: 1-27.
[2] LUTJERING G, WILLIAM J C. Titanium [M]. Berlin and New York: Springer, 2003: 13-50.
[3] WANG De-qing, SHI Zi-yuan, TENG Ying-li. Microstructure and oxidation of hot-dip aluminized titanium at high temperature [J]. Applied Surface Science, 2005, 250(1-4): 238-246.
[4] QIAN Y H, LI M S, LU B. Isothermal oxidation behavior of Ti3Al-based alloy at 700-1000 ��C in air [J]. Transactions of Nonferrous Metals Society of China, 2009, 19(3): 525-529.
[5] KARIMI ZARCHI H R, SOLTANIEH M, ABOUTALEBI M R,GUO X. Thermodynamic study on pack aluminizing systems of pure titanium and nickel [J]. Transactions of Nonferrous Metals Society of China, 2013, 23(6): 1838-1846.
[6] ZHOU C G, XU H B, GONG S K. Study on aluminide coatings on TiAl alloys by pack cementation method [J]. Acta Metallurgica Sinica, 2000, 13(6): 1148-1154.
[7] ZHOU C, XU H, GONG S, YANG Y, YOUNG KIM K. A study on aluminide and Cr-modified aluminide coatings on TiAl alloys by pack cementation method [J]. Surface and Coatings Technology, 2000, 132(2-3): 117-123.
[8] ZHOU C, XU H, GONG S,YOUNG KIM K. A study of aluminide coatings on TiAl alloys by the pack cementation method [J]. Materials Science and Engineering A, 2003, 341(1-2): 169-173.
[9] GURRAPPA I,GOGIA A K. High performance coatings for titanium alloys to protect agaisnt oxidation [J]. Surface and Coatings Technology, 2001, 139(2-3): 216-221.
[10] GUPTA B K, SARKHEL A K, SEIGLE L L. On the kinetics of pack aluminization [J]. Thin Solid Films, 1976, 39: 313-320.
[11] LEVINE S R, CAVES R M. Thermodynamic and kinetics of pack aluminide coating formation on IN-100 [J]. Journal of the Electrochemical Society, 1974, 121(8): 1051-1064.
[12] KANDASAMY N, SEIGLE L L, PENNISI F J. The kinetics of gas transport in halide-activated aluminizing packs [J]. Thin Solid Films, 1981, 84(1): 17-27.
[13] KANDASAMY N. Erratum: The kinetics of gas transport in halide-activated aluminizing packs [J]. Thin Solid Films, 2006, 503(1-2): 277-278.
[14] KUNG S C, RAPP R A. Fundamental kinetic study of aluminization of iron by pack cementation at 900 ��C [J]. Surface and Coatings Technology, 1987, 32(1-4): 41-56.
[15] KUNG S C, RAPP R A. Kinetic study of aluminization of iron by using the pack cementation technique [J]. Journal of The Electrochemical Society, 1987, 135(3): 731-741.
[16] NCIRI B, VANDENBULCKE L. Thermodynamic study of the aluminizing of the iron and alloy steels by thermochemical technique [J]. Journal of the Less Common Metals, 1983, 95(1): 55-72.
[17] NCIRI B, VANDENBULCKE L. Theoretical and experimental study of the aluminization of iron and steel in the pack and in the gas phase [J]. Thin Solid Films, 1986, 139(3): 311-324.
[18] SIVAKUMAR R, SEIGLE L L. On the kinetics of the pack-aluminization process [J]. Metallurgical Transactions A, 1976, 7(8): 1073-1079.
[19] TU D C, SEIGLE L L. Kinetics of formation and microstructure of aluminide coatings on Ni-Cr alloys [J]. Thin Solid Films, 1982, 95(1): 47-56.
[20] KARIMI ZARCHI H R. Investigation of titanium aluminide synthesis by gas phase aluminizing [D]. Tehran: School of Metallurgy and Materials Engineering, Iran University of Science and Technology, 2013.
[21] MIRJALILI M. On the mechanism and kinetics of TiAl3 intermetallic compound formation in the Al-Ti diffusion couple [D]. Tehran: School of Metallurgy and Materials Engineering, Iran University of Science and Technology, 2013.
[22] MACKOWIAK J, SHREIR L L. Kinetics of the interaction of Ti(s) with Al(l) [J]. Journal of the Less-Common Metals, 1968, 15(3): 341-346.
[23] SUJATA M, BHARGAVA S, SUWAS S, SANGAL S. On kinetics of TiAl3 formation during reaction synthesis from solid Ti and liquid Al [J]. Journal of Materials Science Letters, 2001, 20(24): 2207-2209.
[24] WANG T, ZHANG J. Thermoanalytical and metallographical investigations on the synthesis of TiAl3 from elementary powders [J]. Materials Chemistry and Physics, 2006, 99(1): 20-25.
[25] TARDY J, TU K N. Solute effect of Cu on interdiffusion in Al3Ti compound films [J]. Physical Review B, 1985, 32(4): 2070-2081.
[26] ZHAO X A, SO F C T, NICOLET M A. TiAl3 formation by furnace annealing of Ti/Al bilayers and the effect of impurities [J]. Journal of Applied Physics, 1988, 63(8): 2800-2807.
[27] BRESOLIN C, PIROTTA S. TiAl3 formation kinetic in sputtered Ti/AlCu0.5% thin films [J]. Microelectronic Engineering, 2002, 64(1-4): 125-130.
[28] van LOO F J J, RIECK G D. Diffusion in the titanium-aluminium system��I. Interdiffusion between solid Al and Ti or Ti-Al alloys [J]. Acta Metallurgica, 1973, 21(1): 61-71.
[29] KRAL J, FERDINANDY M, LISKA D, DIKO P. Formation of TiAl3 layer on titanium alloys [J]. Materials Science and Engineering A, 1991, 140: 479-485.
[30] SHIMOZAKI T, OKINO T, YAMANE M, WAKAMATSU Y, ONISHI M. Effect of diffusion barrier and impurities in titanium on the growth rate of TiAl3 layer [J]. Defect and Diffusion Forum, 1997, 143-147: 591-596.
[31] NONAKA K, FUJII H, NAKAJIMA H. Effect of oxygen in titanium on reaction diffusion between Ti and Al [J]. Materials Transaction, 2001, 42(8): 1731-1740.
[32] CHEN N H, OTHMER D F. New generalized equation for gas diffusion coefficient [J]. Journal of Chemical & Engineering Data, 1962, 7(1): 37-41.
[33] SCHOTTE W. Prediction of the molar volume at the normal boiling point [J]. The Chemical Engineering Journal, 1992, 48(3): 167-172.
[34] ECKERT M, BENCZE L, KATH D, NICKEL H, HILPERT K. Thermodynamic activities in the alloys of the Ti-Al system [J]. Physical Chemistry Chemical Physics, 1996, 100(4): 418-424.
H. R. KARIMI ZARCHI1, M. SOLTANIEH1, M. R. ABOUTALEBI1, X. GUO2
1. Centre of Excellence for High Strength Alloys Technology, School of Metallurgy and Materials Engineering, Iran University of Science and Technology, Narmak, Tehran 168463114, Iran;
2. State Key Laboratory of Solidification Processing, Northwestern Polytechnical University, Xi��an 710072, China
ժ Ҫ�����¶�Ϊ950��1025��1100 ��C�������ɷ�Ϊ10%Al+5%NaF+85%Al2O3(��������)�������£��ڴ���������0~6 h������Ʒ�ϵ�����������˱���������ѧ�о���������������ͨ����������ɢ���������ʿ��Ʋ��衣ͨ������õ��������Ļ��Ϊ161.8 kJ/mol��ͨ��������м���Ʒ��������ķ�ѹԤ����Ʒ����������ء���950 ��C������Ԥ��ֵ��ʵ��ֵ�Ǻϵúܺã�����1025 ��C�� 1100 ��C������Ԥ��ֵ��ʵ��ֵ�ߡ�
�ؼ��ʣ���������������������������ѧ������������
(Edited by Hua YANG)
Corresponding author: H. R. KARIMI ZARCHI; Tel: +98-21-77240450; Fax: +98-21-77240480; E-mail: karimizarchi@iust.ac.ir
DOI: 10.1016/S1003-6326(14)63277-5

