Average cluster sizes and cluster size distributions of superfine nickel particles in light media
来源期刊:中南大学学报(英文版)2009年第3期
论文作者:李敬生 杜飞虎 王娟
文章页码:399 - 404
Key words:ionic concentration; average cluster sizes; cluster size distribution; power law
Abstract: Effects of shear rates on average cluster sizes (ACSs) and cluster size distributions (CSDs) in uni- and bi-systems of partly charged superfine nickel particles were investigated by Brownian dynamics, and clustering properties in these systems were compared with those in non-polar systems. The results show that the ACSs in bi-polar systems are larger than those in the non-polar systems. In uni-polar systems the behavior of clustering property differs: at the lower ionic concentration (10%), repulsive force is not strong enough to break clusters, but may greatly weaken them. The clusters are eventually cracked into smaller ones only when concentration of uni-polar charged particles is large enough. In this work, the ionic concentration is 20%. The relationship between ACS and shear rates follows power law in a exponent range of 0.176-0.276. This range is in a good agreement with the range of experimental data, but it is biased towards the lower limit slightly.
基金信息:the National Natural Science Foundation of China
the Natural Scientific Funds of Jiangsu Province, China
J. Cent. South Univ. Technol. (2009) 16: 0399-0404
DOI: 10.1007/s11771-009-0067-6
![]()
LI Jing-sheng(李敬生), DU Fei-hu(杜飞虎), WANG Juan(王 娟)
(School of Chemistry and Chemical Engineering, Jiangsu University, Zhenjiang 212013, China)
Abstract: Effects of shear rates on average cluster sizes (ACSs) and cluster size distributions (CSDs) in uni- and bi-systems of partly charged superfine nickel particles were investigated by Brownian dynamics, and clustering properties in these systems were compared with those in non-polar systems. The results show that the ACSs in bi-polar systems are larger than those in the non-polar systems. In uni-polar systems the behavior of clustering property differs: at the lower ionic concentration (10%), repulsive force is not strong enough to break clusters, but may greatly weaken them. The clusters are eventually cracked into smaller ones only when concentration of uni-polar charged particles is large enough. In this work, the ionic concentration is 20%. The relationship between ACS and shear rates follows power law in a exponent range of 0.176-0.276. This range is in a good agreement with the range of experimental data, but it is biased towards the lower limit slightly.
Key words: ionic concentration; average cluster sizes; cluster size distribution; power law
1 Introduction
Research on microstructures and clustering properties of superfine particles in light media is a very active field. The scope of the investigation deals with both macro- and micro-scopic aspects: in macroscopic property aspects, research includes effective pair potentials [1-2], structures and properties at phase changing process [3] as well as behavior of metallic particles in supercritical liquids [4], etc; in microscopic aspects, it includes average cluster sizes (ACSs) and cluster size distributions (CSDs) [5-6], radial distribution functions or similar [7-9], and charging behavior of metallic particles [10], etc. Particularly, HUANG et al [5] investigated the effects of crystal number and cluster sizes on CSDs, and examined the dynamic process at nucleation and crystal growth stages in KNO3-H2O systems. LI et al [6] quantitatively investigated effects of shear rates on ACSs and CSDs in a light medium with partly charged particles, and concluded that the effects were remarkable in the high ionic concentration considered. XIAO et al [11] studied effects of anions on ACS and morphological behavior of ultrafine α-Al2O3 powder, and they linked the CSD of aggregates in systems with their filtering performance. XIONG et al [12] concluded that ACS was smaller and CSD was more uniform in uni-polar flame aerosol systems than that in non-polar systems. However, study on property change in systems of partly charged metallic superfine particles due to electrostatic action and comparison with those in non-charged metallic systems are particularly less compared with their wide uses in many scientific fields and applied areas. Therefore, research on ACS and CSD of partly charged superfine nickel particles in light media, and understanding their interaction behavior by comparing their properties with those in non-charged particle systems, are no doubt of great importance in enhancing efficiency in many chemical processes, e.g. hydro-metallurgy or chemical extraction. At the same time, the results can also be used in some applied areas related to various suspensions containing metallic particles, e.g. promotion of surface quality of electroplating parts, prediction of properties of nanometer materials made by structure units of nanometer that eventually relied on ACS and CSD.
This work is to investigate effects of shear rates on microstructures, i.e. ACS and CSD of nickel colloidal solutions in systems of uni-, bi- and non-polar particles, and to look for relationship between micro-structures and macro-properties through understanding interactions of the particles in the systems.
2 Simulation details
2.1 Governing equation
Simulation details include potentials, governing equation chosen, and boundary conditions used as well
as simulation start, interest quantities extracted, etc. In the considerations above, it is important to choose a suitable potential as it plays a key role in reproducing simulation object. In this work, we chose Lennard-Jones potential and Coulomb interaction energy terms. The former stands for a very wide interaction between non-reaction particles and the latter for interactions of charged particles. They can be expressed as
![]() (1)
(1)
where εij and rij are the well depth of energy and distance between particles i and j respectively, σ is the diameter of a particle, ε0 and ε1 are dielectric constants in a vacuum and in a medium respectively, and Z1 and Z2 are ionic valences, and e is elementary charge. Eqn.(1) is reliable in describing interactions between metallic particles Ni [13] and verified by X-ray absorption method [7]. It is also applicable to all other systems of heavy particles in light media.
2.2 Basic definitions
All simulations were performed in a canonical ensemble. Compared with Lennard-Jones potential, the second term in Eqn.(1) was a typical long-range potential and computed by Ewald summation in bi-polar systems (definition given below). Because of without the ionic atmosphere, the distance of interactions between particles in uni-polar systems (again, definition given blow) is much longer than that in bi-polar systems, a completely modified model is used [14]. Furthermore, all parameters used in this work are reduced unit, and their definitions refer to Ref.[9]. Other simulation details such as computational methods and definition of clusters refer to Refs.[6, 9]. Charge transfer between the particles at nano-meter sizes [14-15] was very quick, and therefore the particles were pre-charged. Furthermore, only part particles were charged in the bi- and uni-polar systems, because charge experiments had verified that the limit ratio of the charged particles to all particles was 30% [15]. In this work, a system containing 50 positive and negative ions, which is equivalent to 10% in ratio of charged particles to all particles, is called a bi-polar system; in uni-polar systems two different ionic concentrations are considered: a system containing 50 positive (or negative) ions equivalent to 10% of the charged particles to all, is called ep10; a system containing 100 positive (or negative) ions equivalent to 20% of the charged particles to all, is called ep20. Both the ep10 and ep20 subsystems are computed separately to examine effects of ionic concentrations on the clustering properties of the uni-polar systems. If a system contains non-charge particles, it is called a non-polar system. In each system above, when shear rates are 3.0, 4.0, 5.0 and 6.0 respectively, micro-properties such as ACSs and CSDs will change with both shear rates and other conditions, and the changing micro-properties will be used to study the changes of macroscopic properties of the systems.
2.3 Program validation
To verify the program, computational energies and pressures at different reduced densities and temperatures were compared with those in the Ref.[9]. The errors in reduced energy range from 0.1-0.7 with fluctuation of 0.002-0.005, and all the relative errors were less than 5%. This indicates that our results are in a fair good agreement with previous work [9], and the program is validated as well.
3 Results and discussion
3.1 Average cluster sizes (ACSs)
Tables 1 and 2 list average cluster sizes N′ (1, 0) and N (3, 2) in the three systems, respectively. N′ (1, 0) is used in computer simulation, as it is easy to calculate and to describe the relationship between the cluster number and the particles in each cluster sensitively. N (3, 2) is used to describe surface or interface properties of superfine particles and is said to be close to the measured values. They are defined as N′ (1, 0)=<∑inii/∑i ni> and N (3, 2)=<∑inii3/∑i nii2> respectively. Here, n is the cluster number with i particles; < > means ensemble average.
Table 1 Average cluster sizes N′ (1, 0) at various shear rates in different systems
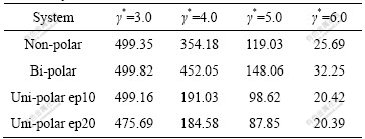
Table 2 Average cluster sizes N (3, 2) at various shear rates in different systems
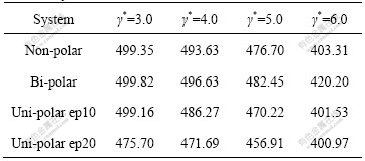
From Tables 1 and 2, it can be seen that both the ACS N′ (1, 0) and N (3, 2) decrease with the increase of shear rates in the same system as the large clusters are broken. If cluster sizes in different systems are compared, the cluster sizes in bi-polar systems are larger than those in other systems. This is understandable because attractive forces from sign-unlike particles attempt to solidify the clusters, and this point has also been verified by other’s work [13]; because of the similar reason, clusters in uni-polar systems are smaller than those in both non- and bi-polar systems due to the repulsive force from sign-like particles, and the larger the concentrations of uni-polar charged particles, the smaller the cluster sizes. Comparing the data in Tables 1 and 2, the data change with increasing shear rates in Table 1 is much quicker than that in Table 2. This fully reflects the sensitivity of ACS N′ (1, 0) in describing the relationship between the cluster numbers and their particles. Correspondingly, ACSs’ change in Table 2, though ACS is still decreased as shear rates go up, is much smoother. This change of ACS with the increase of shear rates is often fitted into an equation of the power law: N(3, 2)=cγ*-s, here, N(3, 2) is the ACS values at different shear rates, γ* is shear rate in reduced unit, s is the power index, and c is a proportionality. Table 3 lists the fitted parameters s and c for the data in Table 2.
Table 3 Fitted parameters s and c for ACS N(3, 2)
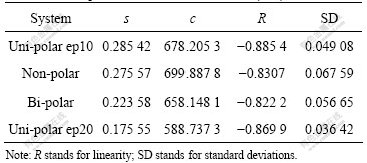
It is seen from Table 3 that all the slopes s (absolute values) are larger than 0.82, and the standard deviations are less than 0.07. This means that the fitted straight lines are up to standard from statistical point of view. Furthermore, the s stands for easy or difficult breakage of the clusters, and the smaller the s values, the solider the clusters. For example, clusters in uni-polar ep10 subsystems are the weakest (see Table 2). This means that breakage of clusters by shear stress in uni-polar ep10 subsystem is the easiest among the all other systems, because the repulsive force from sign-like charged particles dramatically weakens the clusters. From Table 3, it can be seen that the s decreases gradually as the systems change from uni-polar ep10, non-polar, bi-polar to uni-polar ep20, which implies that the clusters in the systems become more and more resistant against shear stresses (note the negative sign before s). Obviously, the repulsive force of sign-like charged particles weakens the strength of clusters in uni-polar ep10, so that the clusters are the weakest in all systems. However, attractive force of sign-unlike charged particles solidifies the clusters to some extent in bi-polar system, so the clusters are the solidest in the first three systems (i.e. the smallest s). The most interesting observation is that the s of clusters in uni-polar ep20 systems is the smallest in all systems considered. Note that there is much more repulsive force among particles in ep20 subsystem than that in ep10 system, so the clusters should be more easily broken and the s should be the largest. However, as a matter of fact, the s is the smallest. This seemingly contradictory observation can be explained very well by the following fact. The repulsive force from sign-like particles in ep20 subsystem is so large that the cluster has broken at the smallest shear rate γ*=3.0(see Table 2), the cracked clusters, however, owing to the smaller cross-section against shear stress, almost remain the same size as those in other systems at γ*=4.0 to 6.0. This leads to the slope s to be the smallest. The experimental values in the range of 0-2.4 [16-17] are in a good agreement with fitted values (0.176-0.276) in this work, but are slightly biased towards the lower limit. This implies that the ACS N (3, 2) in the systems considered here is much “solider” than that in Refs.[16-18] since the ACS is able to stand with larger damage of both shear stress, and in some cases, repulsive forces between sign-like particles. The reason why the ACS is much “solider” might be that the particles in our systems are much heavier than their media nearby, so they could penetrate into the clusters that make the clusters denser and therefore could stand with larger shear rates. In the same way, the parameters s and c are also calculated for the data in Table 1, the fitted s values of ACS N′ (1, 0) are around 4.0. These figures are much larger than the values of N (3, 2), again reflecting sensitivity of the N′ (1, 0) in computations.
3.2 Cluster size distributions (CSD)
Fig.1 shows CSDs (only large part is shown, the same below) at different shear rates. It is seen that large numbers of particles come together into 498 particles, and the frequency is as high as 45.0% at shear rate γ*=3.0. This means that many particles gather in the largest cluster in the given condition. When shear rate increases to 4.0, cluster size distributions present two changes: one is the position of the large cluster shifted to the left, i.e. to the smaller clusters at N axis; the other is a remarkable decrease in frequency of the large clusters: the larger the shear rate, the easier the crack; the position of the broken large cluster shifts to the left further, at the same time, frequency of the large cluster dramatically decreases to about 9%. When shear rate increases further to γ*=5.0, the broken cluster again becomes smaller, frequency of the clusters continuously drops to 3%, and the position of the large clusters again shifts to the smaller direction. This changing trend of CSDs as shear
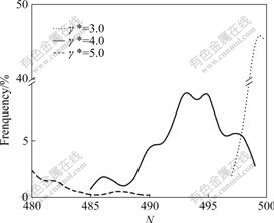
Fig.1 Cluster size distributions at different shear rates in non-polar systems
stress is in a good agreement with experiments qualitatively, and the smaller clusters in complicated fluid favor to improve the fluidity of fluid from rheological point of view. This point has also been examined by experiments [18]. Fig.2 shows effects of different ionic concentrations on CSDs in uni-polar systems. It is clearly seen that aggregates constituted the higher ionic concentration is loose because of the repulsive force between sign-like charged particles, and this repulsive action makes the cluster broken more easily. Expression of this feature in Fig.2 is that the particle number of the large cluster in the high ionic concentration reduces more dramatically than that in the low ionic concentration under the same shear rates. For example, the large clusters in the systems of two concentrations at shear rate γ*=3.0 contain 483 (ep10) and 473 (ep20) particles, respectively; while at γ*=4.0 and γ*=5.0, the large clusters contain 487 and 471 particles, and 473 and 460 particles, respectively. This fully illustrates that repulsive action of high concentration ions is unfavorable to aggregate. Another
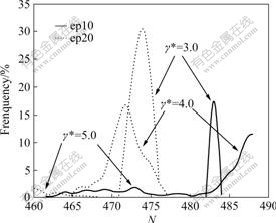
Fig.2 Effects of ionic concentrations on cluster size distributions at different shear rates in uni-polar systems
point worthwhile to saying in Fig.2 is that unlike the changing trend of CSDs with the increase of shear rates, both the largest cluster and frequency decrease with the increase of shear rates. When shear rate changes from γ*=3.0 to γ*=4.0, the CSDs even shift to the right in ep10 subsystem, rather than to the left as usual. This seeming contrary fact to other observations could actually be explained very well by particles rearrangement: under the larger shear rate γ*=4.0, the large cluster is broken up and rearranged with other clusters (even single particle) into larger one, the unrearranged particles or small clusters disappeared in this part of N axis (but would appear in the left part of the N axis that was not shown in Fig.2).
Compared with the work of XIONG et al [12], this work confirms their conclusion that ACS is “smaller” and CSD is “more uniform” in uni-polar systems than those in non-polar systems. However, this conclusion is subjected to the condition: only when the repulsive force of sign-like particles is large enough, the ACS becomes “smaller”, if it is not large enough, the clusters may only be greatly weakened, as occurred in the ep10 systems. Furthermore, the “more uniform” means that large clusters are easier to be cracked than small clusters, as occurred in ep20 system. Strong repulsive force cracks the large clusters at minimum shear rate γ*=3.0. However, the cracked clusters have larger endurance against shear stress.
Fig.3 shows comparison of CSDs between non- and uni-polar (ep10) systems. The large clusters and their frequencies in non-polar system are always larger/higher than those in uni-polar (ep10) systems. For example, the large cluster in non-polar system contained 498 particles at γ*=3.0, whereas the corresponding large cluster in uni-polar system contains only 483 particles, and frequency also decreases dramatically from about 45% to 14%. This indicates that the repulsive forces in uni-polar system tremendously weaken the solidity of the clusters.
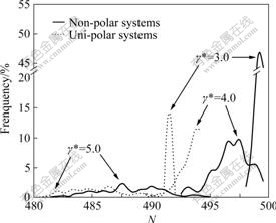
Fig.3 Comparison of cluster size distributions at different shear rates in non- and uni-polar systems
Fig.4 shows comparison of CSDs in bi- and non-polar systems. It is seen that the CSDs and the large cluster have a trend to widen distributions and to deflate clusters with increasing shear rates in each system. This shows the damage action of large shear stresses. Furthermore, if frequencies and sizes of the large clusters in the two systems are compared, the frequencies and sizes of the clusters in bi-polar systems are larger than their counterparts in non-polar systems. Again it shows that attractive forces between sign-unlike particles in bi-polar systems solidify the clusters so that the cluster bounds are stronger than their counterparts. More detail analysis for Figs.3 and 4 can be found in Ref.[6].
Fig.5 shows comparison of CSDs between uni- and bi-polar systems. Because of repulsive action of sign-like ions in large cluster, the clusters in uni-polar systems are obviously looser compared with those in bi-polar systems. The particle number of the large cluster in bi-polar system is 499 and frequency is 83% at γ*=3.0; the corresponding particle number in uni-polar system is only 482 and frequency is 14%. The particle number of the latter is 17 less than that of the former, and the
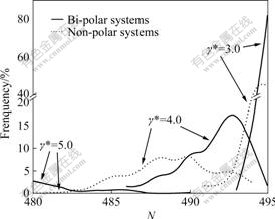
Fig.4 Comparison of cluster size distributions at different shear rates in bi- and non-polar systems
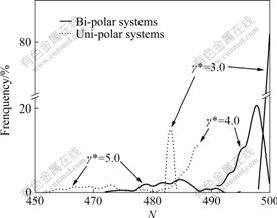
Fig.5 Comparison of cluster size distributions at different shear rates in bi- and uni-polar systems
frequency of the latter is 69% lower than that of the former. While shear rate increases to 4.0 from 3.0, the particle number of the large cluster in bi-polar system decreases to 494, and the particle number in uni-polar system falls to 485. The latter is still 9 particles less than the former, correspondingly, frequency of the large cluster in the two systems decreases to 12% from 20%. Shear rate increases continuously, the large clusters in both systems are nearly declining, but both the cluster sizes and the frequency of the large clusters of the large clusters in bi-polar system are still little larger.
4 Conclusions
(1) In the four (sub)systems, clusters in ep10 sub-systems are the weakest, so they have the largest slope s as shear stress increases. Foreign force unnecessarily cracks large clusters into small ones: there exists a threshold: the clusters are greatly weakened if shear stress is smaller than the threshold and the clusters crack if the shear stress is larger than the threshold. Furthermore, broken clusters have larger endurance to damage of larger shear stress. This makes the fitted slope to be the smallest (s=0.176) in the four systems.
(2) Effects of sign-like charged particles on clusters structures differ: at the lower ionic concentration (10%) and the low shear rate (γ*=3.0) repulsive forces do not seem to affect the cluster sizes too much; however, at the higher ionic concentration (20%), the effect of repulsive forces on ACSs and CSDs is remarkable.
(3) Relationship between average cluster sizes N(3, 2) and shear rates γ* follows power law, and the exponent range is 0.176-0.276 in the conditions considered. This range is in a good agreement with known experimental one, but slightly biased towards the lower limit.
References
[1] PIROG I V, NEDOSEIKINA T I. Study of effective pair potentials in cubic metals [J]. Physica B―Condensed Matter, 2003, 334(1/2): 123-129.
[2] DALGIC S S, DALGIC S, TEZGOR G. Transferable pair potentials for liquid iron, cobalt and nickel [J]. Physics and Chemistry of Liquids, 2002, 40: 539-552.
[3] FAN Jiu-ping, XU Xiao-hong, JIANG Feng-xian, TIAN Bao-qiang, WU Hai-shun. Microstructures and magnetic properties of [SiO2/FePt]5/Ag thin films [J]. Journal of Central South University of Technology, 2008, 15(1): 11-14.
[4] LAL M, PLUMMER M, RICHMOND N J, SMITH W. Solvation of metal nanoparticles in a subcritical-supercritical fluid: A computer simulation study [J]. Journal of Physical Chemistry B, 2004, 108(19): 6052-6061.
[5] HUANG Pei, HUANG De-chun, XU Nan-ing, SHI Jun. Quantitative identification of nucleation and crystal growth stages in batch crystallization from solution [J]. Chemical Journal of Chinese Universities, 2004, 25(3): 504-508. (in Chinese)
[6] LI Jing-sheng, WANG Juan, SHEN Qin. Clustering properties of partly charged particles in a light medium [J]. Chinese Chemical Letters, 2007, 18(2): 1419-1422.
[7] CHIALVO A A, SIMONSON J M. The structure of concentrated NiCl2 aqueous solutions: What is molecular simulation revealing about the neutron scattering methodologies? [J]. Molecular Physics, 2002, 100(14): 2307-2315.
[8] CHILLEMI G, D’ANGELO P, PAVEL N V, SANNA N, BARONE V. Development and validation of an integrated computational approach for the study of ionic species in solution by means of effective two-body potentials [J]. Journal of American Chemistry Society, 2002, 124(9): 1968-1976.
[9] LI Jing-sheng, WANG Juan, SHEN Qin, ZHENG Ning-ning. Effects of shear rates on radial distribution of different types of heavy particles in light media [J]. Transactions of Nonferrous Metals Socity of China, 2008, 18(2): 421-425.
[10] CHEN Wen-long, HAN Xiao-jun, PENG Zhang-quan, DONG Shao-jun, WANG Er-kang. Investigation of electrochemical charging behaviors of “naked” gold nanoparticles ensembles in aqueous media [J]. Chinese Journal of Chemistry, 2002, 20(10): 1031-1037.
[11] XIAO Jin, QIN Qi, WAN Ye, ZHOU Feng, CHEN Yan-bin, LI Jie, LIU Ye-xiang. Effect of anions on preparation of ultrafine α-Al2O3 powder [J]. Journal of Central South University of Technology, 2007, 14(6): 773-778.
[12] XIONG Yun, PRATSINIS S E, MASTRANGELO S V R. The effect of ionic additives on aerosol coagulation [J]. Journal of Colloid Interface Science, 1992, 153(1): 106-117.
[13] D’ANGELO P, BARONE V, CHILLEMI G, SANNA N, WOLFRAM M K, PAVEL N V. Hydrogen and higher shell contributions in Zn2+, Ni2+, and Co2+ aqueous solution: An X-ray absorption fine structure and molecular dynamics study [J]. Journal of American Chemistry Society, 2002, 124(9): 1958-1967.
[14] PARK H, KIM S, CHANG H. Brownian dynamic simulation for the aggregation of charged particles [J]. Journal of Aerosol Science, 2001, 32(11): 1369-1388.
[15] ADACHI M, KOUSAKA Y, OKUYAMA K. Unipolar and bipolar diffusion charging of ultrafine aerosol particles [J]. Journal of Aerosol Science, 1985, 16(2): 109-123.
[16] COLLINS I R, TAYLOR S E. The microstructural properties of coagulated nonaqueous carbon black dispersions [J]. Journal of Colloid Interface Science, 1993, 155(2): 471-481.
[17] HARADA S, TANAKA R, NOGAMI H, SAWADA M. Dependence of fragmentation behavior of colloidal aggregates on their fractal structure [J]. Journal of Colloid Interface Science, 2006, 301(1): 123-129.
[18] FRANKS G V, YATES P D, LAMBERT N W A, JAMESON G J. Aggregate size and density after shearing, implications for dewatering fine tailings with hydrocyclones [J]. International Journal of Mineral Processing, 2005, 77(1): 46-52.
(Edited by YANG You-ping)
Foundation item: Projects(50474037, 50874087) supported by the National Natural Science Foundation of China; Project (BK2006078) supported by the Natural Scientific Funds of Jiangsu Province, China
Received date: 2008-09-23; Accepted date: 2008-12-22
Corresponding author: LI Jing-sheng, Professor, PhD; Tel: +86-13646101959; E-mail: jli5154@ujs.edu.cn

