Determination of kinetic parameters from calorimetric study of solid state reactions in 7150 Al-Zn-Mg alloy
��Դ�ڿ����й���ɫ����ѧ��(Ӣ�İ�)2011���6��
�������ߣ�K. S. GHOSH N. GAO
����ҳ�룺1199 - 1209
�ؼ��ʣ�7150 Al-Zn-Mg�Ͻ𣻲�ʾɨ�����ȷ�(DSC)��ʱЧ��Ϊ����ܣ���亯��
Key words��7150 Al-Zn-Mg alloy; DSC; aging behaviour; activation energy; transformation function
ժ Ҫ�����ò�ʾɨ�����ȷ�(DSC)���ڲ�ͬ�����������о�7150 Al-Zn-Mg�Ͻ���ˮ�㡢��ȻʱЧ���˹�ʱЧ״̬�µĹ�̬��Ӧ��DSC�����ϲ�ͬ�ķ��Ⱥ����ȷ��Ӧ�Ų�ͬ�Ĺ�̬��Ӧ�Ρ����ż������ʵ����ӣ�������λ��Ӧ���¶�Ҳ��֮���ӣ�������Щ��̬��Ӧ������ѧ��Ͷ���ѧ���Ƶġ�ͨ��������ͬʱЧʱ���ºϽ��Ӳ���������Ͻ��ʱЧ��Ϊ��ͨ������DSC���߸�����λ��Ӧ���������õ��˺Ͻ��̬��Ӧ��������(Y)���������(dY/dt)����亯��(f(Y))�Ͷ���ѧ����(���Q��Ƶ������k0)��������������õ�����Щ����ѧ���������������������Ľ���ǺϽϺá�
Abstract:
Differential scanning calorimetric (DSC) study was carried out at different heating rates to examine the solid state reactions in a 7150 Al-Zn-Mg alloy in water-quenched (WQ) state, naturally and artificially aged tempers. The exothermic and endothermic peaks of the thermograms indicating the solid state reaction sequence were identified. The shift of peak temperatures to higher temperatures with increasing heating rates suggests that the solid state reactions are thermally activated and kinetically controlled. The artificial aging behaviour of the alloy was assessed by measuring the variations of hardness with aging time. The fraction of transformation (Y), the rate of transformation (dY/dt), the transformation function f(Y), and the kinetic parameters such as activation energy (Q) and frequency factor (k0) of all the solid state reactions in the alloy were determined by analyzing the DSC data, i.e. heat flow involved with the corresponding DSC peaks. It was found that the kinetic parameters of the solid state reactions are in good agreement with the published data.

K. S. GHOSH1, N. GAO2
1. Department of Metallurgical and Materials Engineering, National Institute of Technology, Durgapur 713 209, India;
2. Materials Research Group, School of Engineering Science, University of Southampton, Southampton, SO17 1BJ, UK
Received 4 August 2010; accepted 19 November 2010
Abstract: Differential scanning calorimetric (DSC) study was carried out at different heating rates to examine the solid state reactions in a 7150 Al-Zn-Mg alloy in water-quenched (WQ) state, naturally and artificially aged tempers. The exothermic and endothermic peaks of the thermograms indicating the solid state reaction sequence were identified. The shift of peak temperatures to higher temperatures with increasing heating rates suggests that the solid state reactions are thermally activated and kinetically controlled. The artificial aging behaviour of the alloy was assessed by measuring the variations of hardness with aging time. The fraction of transformation (Y), the rate of transformation (dY/dt), the transformation function f(Y), and the kinetic parameters such as activation energy (Q) and frequency factor (k0) of all the solid state reactions in the alloy were determined by analyzing the DSC data, i.e. heat flow involved with the corresponding DSC peaks. It was found that the kinetic parameters of the solid state reactions are in good agreement with the published data.
Key words: 7150 Al-Zn-Mg alloy; DSC; aging behaviour; activation energy; transformation function
1 Introduction
Aluminium alloys of 7xxx series Al-Zn-Mg are widely used in aircraft and aero-vehicle structural components. These alloys provide very high strength and stiffness in their peak aged temper. The aging behaviour and the sequence of precipitation and dissolution reactions of these alloys have been assessed by various methods such as hardness, resistivity measurement, calorimetry and X-ray diffraction study [1-5]. But, in the aluminium alloy system, the formation of a large number of metastable precipitates and the wide variety of aging treatments employed lead to complex microstructural conditions [4, 6-8]. Hence, it is still essentially required to study the microstructural features of the alloy for further understanding and correlating the structure- property relationship.
For rapid and qualitative description of solid-state phase transformation/precipitation in aluminium alloys, differential scanning calorimetric (DSC) is considered a supplement to transmission electron microscopy (TEM) studies [9-11], although TEM is an important technique. Further, considering the limitations in quantitative TEM method, i.e. susceptibility to errors and time-consuming technique, calorimetric method can conveniently be utilized to understand the kinetics of all types of precipitation and dissolution reactions in aluminium alloys [12-13].
The kinetics of precipitation and dissolution reactions in aluminium alloys was obtained using resistivity and differential scanning calorimetry (DSC) techniques [14-19]. Generally, resistivity measurements are used to study the kinetics under isothermal conditions and DSC under non-isothermal conditions. JENA et al [15] and GUPTA et al [16] evaluated kinetic parameters for precipitation in Al-Cu-Mg alloy from DSC thermograms. DELASI and ADLER [9] assumed a first order kinetic relationship and used stepwise integration procedure to determine the rate constants for the dissolution reaction in three 7xxx series alloys. They also have applied absolute reaction rate theory to find out the activation energy for various reactions. DONOSO [20] estimated the activation energies for dissolution of GP zones and ��' phase in the Al-4.5%Zn-1.75%Mg alloy from the peak temperature corresponding to the maximum rates of heat generation. In the present investigation, the sequence of solid state precipitation and dissolution reactions of a 7150 alloy is discussed from the DSC thermograms obtained from the DSC studies at different heating rates. Further, the kinetic parameters, such as activation energy (Q), frequency factor (k0) and the transformation function f(Y) are also determined from the DSC data.
2 Experimental
2.1 Materials
The chemical compositions (mass fraction, %) of the 7150 alloy are: Zn 6.30%, Mg 2.40%, Cu 2.30%, Zr 0.12%, Fe 0.10%, Si 0.05% and Al balance. The alloy was obtained in rolled plate form of approximate 12 mm in thickness. Specimens with dimensions of 10 mm in diameter and 1 mm in thickness were obtained from the alloy plate and were subjected to solutionising treatment at a temperature of 475 ��C for 45 min, quenched in water and followed by artificial aging at temperatures of 110 and 120 ��C up to 115 h corresponding to over aged (T7) temper. Vickers microhardness in different aging states were measured using a Matsuzawa Seiki MHT-1 microhardness tester equipped with Vickers indenter.
2.2 DSC studies
Specimens in disc form of approximate 20 mg were made from the as-quenched, naturally aged and artificially aged alloys. It should be mentioned that the as-quenched samples had undergone a few hours of natural aging, due to the time gap between solution-quenching treatment and the DSC run. The DSC runs were initiated from ambient temperature to 540 ��C at different heating rates in nitrogen atmosphere, using a Perkin Elmer Pyris 1 DSC unit. For baseline corrections, all the DSC runs were corrected by subtracting a DSC baseline obtained from a run with an empty pan. The baseline corrections were accounted for in order to free from the parasitic effects and also in perfect measuring an accurate and reliable calorimetry heat evolution and absorption of the DSC unit. In the DSC thermograms, the exothermic and endothermic reactions were plotted upward and downward respectively. The peak temperatures of all the peaks were noted.
3 Results and discussion
3.1 Vickers microhardness
Figure 1 shows the variation of hardness with aging time of the solutionised and water quenched samples which were artificially aged at temperatures 110, 120 ��C for varying time and naturally aged as well. Figure 1 exhibits the characteristic aging behaviour of a precipitation hardenable aluminium alloy, i.e. the increase of hardness, attainment of maximum peak hardness followed by the decrease of hardness with increasing aging time. This variation of hardness with aging time is attributed to the formation of GP zones, precipitation semi-coherent ��' (MgZn2) and S' phases and formation and growth of incoherent equilibrium �� (MgZn2) and S' phases [1, 8, 21].
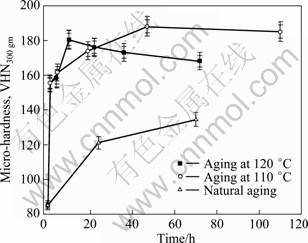
Fig. 1 Variation of hardness with aging time of 7150 alloy
3.2 DSC thermograms of solution treated and water quenched state
Figure 2 shows the DSC thermograms of the solution treated and water quenched 7150 alloy at heating rates of 2.5, 5.0, 10, 15, 20, 25 and 30 ��C /min. In the case of age hardenable aluminum alloys, normally, the formation of precipitates is an exothermic process whilst their dissolution is an endothermic process [22]. The peak temperature for the precipitation represents the temperature at which the two factors, i.e. the fall of the driving forces for the continued precipitation (i.e. the decrease of supersaturation with the rise of temperature during DSC run) and the increase of diffusivity with the increase of temperature which results in competing to reach a maximum precipitation rate.
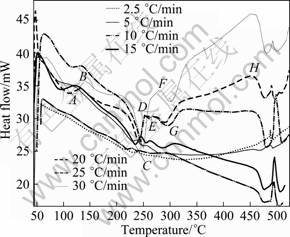
Fig. 2 DSC thermograms of 7150 alloy in solutionised and water quenched state at different heating rates
The DSC thermograms (Fig. 2) showing exothermic and endothermic peaks indicate the sequence of precipitation and dissolution reactions in the alloy: Super saturated solid solution (SSSS)�� ? vacancy reach clusters (VRC)? GP zones ? ��' ? �� (MgZn2). However, there are peaks for the precipitation and dissolution of S�� (Al2CuMg) phase and a series of endothermic peaks at higher temperatures which may be attributed to the incipient fusion of these phases. It is mentioned that there may be an overlapping of one reaction with another; and hence the peaks in the DSC thermograms (Fig. 2) are overlapped by one another.
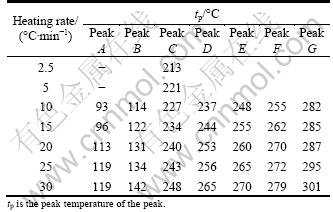
The different peak regions in the thermograms (Fig. 2) marked A-H are: A��dissolution of Guinier�CPreston (GP) zones; B��precipitation of ��' (MgZn2) phase; C��dissolution of ��' (MgZn2) precipitates; D and F��overlapping reactions within a small temperature range, i.e. precipitation of �� (MgZn2), T (Mg32(Zn,Al)49) and copper bearing S' (Al2CuMg) phase; E��dissolution of ��;? G��dissolution of these Cu-bearing phases; H��surface oxidation. Further, at low temperatures (60-65 ��C), exothermic peak (A1) indicates the formation of VRC, GP I and GP II zones, and a fluctuation at peak B1 between peak B and peak C may be attributed to the formation of transition phases and/or invariant of ��' phase on the precursor of the lately dissolved GP II zones. The reaction sequence occurring in the 7xxx series alloy has been discussed in several references [3, 9-10, 13, 23-27]. The presence of copper may introduce additional Cu-bearing S' phase and it is variant in the 7150 alloy, mostly at the higher temperatures as the composition of the alloy falls near the border of the �� + S field of the Al-Zn-Mg-Cu phase diagram [28-31]. The peak temperatures of all the peaks with different heating rates (given in Table 1) are in agreement with the results of literatures [3, 9-10, 23-24]. The GP zones are coherent with the matrix, and the semi-coherent intermediate ��' (MgZn2) phase has been ascribed with monoclinic unit cell, while the incoherent equilibrium �� (MgZn2) phase is hexagonal [8-9].
Table 1 Peak temperatures of DSC peaks of as-quenched 7150 alloy studied at different heating rates
In precipitation hardenable aluminium base alloys, the formation of GP zones commences from the room temperature. It was reported that there are two types of GP zones in Al-Zn-Mg based alloys, which are solute-rich GP 1 zones, or Mg/Zn cluster; and solute/ vacancy-rich GP II zones [3, 25-26, 32-34]. The endothermic peak A in Fig. 2 reflects the dissolution of GP zones that are formed at room temperature immediately in quenching. The dissolution peak temperature is in agreement with the reported dissolution temperature range of 50-150 ��C [17]. The exothermic peak region B is attributed to the precipitation of semi-coherent ��' phase.
Further, from Fig. 2, it can be seen that the peak temperatures of the peaks shift to higher temperature with the increase of heating rates. Thus, the shifting of the precipitation and dissolution reactions with increasing heating rates indicate that these reactions are thermally activated and kinetically controlled [12, 14-16, 19, 35]. The peak temperatures of the solid state reactions at different heating rates are given in Table 1.
3.3 Thermograms of under- and over aged alloys
Figure 3 shows the DSC thermograms at heating rate of 20 ��C /min for 7150 alloy naturally aged for 3 h and 23 h, and artificially aged at 70 ��C for 0.5 and 110 ��C for 1 h. The thermograms of the artificially aged alloy do not show the peak A (GP zone dissolution) and peak B. The absence of these two low temperature peaks is attributed to the fact that the artificially aged alloys have no GP zones to dissolve during DSC run; and moreover, the alloys contain already precipitated ��' phase. The appearance of other peak regions C�CH (Fig. 3) for the artificially aged alloys is obvious. However, the thermograms of only naturally aged samples exhibit low temperatures peaks A and B, which is very prominent for samples only 3 h naturally aged and with fluctuations for 23 h naturally aged. The appearance of peaks A and B in the naturally aged alloys indicates that the solid solution is still supersaturated with the solutes, in other words, the alloy does not contain equivalent amounts of ��' phase. Similar observations in the DSC studies of Al-Li- Cu-Mg-Zr alloys of under-aged and retrogressed tempers, were also reported in Ref. [35]. Thus, it is to be noted that the absence of these peaks for artificially aged alloys and the fluctuations of peak regions A and B for naturally aged for 23 h confirm the presence of certain amount of matrix strengthening ��' phase. This is also reflected in the aging behaviour (Fig. 1), as there is an increase of hardness with aging time up to peak aged temper.
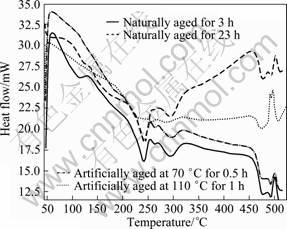
Fig. 3 DSC thermograms of 7150 alloy aged to various tempers at heating rate of 20 ��C/min
3.4 Analysis of DSC data
In the DSC run, the total heat effects, Q(T), observed between the initial temperature of a peak Ti and temperature T, is given by
![]() (1)
(1)
where m is the mass of the sample; ![]() is the heating rate; E is (calibration) constant; and A(T) is the area under the peak between temperatures Ti and T, which is the observed heat flow that is associated with the precipitation and dissolution reactions [15-16, 19]. A(T) can be expressed as
is the heating rate; E is (calibration) constant; and A(T) is the area under the peak between temperatures Ti and T, which is the observed heat flow that is associated with the precipitation and dissolution reactions [15-16, 19]. A(T) can be expressed as
![]() (2)
(2)
where ��q is the measured heat flow, involved for the specific precipitation or dissolution reactions, to the inert reference relative to the sample as a function of temperature at a constant heating rate ![]() .
.
If Tf is the final temperature of the peak, we have
![]() (3)
(3)
If Q0 is the heat effect per mole of precipitate, then the heat effect dQ is given by
dQ=Q0dn (4)
where dn is the number of moles of precipitates which form or dissolve per unit mass of the alloy.
Integrating Eq. (4) and substituting in Eq. (1) yields
![]() (5)
(5)
and
![]() (6)
(6)
Thus, the fraction of the precipitation Y(T) at temperature T can be expressed as
![]() (7)
(7)
Therefore, from Eqs. (5), (6) and (7), we have
![]() (8)
(8)
From the DSC thermograms, the fraction transformed Y(T), i.e. the amount of phase precipitated or dissolved at a given temperature range, can be expressed according to Eq. (8).
The rate of transformation can be written as:
![]()
Thus,
![]() (9)
(9)
3.5 Non-isothermal transformation
For complex transformation and precipitation reactions, the reaction kinetics for non-isothermal transformation are usually expressed [19], according to the modified Avrami-Johnson-Mehl equation, in the form:
![]() (10)
(10)
![]() (11)
(11)
where Y is the volume fraction of precipitation at time t; k is the rate constant and n is the growth parameter, which depend on the nuclei density and precipitate growth modes, respectively; Q and R are the activation energy of the reaction and gas constant, respectively. Eq. (10) is considered to be accurate based on the assumptions that: 1) the product phase is randomly distributed; 2) nuclei are randomly distributed; 3) the average growth rate is independent of position in the sample; 4) impingement on objects other than neighbouring domains of the product phase is negligible and 5) blocking resulting from anisotropic growth is negligible.
The logarithmic form of Eq. (10) yields
![]() (12)
(12)
The rate constant k and the growth parameter n are the constants for a process mechanism. Therefore, for a specific value of n, the term nln k in Eq. (12) remains constant. The plot of lnln [1/(1-Y)] vs ln t from Eq. (12) yields a straight line function, from which the value of n (slope) and k (from the intercept) can be obtained.
For non-isothermal transformation, it is more expedient to use Eq. (10) in developing transformation rate and related expression. The rate of transformation can be expressed as
![]() (13)
(13)
where f(Y) is the implicit function of Y from Eq. (10).
Combining with Eq. (13) and the derivative of Eq. (10) results in
![]() (14)
(14)
The non-isothermal kinetic data stated in the DSC analysis in Eq. (9) can be written as
![]() =
=![]() (15)
(15)
Substituting k(T) from Eq. (11) into Eq. (15) and taking logarithm and rearranging, Eq. (15) is simplified as
![]() (16)
(16)
If for a heating rate ![]() , the temperature at which a constant fraction (Y��) of precipitate is obtained, is Tj, then,
, the temperature at which a constant fraction (Y��) of precipitate is obtained, is Tj, then,
![]() (17)
(17)
where ![]() is the jth heating rate, (dY/dT)Y�� is the rate at a given fraction of transformation (Y��), and Tj is the temperature at which the fraction is Y�� at heating rate
is the jth heating rate, (dY/dT)Y�� is the rate at a given fraction of transformation (Y��), and Tj is the temperature at which the fraction is Y�� at heating rate ![]() . Therefore, a plot of
. Therefore, a plot of ![]() vs (1/Tj), under different heating rates, will give a straight line of slope (-Q/R) from which the value of activation energy Q can be determined.
vs (1/Tj), under different heating rates, will give a straight line of slope (-Q/R) from which the value of activation energy Q can be determined.
3.6 Kinetic parameters of solid state reactions in 7150 alloy
3.6.1 Dissolution of GP zones (Peak A)
The endothermic DSC peak A (GP zones) for the water-quenched 7150 alloy at different heating rates is shown in Fig. 4. From these curves, the precipitate amount (volume fraction, Y) and precipitate rate (dY/dt) can be calculated from Eqs. (8) and (9), respectively. The plots of Y and the precipitation rate (dY/dt) are shown as a function of temperature in Figs. 5 and 6, respectively. The Y vs T curve is sigmoidal in shape and shifts to higher temperatures with the increase of heating rate. The variation of rate of transformation with temperatures is typical of a sigmoidal Y��T curve. Further, there are also considerable shifts in the maxima of the rate of transformation curves (Fig. 6) to the higher temperatures with increasing heating rates. It implies that the transformation is thermally activated and kinetically controlled.
The data obtained from Fig. 6 are plotted according to Eq. (17) in Fig. 7 for three values of fraction transformed (Y��) 0.25, 0.50 and 0.75. The slopes of the three linear straight lines give the average value, (33.02 ��1.88) kJ/mol, as the activation energy (Q) for the process. The activation energy value for the dissolution of GP zones is in good agreement with the values obtained by others [9-10, 13, 36].
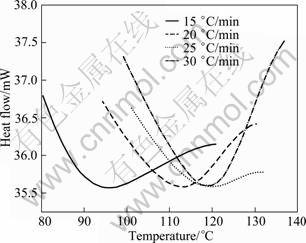
Fig. 4 DSC thermograms of peak A for 7150 alloy in solutionised state at different heating rates
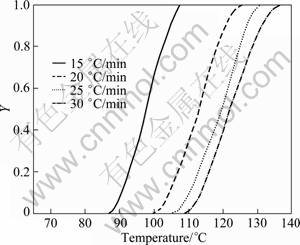
Fig. 5 Plot of Y��T of peak A for solutionised and water quenched 7150 alloy at different heating rates
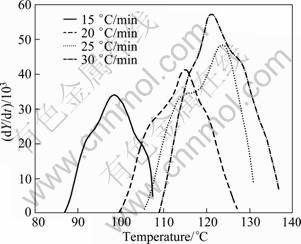
Fig. 6 Plot of dY/dt vs T of peak A for solutionised and water quenched 7150 alloy at different heating rates
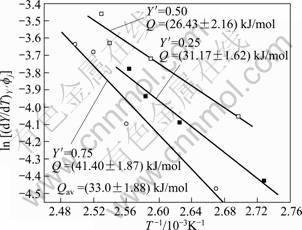
Fig. 7 Plot of determination of activation energy for GP zones dissolution of 7150 alloy after Eq. (17)
It is mentioned that the calculated Q has to be taken as apparent activation energy since, in many cases, the processes involved are not unique and also not precisely definable. Furthermore, due to the complexity of the precipitation and dissolution reactions involved that results in an overlap of their effects in the DSC peaks of 7017 Al-Zn-Mg alloy, the energy content associated with a particular process (precipitation or dissolution) cannot be determined accurately. As a consequence, the determination of enthalpy effects may result in some erroneous value. Notwithstanding the above restrictions, meaningful values of Q associated with distinguishable processes may be obtained since the temperature (T) value at the signal peak is little affected by the uncertainty of the baseline [37].
In order to assess the progress of reactions at all temperatures and for all temperature �C time programs, the function f(Y), the constants, k0 and Q are required to be determined. In general, the reaction function f(Y), is unknown at the outset of the analysis. A range of standard functions which represent particular idealized reaction models have been proposed [38-39]. The function f(Y) is determined by assuming suitable forms and using experimental data to verify. Reactions that occur by nucleation and growth yield sigmoidal behaviour. A general relationship [40] that gives sigmoidal behaviour is
f(Y) = Yr (1-Y)m (18)
where exponent r and m are constant. The formalism can incorporate Johnson-Mehl-Avrami-Kolmogorov (JMAK) kinetics and the form that also yields sigmoidal behavior is
![]() (19)
(19)
where the exponent n, growth parameter, is a constant dependent on precipitate growth mode. If n is considered to be 1, 3/2, 2 and 3 [39-40], Eq. (19) is reduced to Eqs. (20), (21) and (22) respectively, as expressed below.
![]() (20)
(20)
![]() (21)
(21)
![]() (22)
(22)
![]() (23)
(23)
Further, for a three-dimensional diffusion equation, the transformation function f(Y) may also be expressed as [16]:
f(Y)=[1-(1-Y)1/3]2 (24)
Now, combining Eqs. (9), (16) and (22) yields
![]() (25)
(25)
The plots of ![]() vs (1/T) are made to verify the validity of function f(Y) after Eqs. (20) to (24). But, the function f(Y) after Eq. (25) is the most satisfactory, as shown in Fig. 8, whereas the other relationships after Eqs. (20), (21), (23) and (24) are unsatisfactory, as shown in Fig. 9, of the function f(Y) after Eq. (24).
vs (1/T) are made to verify the validity of function f(Y) after Eqs. (20) to (24). But, the function f(Y) after Eq. (25) is the most satisfactory, as shown in Fig. 8, whereas the other relationships after Eqs. (20), (21), (23) and (24) are unsatisfactory, as shown in Fig. 9, of the function f(Y) after Eq. (24).
Thus, for the dissolution of GP zones, the activation energy is found to be (27.93��3.15) kJ/mol, and k0 is found to be 1.56 �� 102 s-1. The activation energy values obtained according to Eqs. (17) and (25) are in close match. Thus, the best transformation function f(Y) describes the dissolution of GP zones in 7150 alloy is 2[-ln(1-Y)]1/2(1-Y). Table 2 gives the kinetic parameters and transformation functions evaluated by the authors for the solid state reactions of the 7150 alloy.
Table 2 Kinetic parameters of different solid state reactions of 7150 alloy
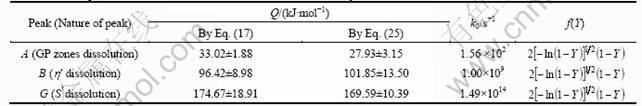
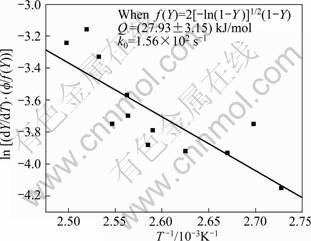
Fig. 8 Plot to verify best fit transformation function f(Y) for GP zones dissolution of 7150 alloy after Eq. (25)
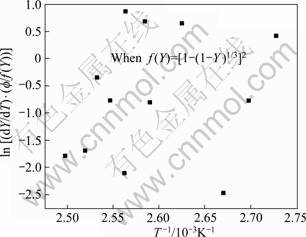
Fig. 9 Plot to verify transformation function f(Y) for GP zones dissolution of 7150 alloy after Eq. (25)
3.6.2 Precipitation of ��' (MgZn2) phase (peak B)
In the present investigation, attempt has not been made to determine the kinetic parameters and the transformation function for the precipitation of ��'?(MgZn2) phase (peak B) from the DSC thermograms in Fig. 2. Using the techniques discussed in the previous sections, the determined values of kinetic parameters for the reaction will not be accurate and appropriate, as the temperature range (i.e. the beginning and completion of precipitation of ��'? phase)? of peak B is very small and close.
3.6.3 Dissolution of ��' (MgZn2) phase (peak C)
The peak C for the dissolution of ��' phase (DSC thermograms in Fig. 2) is shown separately in Fig. 10. From these curves, the fraction of precipitation (Y) and the precipitate rate (dY/dt) are calculated from Eqs. (8) and (9). Figs. 11 and 12 exhibit the plot of Y vs T and (dY/dt) vs T, respectively. Likewise the dissolution of GP zones, the Y vs T curves are sigmoidal in shape and shift to higher temperatures with the increase of heating rate. The variation of rate of transformation with temperature is typical of a sigmoidal Y��T curve. There are also considerable shifts in the maxima of the rate of transformation curves to the higher temperatures with the increasing heating rates, implying that the transformation is kinetically controlled.
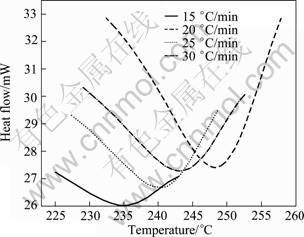
Fig. 10 DSC thermograms of peak C for 7150 alloy in solutionised state at different heating rates
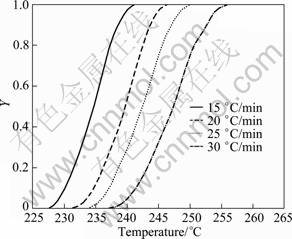
Fig. 11 Plot of Y��T of peak C for solutionised and water quenched 7150 alloy at different heating rates
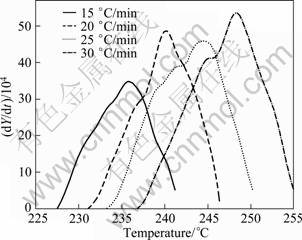
Fig. 12 Plot of dY/dt vs T of peak C for solutionised and water quenched 7150 alloy at different heating rates
The data obtained from Fig. 12 are plotted according to Eq. (17) in Fig. 13 for three values of fraction transformed (Y ��) 0.25, 0.50 and 0.75. The slopes of the three linear straight lines give the average value (96.42 �� 8.98) kJ/mol, which is the activation energy (Q) for the dissolution of ��' phase. The activation energy value is in good agreement with the value reported in literature for 7xxx series alloys [9-10, 13, 36].
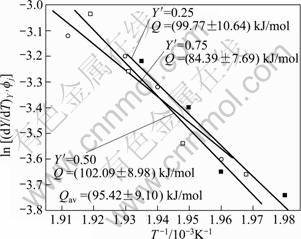
Fig. 13 Plot of determination of activation energy for �ǡ� dissolution of 7150 alloy after Eq.(17)
Likewise for the dissolution of GP zones, plots are made to determine the transformation function, for the dissolution of ��' (MgZn2) phase, after combining Eqs. (9) and (16) with Eqs. (20)-(24). But, the relationship, Eq. (22) is the most satisfactory, as shown in Fig. 14, whereas the other relationships after Eqs. (20), (21), (23) and (24) are unsatisfactory, as shown in Fig. 15, of the function f(Y) after Eq.(20).
The activation energy for the precipitation of ��' phase in the 7150 alloy after Eq. (25) is found to be (101.85��13.50) kJ/mol and k0 is found to be (1.00��109��2.35 s�C1), when the n value is 2. The activation energy values obtained after Eqs. (17) and (25) are in close match. Thus, the best transformation function f(Y) describes the dissolution of ��' phase in the 7150 alloy is
![]() .
.
3.6.4 Precipitation and dissolution of ��?(MgZn2) phase
There is complete overlapping of peak regions D, E and F (Fig. 2) and the transformations have also occurred within a small temperature range, so it is not possible to determine the kinetic parameters accurately by the present techniques adapted.
3.6.5 Dissolution of S' (Al2CuMg) phase (peak G)
The peak G for the dissolution of S' phase (DSC thermograms in Fig. 2) is shown in Fig. 16. From these curves, the fraction of precipitation (Y) and the precipitate rate (dY/dt) are calculated from Eqs. (8) and (9). Figures 17 and 18 exhibit the plot of Y vs T and dY/dt vs T, respectively. Likewise the dissolution of GP zones and the dissolution of ��', the Y vs T curves are sigmoidal in shape and shift to higher temperatures with the increase of heating rate. Further, the considerable shift in the maxima of the rate of transformation curves to the higher temperatures with the increasing heating rates implies that the transformation is kinetically controlled.
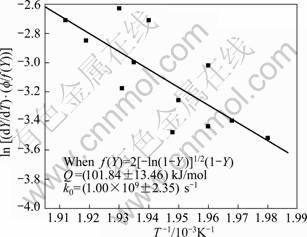
Fig. 14 Plot to verify transformation function f(Y) for dissolution of �ǡ� phase of 7150 alloy after Eq. (25)
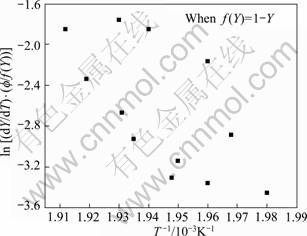
Fig. 15 Plot to verify transformation function f(Y) for dissolution of �ǡ� phase of 7150 alloy after Eq.(25)
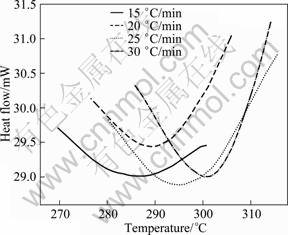
Fig. 16 DSC thermograms of peak G of 7150 alloy in solutionised state at different heating rates
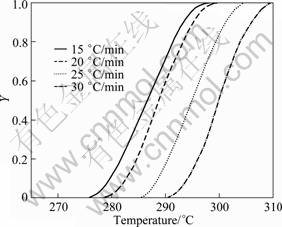
Fig. 17 Plot of Y��T of peak G for solutionised and water quenched 7150 alloy at different heating rates
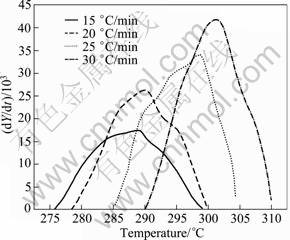
Fig. 18 Plot of dY/dt vs T of peak G for solutionised and water quenched 7150 alloy at different heating rates
The data obtained from Fig. 18 are plotted according to Eq. (17) in Fig. 19 for three values of fraction transformed (Y ��) 0.25, 0.50 and 0.75. The slopes of the three linear straight lines give the average value of (174.67 �� 9.45) kJ/mol, which is the activation energy (Q) for the dissolution of S�� phase.
Plots are made to determine the transformation function for the dissolution of S�� (Al2CuMg) phase, after combining Eqs. (9) and (16) with Eqs. (20)-(24). But, the function f(Y) after Eq. (22) is the most satisfactory, as shown in Fig. 20, whereas the other relationships after Eq. (20), (21), (23) and (24) are unsatisfactory, as shown in Fig. 21, of the function f(Y) after Eq. (23), i.e. data are more scattered and the best linear fit is not possible to obtain activation energy for the reaction.
The activation energy for the precipitation of S' phase in the 7150 alloy after Eq. (25) is found to be (169.59��10.39) kJ/mol and k0 is found to be (1.49��1014 �� 41.55) s�C1. The activation energy values obtained after Eq.(17) and (25) are in close match. Thus, the best transformation function f(Y) describes the dissolution of S' phase in the 7150 alloy is![]() .
.
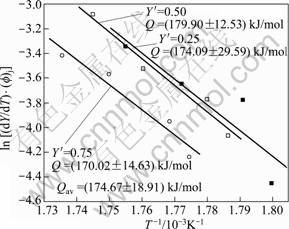
Fig. 19 Plot of determination of activation energy for dissolution of S�� phase of 7150 alloy after Eq. (17)
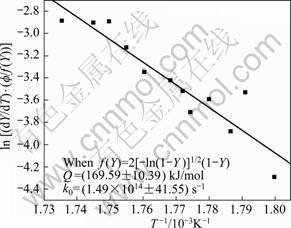
Fig. 20 Plot to verify transformation function f(Y) for dissolution of S�� phase of 7150 alloy after Eq. (25)
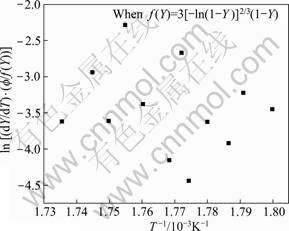
Fig. 21 Plot to verify transformation function f(Y) for dissolution of S�� phase of 7150 alloy after Eq. (25)
4 Conclusions
1) The DSC thermograms of 7150 alloy taken at different heating rates exhibited many endothermic and exothermic peaks which represent the sequence of precipitation and dissolution reactions, such as the formation of GP zones, the precipitation of?? ��' phase, the dissolution of ��' phase, and the precipitation and dissolution of ? �� and S' phases. The comparison of DSC thermograms of naturally aged and artificially aged alloys indicates that the artificially aged alloys contain semi-coherent matrix strengthening ��' phase and equilibrium �� ?phase, whereas, the naturally aged samples for short duration which exhibit GP zones peak and the precipitation of?? ��' phase peak are still supersaturated with the solutes.
2) The shift of the reaction peaks to higher temperatures with increasing heating rates implies that the reactions are thermally activated and kinetically controlled processes.
3) From the DSC data, the technique to determine the fraction of transformation Y, and the method to determine activation energy (Q), frequency factor (k0) and the transformation function f(Y), were discussed. These values for the dissolution of GP zones, the dissolution of ��' phase and the dissolution of S phase were determined.
4) From the present DSC thermograms, it is difficult to determine the kinetic parameters accurately for the precipitation and dissolution reaction of �� phase because of the complete overlapping of peaks within a small temperature range for these transformations.
References
[1] LENDVAI J. The effect of vacancy�Crich clusters on the decomposition processes in Al-Zn-Mg alloys [J]. Cryst Res Technol, 1984, 19(10): 1341-1346.
[2] HIRANO K, IWASAKAI H. Calori- and resistometric analyses of ageing and precipitation in aluminium copper alloys [J]. Trans Japan Inst of Metal, 1964, 5(3): 162-170.
[3] JIANG X J, NOBLE B, HOLME B, WATERLOO G, TAFTO J. Differential scanning calorimetry and electron diffraction investigation on low-temperature aging in Al-Zn-Mg alloy [J]. Metall Mater Trans A, 2000, 31(2): 339-348.
[4] DANH N C, RAJAN K, WALLACE W. A TEM study of microstructural changes during retrogression and reaging in 7075 aluminium [J]. Metall Trans A, 1983, 14: 1843-1850.
[5] DESCHAMPS A, LIVET F, BRECHET Y. Influence of predeformation on ageing in an Al-Zn-Mg alloy (I). Microstructure evolution and mechanical properties [J]. Acta Metall, 1998, 47(1): 281-292.
[6] RAJAN K, WALLACE W, BEDDOES J C. Microstructural study of a high strength stress corrosion resistant 7075 aluminium alloy [J]. J of Mater Sci, 1982, 17: 2817-2824.
[7] STILLER K, WARREN P J, HANSEN V, ANGENETE J, GJONNES J. Investigation of precipitation in an Al-Zn-Mg alloy after two-step aging treatment at 100 and 150 ��C [J]. Mater Sci Eng A, 1999, 270: 55-63.
[8] MONDOLFO L F. Structure of the aluminium: magnesium: zinc alloys [J]. Metallurgical Reviews, 1971, 153: 95-124.
[9] DEIASI R, ADLER P N. Calorimetric studies of 7000 series aluminium alloys: (I) Matrix precipitate characterisation of 7075 [J]. Metall Trans A, 1977, 8(7): 1177-1183.
[10] ADLER P N, DEIASI R. Calorimetric studies of 7000 series aluminium alloys: (II) Comparison of 7075, 7050, and RX720 [J]. Metall Trans A, 1977, 8(7): 1185-1190.
[11] PAPAZIAN J M. A calorimetric study of precipitation in aluminium alloy 2219 [J]. Metall Trans A, 1981, 12(2): 269-280.
[12] STARINK M J. Analysis of aluminium based alloys by calorimetry: Quantitative analysis of reactions and reaction kinetics [J]. International Mat Review, 2004, 49(3-4): 191-226.
[13] GAO N, STARINK M J, LANGDON T G. Using differential scanning calorimetry as an analytical tool for ultrafine grained metals processed by severe plastic deformation [J]. Materials Science and Technology, 2009, 25(6): 687-698.
[14] GHOSH K S, DAS K, CHATTERJEE U K. Kinetics of solid state in Al-Li-Cu-Mg-Zr alloys from calorimetric studies [J]. Metall Mater Trans A, 2007, 38(12): 1965-1975.
[15] JENA A K, GUPTA A K, CHATURVEDI M C. A differential scanning caloriometric investigation of precipitation kinetics in Al-1.53 wt.% Cu-0.79 wt.% Mg alloy [J]. Acta Metall, 1989, 37(3): 885-895.
[16] GUPTA A K, JENA A K, CHATURVEDI M C. A differential technique for the determination of the activation energy of precipitation reactions from differential scanning caloriometry data [J]. Scripta Metall, 1988, 22(3): 369-371.
[17] LLOYD D J, CHATURVEDI M C. A calorimetric study of aluminium alloy AA-7075[J]. J of Mater Sci, 1982, 17: 1819 -1825.
[18] BALMUTH E S. Particle size determination in an Al-3Li alloy using DSC [J]. Scripta Metall, 1984, 18: 301-304.
[19] LUO A, LLOYD D J, GUPTA A K, YOUDELIS W V. Precipitation and dissolution kinetics in Al-Li-Cu-Mg alloy 8090 [J]. Acta Metall Mater, 1993, 41(3): 769-776.
[20] DONOSO E. Calorimetric study of the dissolution of Guinier- Preston zones and �ǡ� phase in Al-4.5at.%Zn-1.75at.%Mg [J]. Mater Sci Eng, 1985, 74 (1): 39-46.
[21] LI Zhi-hui, XIONG Bai-qing, ZHANG Yong-an, ZHU Bao-hong, WANG Feng, LIU Hong-wei. Aging behaviour of an Al-Zn-Mg-Cu alloy pre-stretched thick plate [J]. Journal of University of Science and Technology Beijing, 2007, 14(3): 246-250.
[22] MUKHOPADHYAY A K, TITE C N J, FLOWER H M, GREGSON P J, SALE F. [C]//CHAMPIER G, DUBOST B, MIANNAY D, SABETAY L. Proc 4th Int Conf on Aluminum-Lithium Alloys IV. J de Phyique, Suppl, 1987, 48:C3:439-446.
[23] BERG L K, GJONNES J, HANSEN V, LI X Z, KNUTSON-WEDEL M, WATERLOO G, SCHRYVERS D, WALLENBERG L R. GP-zones in Al-Zn-Mg alloys and their role in artificial aging [J]. Acta Metall, 2001, 49(17): 3443-3451.
[24] KAMP N, SINCLAIR I, STARINK M J. Toughness-strength relationship in the overaged 7449 Al-based alloy [J]. Metall Mater Trans A, 2002, 33(4): 1125-1136.
[25] BUHA J, LUMLEY R N, CROSKY A G. Secondary ageing in an aluminium alloy 7050 [J]. Mater Sci Eng A, 2008, 492: 1-10.
[26] FAN Xi-gang, JIANG Da-mung, MENG Qing-chang, LAI Zhong-hong, ZHANG Xin-mei. Characterisation of precipitation microstructure and properties of 7150 aluminium alloy [J]. Mater Sci Eng A, 2006, 427: 130-135.
[27] NING Ai-lin, LIU Zhi-yi, PENG Bei-shan, ZENG Su-min. Redistribution and reprecipitation of solute atom during retrogression and reaging of Al-Zn-Mg-Cu alloys [J]. Trans Nonferrous Met Soc China, 2007, 17: 1005-1011.
[28] POLMEAR I J. Light alloys, metallurgy of the light metals [M]. 3rd ed. London: Arnold, A division of Holder Headline PLC, 1995: 41.
[29] PAREL T S, WANG S C, STARINK M J. Hardening of an Al-Cu-Mg alloy containing types I and II S phase precipitates [J]. Materials and Design, 2010, 31(1): S2-S5.
[30] DUMONT D, DESCHAMPS A, BRECHET Y. On the relationship between microstructure, strength and toughness in AA7050 aluminium alloy [J]. Mater Sci Eng A, 2003, 356: 326-336.
[31] WANG S C, STARINK M J. Precipitates and intermetallic phases in precipitation hardening Al-Cu-Mg-(Li) [J]. International Materilas Reviews, 2005, 50(4): 193-215.
[32] WANG S C, STARINK M J. Precipitates of intermetallic phases in precipitation hardening Al-Cu-Li-(Mg) based alloys [J]. International Material Review, 2005, 50(4): 193-215.
[33] WERENKIOLD J C, DESCHAMPS A, BRECHET Y. Characterization and modeling of precipitates kinetics in an Al-Zn-Mg alloy [J]. Mater Sci Eng A, 2000, 293(1): 267-274.
[34] STARINK M J, GREGSON P J. Thermodynamics and precipitation in 8090 (Al-Li-Cu-Mg-Zr) alloys studied by DSC and TEM [J]. Materials Science Forum, 1996, 217-222: 673-678.
[35] GHOSH K S, DAS K, CHATTERJEE U K. Caloriometric studies of 8090 and 1441 alloys of conventional and retrogressed and reaged tempers [J]. J of Mater Sci, 2007, 42: 4276-4290.
[36] WEI F, ZHAO Z K, LIU P Y, ZHOU T T. Research and development of Al-Zn-Mg-Cu-Li alloys [J]. Materials Forum, 2004, 28: 75-84.
[37] ABIS S, EVANGELISTA E, MENGUCCI P, RIONTINO G. SANDERS T H Jr, STARKE E A Jr. Proc 5th Int Conf on Aluminium Lithium Alloys. MCEP, Williamsburg, Virginia, 1989: 681.
[38] VYAZOVKIN S, WRIGHT C A. Isothermal and non-isothermal kinetics of thermally stimulated reactions of solids [J]. Int Rev Phys Chem, 1998, 17(3): 407-433.
[39] GALWEY A K, BROWN M E. Handbook of thermal analysis and calorimetry [M]. BROWN M E. Amsterdam: Elsevier, 1998: 147.
[40] SESTAK J, SATAVA V, WENDLANT W W. Study of kinetics under non-isothermal conditions [J]. Thermochemica Acta, 1973, 7(5): 447-504.
K. S. GHOSH1, N. GAO2
1. Department of Metallurgical and Materials Engineering, National Institute of Technology, Durgapur 713 209, India;
2. Materials Research Group, School of Engineering Science, University of Southampton, Southampton, SO17 1BJ, UK
ժ Ҫ�����ò�ʾɨ�����ȷ�(DSC)���ڲ�ͬ�����������о�7150 Al-Zn-Mg�Ͻ���ˮ�㡢��ȻʱЧ���˹�ʱЧ״̬�µĹ�̬��Ӧ��DSC�����ϲ�ͬ�ķ��Ⱥ����ȷ��Ӧ�Ų�ͬ�Ĺ�̬��Ӧ�Ρ����ż������ʵ����ӣ�������λ��Ӧ���¶�Ҳ��֮���ӣ�������Щ��̬��Ӧ������ѧ��Ͷ���ѧ���Ƶġ�ͨ��������ͬʱЧʱ���ºϽ��Ӳ���������Ͻ��ʱЧ��Ϊ��ͨ������DSC���߸�����λ��Ӧ���������õ��˺Ͻ��̬��Ӧ��������(Y)���������(dY/dt)����亯��(f(Y))�Ͷ���ѧ����(���Q��Ƶ������k0)��������������õ�����Щ����ѧ���������������������Ľ���ǺϽϺá�
�ؼ��ʣ�7150 Al-Zn-Mg�Ͻ𣻲�ʾɨ�����ȷ�(DSC)��ʱЧ��Ϊ����ܣ���亯��
(Edited by YUAN Sai-qian)
Corresponding author: K. S. GHOSH; E-mail: ksghosh2001@yahoo.co.uk
DOI: 10.1016/S1003-6326(11)60843-1

