Mechanical property and corrosion behavior of aged Cu-20Ni-20Mn alloy with ultra-high strength
��Դ�ڿ������ϴ�ѧѧ��(Ӣ�İ�)2020���4��
�������ߣ�Ф�� ��˧�� ���� ����
����ҳ�룺1158 - 1167
Key words��CuNiMn alloy; ultra-high strength; elongation; corrosion
Abstract: The ultra-high strength Cu-20Ni-20Mn alloy was prepared by vacuum melting and its mechanical property and corrosion behavior were investigated. After thermomechanical treatment, the alloy exhibited an ultra-high tensile strength of 1204 MPa and the applicable elongation of up to 6.2%. With the increasing exposure time in 3.5% NaCl solution, the corrosion current of the alloy decreased, while the polarization resistance and the charge-transfer resistance of the corrosion surface increased. The corrosion products formed on the surface of the alloy exposed for 1 d, and further corrosion made the corrosion product layer much dense, increasing the corrosion resistance and protecting the alloy from further corrosion.
Cite this article as: TANG Shuai-kang, LI Zhou, GONG Shen, XIAO Zhu. Mechanical property and corrosion behavior of aged Cu-20Ni-20Mn alloy with ultra-high strength [J]. Journal of Central South University, 2020, 27(4): 1158-1167. DOI: https://doi.org/10.1007/s11771-020-4356-4.

J. Cent. South Univ. (2020) 27: 1158-1167
DOI: https://doi.org/10.1007/s11771-020-4356-4

TANG Shuai-kang(��˧��)1, LI Zhou(����)1, 2, GONG Shen(����)1, XIAO Zhu(Ф��)1, 3
1. School of Materials Science and Engineering, Central South University, Changsha 410083, China;
2. State Key Laboratory for Powder Metallurgy, Central South University, Changsha 410083, China;
3. Key Laboratory of Non-ferrous Metal Materials Science and Engineering, Ministry of Education,Changsha 410083, China
 Central South University Press and Springer-Verlag GmbH Germany, part of Springer Nature 2020
Abstract: The ultra-high strength Cu-20Ni-20Mn alloy was prepared by vacuum melting and its mechanical property and corrosion behavior were investigated. After thermomechanical treatment, the alloy exhibited an ultra-high tensile strength of 1204 MPa and the applicable elongation of up to 6.2%. With the increasing exposure time in 3.5% NaCl solution, the corrosion current of the alloy decreased, while the polarization resistance and the charge-transfer resistance of the corrosion surface increased. The corrosion products formed on the surface of the alloy exposed for 1 d, and further corrosion made the corrosion product layer much dense, increasing the corrosion resistance and protecting the alloy from further corrosion.
Key words: CuNiMn alloy; ultra-high strength; elongation; corrosion
Cite this article as: TANG Shuai-kang, LI Zhou, GONG Shen, XIAO Zhu. Mechanical property and corrosion behavior of aged Cu-20Ni-20Mn alloy with ultra-high strength [J]. Journal of Central South University, 2020, 27(4): 1158-1167. DOI: https://doi.org/10.1007/s11771-020-4356-4.
1 Introduction
Copper alloys have been widely applied in industry due to their high electrical and thermal conductivity, excellent mechanical properties and good corrosion resistance in seawater environment [1-4]. Especially in marine engineering, copper alloys have been used as deep-sea pipelines and valves, bearings and propellers, as the copper ions have a stronger antimicrobial effect to inhibit the adhesion and growth of the marine organisms [5-7]. Phosphorus-added deoxidized copper (TP2) pipes were generally used as seawater piping for ships, however, their low strength limited the further application for the high load structure components in marine engineering. In recent years, BFe10-1-1 and BFe30-1-1 copper alloys were developed to meet the demand of advanced marine engineering [8, 9]. However, none of the above copper alloys can achieve a strength above 1000 MPa. Cu-Be copper alloy was one of the most widely used ultra-high strength copper alloys. The tensile strength of QBe2 and QBe1.9-0.1 reached 1200 MPa, however, their elongation was less than 3.0%. The low ductility of these alloys not only made them difficult to process and decreased the product yield, but also reduced the safety and reliability of the component due to the brittle fracture in service.
Recently, CuNiMn alloys have attracted many attentions due to their ultra-high strength and relative high ductility. Many studies on CuNiMn alloy mainly focused on their structure, phase transformation and mechanical properties. PAN [10] investigated the mechanical properties of Cu-20Ni-20Mn alloy and found that the alloy had a strength of higher than 1200 MPa, with an elongation of up to 5%. XIE et al [11] and LUO et al [12] reported that the main precipitation- strengthening phase of CuNiMn alloys was the NiMn precipitate with face-centered tetragonal (FCT) structure, and its orientation relationship with the Cu matrix was (020)Cu//(001)NiMn and [001]Cu//[010]NiMn. Although some literatures [13-15] reported that the Cu-Ni binary alloy had a good corrosion resistance in salt environment, there was little work reported in the literatures on the corrosion behavior of CuNiMn alloys with ultra-high strength.
In this paper, a small amount of Ce element was added into Cu-20Ni-20Mn alloy to refine the microstructure of the alloy. The mechanical property and corrosion behavior of Cu-Ni-Mn-Ce alloy were investigated, and its corrosion mechanism in 3.5% NaCl solution was analyzed.
2 Experimental
2.1 Alloy preparation
Cu-20Ni-20Mn-0.15Ce (wt%) alloy was prepared by vacuum melting and mold casting. After removing the surface defects, the ingots were homogenized at 920 ��C for 8 h and subsequently hot-rolled at 850 ��C from a thickness of 25 to 7.5 mm. The hot-rolled plate was then annealed at 750 ��C for 2 h and cold-rolled to 1.5 mm. Finally, the cold-rolled strips were solid solution treated at 700 ��C for 2 h, followed by aging at 400 ��C for different time.
2.2 Mechanical and electrochemical tests
Hardness test was performed on a HV-5 Vickers hardness tester with a load of 5 kg and holding time of 15 s. Each sample was measured five times and the average value was taken. The room temperature tensile tests of the alloy were carried out on the WDW-200KN microcomputer control electronic universal testing machine according to GB/T 228.1��2010.
The peak-aged samples (aged at 400 ��C for 24 h) used for electrochemical test were exposed in 3.5% NaCl solution at (35��0.5) ��C for 1, 3, 7, 10 and 15 d. The surface of each sample was sealed by polymethymethacrylic, leaving an uncovered area of 10 mm��10 mm in the experiment. The exposed surface was ground with the 1200# sandpaper, subsequently polished with the diamond polishing paste. The polished samples were cleaned with anhydrous ethanol and deionized water, air dried and then immersed in 3.5% NaCl solution. The containers containing the samples were placed in a thermostat water bath cauldron.
Electrochemical tests were carried out on the Multi AUTOLAB M204 electrochemical workstation. Pt electrode was used as the auxiliary electrode, and saturated calomel electrode (SCE) was used as the reference electrode. First, the samples were subjected to an open circuit potential test (OCP). The OCP test time was 500 s, and the average values of the last 50 s were used as the test data during processing. The polarization curve and the electrochemical impedance spectroscopy (EIS) were measured. The testing range for the polarization curve was between -600 mV and 400 mV, with the scanning speed of 1 mV/s. The measured data were analyzed by CHI660C software. The frequency range of the EIS test was between 100 kHz and 10 mHz, and 71 points were measured. The amplitude of the sinusoidal AC disturbance voltage was 10 mV. The measured data were analyzed by Zview 2 software.
2.3 Microstructure observation
Optical metallographic (OM) observation was carried out on the Leica EC3 microscope. The microstructures of the aged samples and corrosive samples were observed using a Sirion200 field emission scanning electron microscope (SEM). The microstructures of the aged samples were observed by a Tecnai G2 F20 transmission electron microscope (TEM).
3 Results and discussion
3.1 Microstructure and mechanical properties of alloy
The composition of Cu-20Ni-20Mn alloy was shown in Table 1. It can be seen that there are few impurity elements in the alloy. Figure 1 shows the OM images of the samples after different treatments. Coarse typical dendritic structure grains formed in the casted ingot (Figure 1(a)), due to the diffusion difficulty of the high content alloying elements and the slow cooling rate in vacuum induction furnace [10]. After the homogenization treatment at 920 ��C for 8 h, the dendritic structure disappeared and the large grains formed (Figure 1(b)). The large grains were broken after hot-rolling and cold-rolling treatment, and elongated along the rolling direction (Figure 1(c)). Recrystallization occurred in the aged sample, leading to fine grain in the alloy (Figure 1(d)). The average grain size of the aged sample was 15-30 ��m.
Table 1 Compositions of designed alloy (wt%)
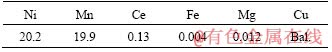
Figure 2(a) shows the variation of hardness of the alloy aged at 400 ��C. The hardness increased with the aging time, and reached its peak value of HV 413 after 24 h aging. Figure 2(b) shows the SEM image of the peak aged sample. Fine equal crystal grain was found, however, little coarse second phase appeared in the alloy. Figures 2(c) and (d) show the TEM image and the selected area electron diffraction (SAED) pattern of the peak aged sample. Some larger discontinuous precipitates still formed along the direction perpendicular to the grain boundary (Figure 2(c)). However, a large number of the nanoscale NiMn particles precipitated in the alloy and the precipitates distributed uniformly inside the grains (Figure 2(d)).
The size of the precipitates at the grain boundaries was larger than that inside the grains. This could be attributed to the higher energy at the grain boundaries of the alloy, where the second phase tended to nucleate and grow preferentially. The fine grain and tiny precipitates contributed to the strength of the alloy.
Figures 2(e) and (f) show the tensile curve and fracture morphology of the alloy, respectively. The tensile strength of the alloy was up to 1204 MPa, the yield strength was 971 MPa, and the elongation reached 6.2%. The fracture photographs of the alloy showed obvious dimples, suggesting a ductile fracture mode. The size of the dimples was related to the geometric size and the distribution of the second phase. The depth of the dimples was dependent on the nearby metal matrix when the dimples were connected, and it increased with the ratio of deformation. During the aging process, a large number of second phase precipitated and the distance between the particles was very small. These precipitates were difficult to deform during tensile test, leading to shallow and tiny dimples.
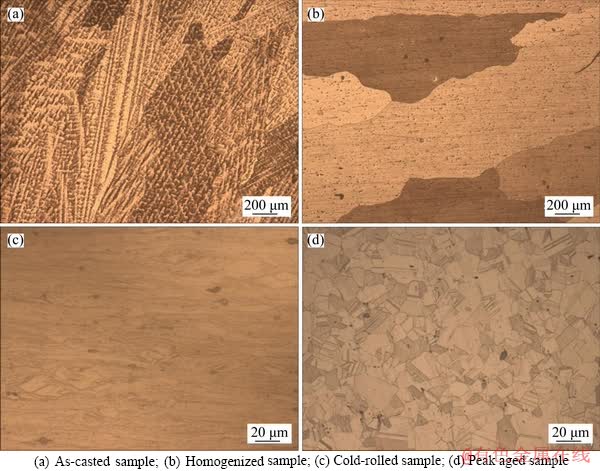
Figure 1 Optical metallographic images of alloys after different treatments:
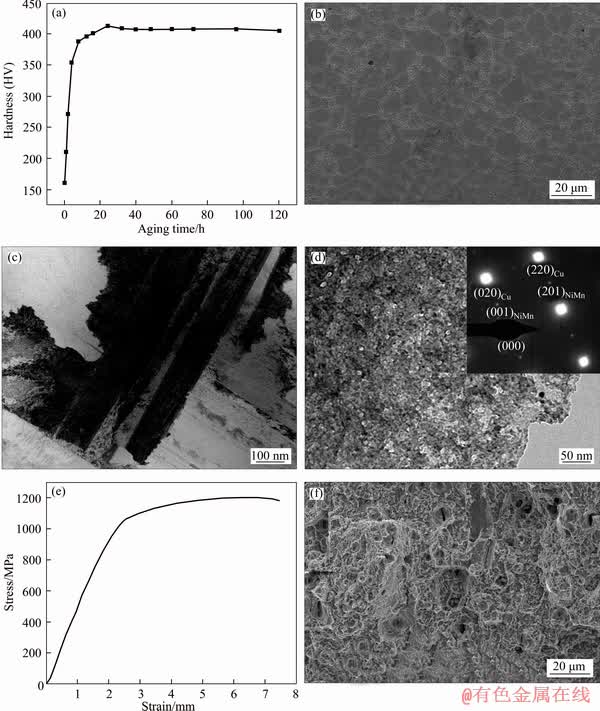
Figure 2 Variation of hardness of alloy aged at 400 ��C (a), SEM image of peak aged sample (b), TEM image (c) and SAED pattern (d) of peak aged sample, stress-strain curve of peak aged sample (e), fracture morphology of peak aged sample (f)
The main strengthening mechanisms of the studied alloy are mainly attributed to solid solution strengthening, precipitation strengthening, and grain refinement strengthening. According to Figure 2 and Ref. [11], a large number of NiMn precipitates formed in Cu-20Ni-20Mn alloy during aging, which could hinder the movement of dislocations and increase the strength of the alloy. Ni and Mn elements dissolved in the matrix could also improve the strength and hardness of the alloy. Furthermore, the fine grain could contribute to the increase of both the strength and the plasticity of the alloy. The influence of the grain size on the strength of the alloy can be estimated by Hall-Petch equation:
 (1)
(1)
where ��s and ��0 are the alloy yield stress and the resistance of dislocation motion within grains, respectively; K is a constant associated with the material, and d is the average grain diameter.
The strength of the alloy increased with the decrease of grain size. The grain boundaries could hinder the motion of sub-structure, leading to a remarkable increase in strength of the alloy [16]. Besides, the large-area grain boundaries within a unit volume of the small grain played a cooperative deformation role during deformation, improving the plasticity of the alloy. Therefore, the alloy maintained a high strength and plasticity. The addition of Ce in the alloy could also enhance the flow stress and the strength of the copper alloy [17, 18].
Table 2 shows the mechanical properties of the studied alloy and some typical ultra-high strength copper alloys reported in literatures. Cu-20Ni- 20Mn had a tensile strength of more than 1200 MPa and an elongation of more than 6%. The strength- ductility product was up to 7465 MPa%, which was almost twice that of other ultra-high strength copper alloys. In addition, the alloy had a hardness of HV 413, which was much higher than that of the aged BFe30-1-1 alloy (HV 225). The ultra-high hardness could improve the wear resistance performance of the alloy used as seawater pipelines during service.
3.2 Corrosion behavior of alloy
3.2.1 Open circuit potential test
The open circuit potential (OCP) characterizes the magnitude of the thermodynamic trend of the material in the solution. The more negative the potential value is, the higher the tendency of the material is likely to corrode in solution [25].Figure 3 shows the variation of the open-circuit potential with exposure time for studied alloy in 3.5% NaCl solution. At the early stage of corrosion, the open-circuit potential moved positively rapidly due to the rapid formation of a corrosion film on the surface, then shifted to the negative values gradually, and reached the steady state at about 5 d. This process was related to the reaction process occurring on the surface of the copper alloy [26-28].
3.2.2 Polarization curve test
Figure 4 shows the polarization curves of samples exposed in 3.5% NaCl solution for different days. The anode curves of samples displayed a typical passivation phenomenon, indicating that a protective corrosion product film formed on the surface of samples. The formation of positive film could prevent the surface of alloy from further corrosion [29]. The polarization resistance (Rp) can be calculated by the Stern-Geary equation [27]:
 (2)
(2)
where ba and bc are the anode and cathode Tafel slopes, respectively, and icorr is the self-corrosion current density.
Table 3 summarizes the electrochemical parameters obtained from the polarization curves of the alloy, where Ecorr is the self-corrosion potential of the alloy. According to the calculation results, the anode Tafel slope ba and the cathode Tafel slope bc were independent. This result was similar with the corrosion parameters of Cu-30Ni alloy in sulfur-containing seawater reported in Ref. [30]. With the increase of exposure time in 3.5% NaCl solution, the corrosion current of samples decreased and the polarization resistance gradually increased in the whole testing period. The equivalent resistance of the sample increased with the exposure time, suggesting that the corrosion product film protected the surface of the alloy.
Table 2 Mechanical properties of some ultra-high strength copper alloys
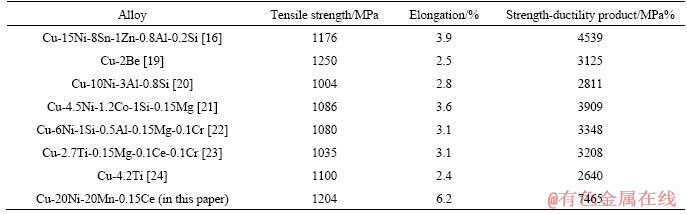
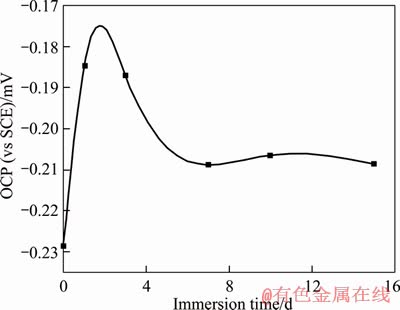
Figure 3 Variation of OCP with time for Cu-20Ni-20Mn alloy in 3.5% NaCl solution
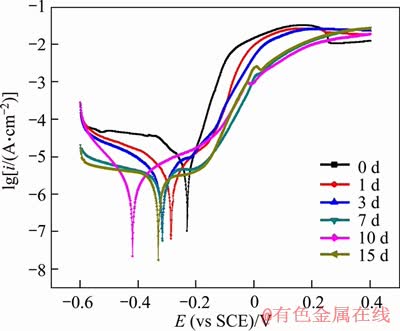
Figure 4 Polarization curves of samples after exposed in 3.5% NaCl solution for different time
3.2.3 Impedance measurement test
Figure 5 shows the impedance spectrum of samples after exposed in 3.5% NaCl solution for different time. Figure 5(a) is the Nyquist diagram of the alloy samples. The pattern was roughly semi-circular in the high-frequency and intermediate-frequency zone. The typical Nyquist semi-circle diameter of the alloy gradually increased with the immersion time, indicating that the charge transfer resistance on the surface of the alloy gradually increased with the immersion time [31]. Figure 5(b) is the Bode diagram of the alloy samples. In the low frequency region, lg|Z| also increased with the immersion time gradually. For example, at 10-2 Hz, the lg|Z| increased form 3.37 at 1 d to 3.78 at 15 d, indicating that the protective oxide film formed and became thick on the surface of samples in the testing period with the immersion time [32]. In the Bode diagram of samples exposed for more than 3 d, there was an inverse relationship between lg|Z| and lgf with a slope close to -1 in the low-frequency and intermediate-frequency zones, due to the capacitance of the electric double layer (EDL) between the metal surface and the solution or the corrosion product film and the metal surface or both [31]. This indicated that a complete oxide film formed on the sample surface. This capacitive behavior disappeared in the lower frequency range between 10-2 Hz and 10-1 Hz, suggesting that the corrosion mechanism was mainly diffusion- controlled [33].
Figure 5(c) is the Bode-phase angle diagram of the samples. During the corrosion process from 1 to 15 d, only one peak appeared in the frequency range between 10-2 Hz and 103 Hz, suggesting that single oxidation layer formed on the surface. In the low frequency region, the angle of the peak was related to the EDL, and its value gradually increased with the increase of the immersion time, indicating that the corrosion rate decreased with the immersion time. The impedance spectrum of the samples showed that a protective corrosion product film formed on the surface of the alloy in 3.5% NaCl solution, and the corrosion product layer became thicker and denser with the exposure time.
Table 3 Electrochemical parameters of polarization curves of samples after exposed in 3.5% NaCl solution for different time
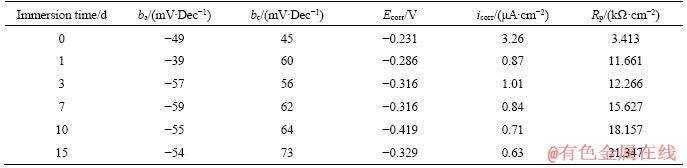
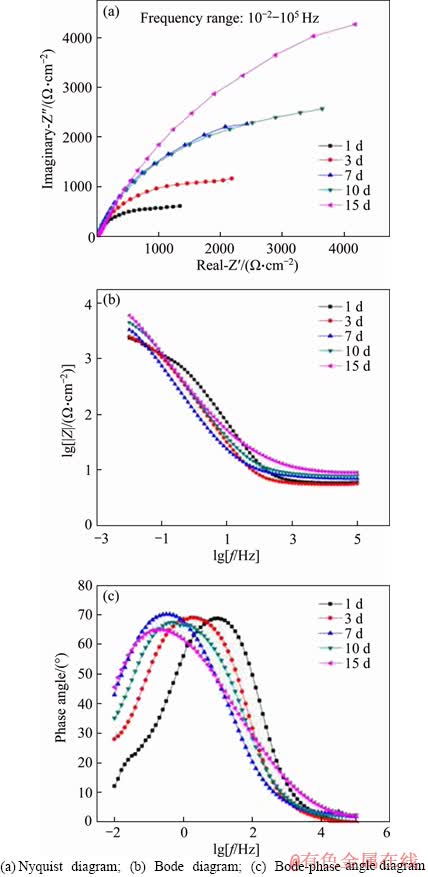
Figure 5 Impedance spectra of samples after being exposed in 3.5% NaCl solution for different time:
3.2.4 SEM corrosion morphology analysis
Figure 6 shows the SEM images of the surface and cross section of samples exposed a in 3.5% NaCl solution for different time. The corrosion products formed on the surface of sample exposed for 1 d. Further increasing the exposure time, the corrosion products layer became dense, which was consistent with the results of electrochemical tests. The distribution of the corrosion product film was relatively uniform, without pits on the grain boundaries and inside the grains. The SEM image of the cross section of the sample after exposed in 3.5% NaCl solution for 15 d showed that the interface between the matrix and the corrosion product layer was quite straight, suggesting that the alloy exhibited a general corrosion characteristic. This could be related to the uniformity of the microstructure of the alloy [27]. The EDX analysis results in Figure 6(d) showed that the corrosion product layer mainly contained Cu, Ni, Mn and O, suggesting that the corrosion product layer consisted of the oxides of Cu, Ni and Mn.
3.2.5 Corrosion mechanism of alloy
According to EDX results and Refs. [26, 34, 35], it may be speculated that the main corrosion products in the corrosion film of Cu-20Ni-20Mn alloy could be CuO, Cu2O, MnO, Mn2O3, MnO2, NiO and Ni(OH)2. The electrode potentials for reversible anodic dissolution of the alloying elements, Mn and Ni in the alloy, are -1.029 V and -0.257 V (vs standard hydrogen electrode), respectively. Therefore, Mn and Ni may be dissolved in the early stage of corrosion [30]:
 (3)
(3)
 (4)
(4)
 (5)
(5)
The cathode reaction:
 (6)
(6)
Some of Ni2+ may bond with OH- [13]:
 (7)
(7)
MnO can further react with O2 dissolved in the solution [35]:
 (8)
(8)
 (9)
(9)
The corrosion of Cu-based alloy in the solution with Cl- ions often involves the oxidation of Cu [26]:
 (10)
(10)
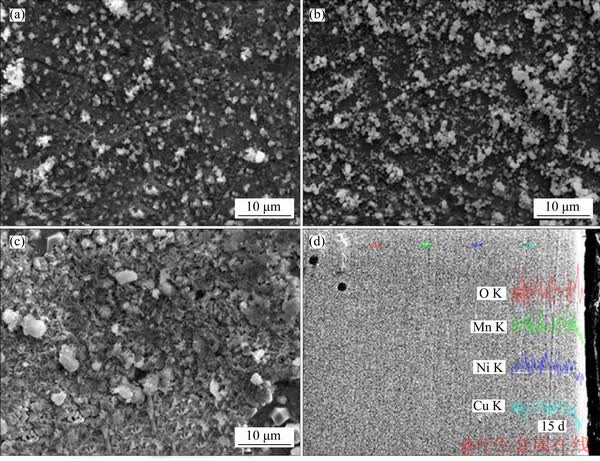
Figure 6 SEM images of samples exposed in 3.5% NaCl solution for different time: Surface of sample exposed for 1 d (a), 7 d (b), 15 d (c); Cross section of sample exposed for 15 d (d)
Followed by:
 (11)
(11)
Subsequently, CuCl2- may decompose in the OH- environment through the following reaction [27]:
 (12)
(12)
Copper oxide products formed by the following reactions:
 (13)
(13)
 (14)
(14)
During the corrosion process, the OCP of the initial stage of the corrosion shifted positively, which could be attributed to the formation of the corrosion film, and the negative shift in the later period should result from the transition of corrosion product from Cu2O to CuO. The corrosion products, especially CuO and NiO, would form a dense corrosion film on the surface of the alloy, decreasing the corrosion rate and protecting the alloy from further corrosion. According to the Ref [36, 37], Ce could inhibit the corrosion of copper alloy in NaCl solution in some extent, with the inhibition efficiency of about 50%, as the corrosion product layer of the Ce-contained alloy could be bonded much tightly with the matrix.
4 Conclusions
1) The aged Cu-20Ni-20Mn-0.15Ce alloy with grain size of 15-30 ��m had an ultra-high tensile strength of the alloy of 1204 MPa and elongation of 6.2%.
2) The open circuit potential of the Cu-20Ni-20Mn alloy shifted positively at the early stage of corrosion, then moved to negative direction. During the subsequent corrosion process, the open circuit potential gradually shifted negatively and gradually stabilized after 5 days of immersion corrosion. In the whole testing period, the corrosion current of the alloy generally decreased, and the polarization resistance and the charge transfer resistance increased gradually.
3) The corrosion products formed on the surface of the alloy after exposed for 1 d, and further corrosion made the corrosion product layer much dense, increasing the corrosion resistance and protecting the alloy from further corrosion.
References
[1] SHAIK M A, SYED K H, GOLLA B R. Electrochemical behavior of mechanically alloyed hard Cu-Al alloys in marine environment [J]. Corrosion Science, 2019, 153: 249-257. DOI: 10.1016/j.corsci.2019.03.043.
[2] CHEN Shi-qiang, ZHANG Duan. Study of corrosion behavior of copper in 3.5 wt.% NaCl solution containing extracellular polymeric substances of an aerotolerant sulphate-reducing bacteria [J]. Corrosion Science, 2018, 136: 275-284. DOI: 10.1016/j.corsci.2018.03.017.
[3] VIVEGNIS S, DELHALLE J, MEKHALIF Z, RENNER F U. Copper-zinc alloy electrodeposition mediated by triethanolamine as a complexing additive and chemical dealloying [J]. Electrochimica Acta, 2019, 319: 400-409. DOI: 10.1016/j.electacta.2019.07.007.
[4] WANG Yan, ZHANG Lei, ZHAI Hong-fei, GAO Hong-xia, ZHOU Ke-chao. Tribological behavior of Cu-15Ni-8Sn/ graphite under sea water, distilled water and dry-sliding conditions [J]. Journal of Central South University, 2019, 26(10): 2623-2633. DOI: 10.1007/s11771-019-4199-z.
[5] HUANG Yuan-chun, LI Ming, MA Cun-qiang, XIAO Zheng-bing, LIU Yu. Flow behaviour constitutive model of CuCrZr alloy and 35CrMo steel based on dynamic recrystallization softening effect under elevated temperature [J]. Journal of Central South University, 2019, 26(6): 1550-1562. DOI: 10.1007/s11771-019-4111-x.
[6] HU Sheng-bo, LIU Li, CUI Yu, LI Ying, WANG Fu-hui. Influence of hydrostatic pressure on the corrosion behavior of 90/10 copper-nickel alloy tube under alternating dry and wet condition [J]. Corrosion Science, 2019, 146: 202-212. DOI: 10.1016/j.corsci.2018.10.036.
[7] JING Chuan, WANG Zhen-qiang, GONG Yu-long, HUANG Hai-jun, MA Yi-wen, XIE Huan-xin, LI Hong-ru, ZHANG Sheng-tao, GAO Fang. Photo and thermally stable branched corrosion inhibitors containing two benzotriazole groups for copper in 3.5 wt% sodium chloride solution [J]. Corrosion Science, 2018, 138: 353-371. DOI: 10.1016/j.corsci.2018.04. 027.
[8] GAN Chun-lei, LIU Xue-feng, HUANG Hai-you, XIE Jian-xin. Effects of room-temperature deformation on mechanical properties, microstructure and texture of continuous columnar-grained BFe10-1-1 cupronickel alloy tubes [J]. Materials Science and Engineering A, 2013, 579: 202-208. DOI: 10.1016/j.msea.2013.05.029.
[9] LI Jin, LI Jiu-yi, YUAN Wei-shuang, DU Yi-li. Biocorrosion characteristics of the copper alloys BFe30-1-1 and HSn70-1AB by SRB using atomic force microscopy and scanning electron microscopy [J]. International Biodeterio ration & Biodegradation, 2010, 64(5): 363-370. DOI: 10.1016/j.ibiod.2010.04.001.
[10] PAN Qi-han. High-elastic Cu-20Ni-20Mn alloy [J]. The Chinese Journal of Nonferrous Metals, 1996, 6(4): 91-95. DOI: 10.3321/j.issn:1004-0609.1996.04.020. (in Chinese)
[11] XIE Wei-bin, WANG Qiang-song, MI Xu-jun, XIE Guo-liang, LIU Dong-mei, GAO Xue-cheng, LI Yang. Microstructure evolution and properties of Cu�C20Ni�C20Mn alloy during aging process [J]. Transactions of Nonferrous Metals Society of China, 2015, 25: 3247-3251. DOI: 10.1016/S1003-6326(15)63960-7.
[12] LUO Fu-xin, PENG huai-chao, CHEN Hui-ming, XIAO Xiang-peng, XIE Wei-bin, WANG Fang, YANG Bin. Dislocation substructure-controlled softening of Cu-20Ni- 20Mn alloy [J]. Materials Characterization, 2019, 147: 253-261. DOI: 10.1016/j.matchar.2018.11.013.
[13] BADAWY W A, ISMAIL K M, FATHI A M. Effect of Ni content on the corrosion behavior of Cu-Ni alloys in neutral chloride solutions [J]. Electrochimica Acta, 2005, 50(18): 3603-3608. DOI: 10.1016/j.electacta.2004.12.030.
[14] TIAN Wei, BI Li-ming. Effect of Zr on microstructure and properties of Cu-15Cr alloy [J]. Journal of Central South University, 2017, 24(12): 2757-2766. DOI: 10.1007/s11771- 017-3689-0.
[15] RAO B V A, KUMAR K C, HEBALKAR N Y. X-ray photoelectron spectroscopy depth-profiling analysis of surface films formed on Cu-Ni (90/10) alloy in seawater in the absence and presence of 1,2,3-benzotriazole [J]. Thin Solid Films, 2014, 556(4): 337-344. DOI: 10.1016/j.tsf.2014. 02.054.
[16] JIANG Ye-xin, LI Zhou, XIAO Zhu, XING Yan, ZHANG Yang, FANG Mei. Microstructure and properties of a Cu-Ni-Sn alloy treated by two-stage thermomechanical processing [J]. The Journal of The Minerals, Metals & Materials Society, 2019, 71(8): 2735-2741. DOI: 10.1007/ s11837-019-03606-5.
[17] SEMBOSHI S, TAKASUGI T. Fabrication of high-strength and high-conductivity Cu-Ti alloy wire by aging in a hydrogen atmosphere [J]. Journal of Alloys and Compounds, 2013, 580: 397-400. DOI: 10.1016/j.jallcom.2013.03.216.
[18] WANG Bing-jie, ZHANG Yi, TIAN Bao-hong, AN Jun-chao, VOLINSKY A A, SUN Hui-li, LIU Yong, SONG Ke-xing. Effects of Ce addition on the Cu-Mg-Fe alloy hot deformation behavior [J]. Vacuum, 2018, 155: 594-603. DOI: 10.1016/j.vacuum.2018.06.006.
[19] GONG Shen, LI Zhou, XIAO Zhu, ZHENG Feng. Microstructure and property of the composite laminate cladded by explosive welding of CuAlMn shape memory alloy and QBe2 alloy [J]. Materials & Design, 2009, 30(4): 1404-1408. DOI: 10.1016/j.matdes.2008.06.067
[20] SHEN Lei-nuo, LI Zhou, DONG Qi-yi, XIAO Zhu, WANG Meng-ying, HE Peng-hui, LEI Qian. Dry wear behavior of ultra-high strength Cu-10Ni-3Al-0.8Si alloy [J]. Tribology International, 2015, 92: 544-552. DOI: 10.1016/j.triboint. 2015.08.004.
[21] HUANG Jia-zhen, XIAO Zhu, DAI Jie, LI Zhou, JIANG Hong-yun, WANG Wei, ZHANG Xiao-xuan. Microstructure and properties of a novel Cu-Ni-Co-Si-Mg alloy with super-high strength and conductivity [J]. Materials Science and Engineering A, 2019, 744: 754-763. DOI: 10.1016/ j.msea.2018.12.075.
[22] LEI Q, LI Z, DAI C, WANG J, CHEN X, XIE J M, YANG W. CHEN D L. Effect of aluminum on microstructure and property of Cu-Ni-Si alloys [J]. Materials Science and Engineering A, 2013, 572: 65-74. DOI: 10.1016/j.msea. 2013.02.024.
[23] LI Si, LI Zhou, XIAO Zhu, LI San-hua, SHEN Lei-nuo, DONG Qi-yi. Microstructure and property of Cu-2.7Ti-0.15Mg-0.1Ce-0.1Zr alloy treated with a combined aging process [J]. Materials Science and Engineering A, 2016, 650: 345-353. DOI: 10.1016/j.msea.2015.10.062.
[24] YANG Guang, LI Zhou, YUAN Yuan, LEI Qian. Microstructure, mechanical properties and electrical conductivity of Cu-0.3Mg-0.05Ce alloy processed by equal channel angular pressing and subsequent annealing [J]. Journal of Alloys and Compounds, 2015, 640(15): 347-354. DOI: 10.1016/j.jallcom.2015.03.218.
[25] ZHANG Rong-wei, SUN Jun-wei, LI Sheng-yan, ZHANG Ying-hui, ZHU Zhi-yun. Effect of manganese on electrochemical properties of copper-nickel alloys [J]. Nonferrous Metal Science and Engineering, 2018, 9(4): 60- 65. DOI: 10.13264/j.cnki.ysjskx.2018.04.010. (in Chinese)
[26] XIAO Zhu, LI Zhou, ZHU An-yin, ZHAO Yu-yuan, CHEN Jing-lin, ZHU Yun-tian. Surface characterization and corrosion behavior of a novel gold-imitation copper alloy with high tarnish resistance in salt spray environment [J]. Corrosion Science, 2013, 76: 42-51. DOI: 10.1016/j.corsci. 2013.05.026.
[27] ZHANG Yang, XIAO Zhu, ZHAO Yu-yuan, LI Zhou, XING Yan, ZHOU Ke-chao. Effect of thermo-mechanical treatments on corrosion behavior of Cu-15Ni-8Sn alloy in 3.5wt% NaCl solution [J]. Materials Chemistry and Physics, 2017, 199: 54-66. DOI: 10.1016/j.matchemphys.2017. 06.041.
[28] ZHANG Xiao-hui, PEHKONEN S O, KOCHERGINSKY N, ELLIS G A. Copper corrosion in mildly alkaline water with the disinfectant monochloramine [J]. Corrosion Science, 2002, 44: 2507-2528. DOI: 10.1016/S0010-938X(02)000 21-5.
[29] MARTIN F J, CHEEK G T, O��GRADY W E, NATISHAN P M. Impedance studies of the passive film on aluminium [J]. Corrosion Science, 2005, 47: 3187-3201. DOI: 10.1016/ j.corsci.2005.05.058.
[30] YUAN S J, PEHKONEN S O. Surface characterization and corrosion behavior of 70/30 Cu-Ni alloy in pristine and sulfide-containing simulated seawater [J]. Corrosion Science, 2007, 49: 1276-1304. DOI: 10.1016/j.corsci.2006.07.003.
[31] HENDERSON J D, EBRAHIMI N, DEHNAVI V, GUO M, SHOESMITH D W, NOEL J J. The role of internal cathodic support during the crevice corrosion of Ni-Cr-Mo alloys [J]. Electrochimica Acta, 2018, 283: 1600-1608. DOI: 10.1016/j.electacta.2018.07.048.
[32] WALKOWICZ M, OSUCH P, SMYRAK B, KNYCH T, RUDNIK E, CIENIEK L, ROZANSKA A, CHMIELARCZYK A, ROMANISZYN D, BULANDA M. Impact of oxidation of copper and its alloys in laboratory- simulated conditions on their antimicrobial efficiency [J]. Corrosion Science, 2018, 140: 321-332. DOI: 10.1016/ j.corsci.2018. 05.033.
[33] SCHUSSLER A, EXNER H E. The corrosion of nickel-aluminium bronzes in seawater I. Protective layer formation and the passivation mechanism [J]. Corrosion Science, 1993, 34: 1793-1802. DOI: 10.1016/0010-938x(93) 90017-b.
[34] ZHOU Hong-ming, HU Xue-yi, LI Jian. Corrosion behaviors and mechanism of electroless Ni-Cu-P/n-TiN composite coating [J]. Journal of Central South University, 2018, 25(6): 1350-1357. DOI: g/10.1007/s11771-018-3831-7.
[35] FAJARDO S, LLORENTE I, JIMENEZ J A, BASTIDAS J M, BASTIDAS D M. Effect of Mn additions on the corrosion behaviour of TWIP Fe-Mn-Al-Si austenitic steel in chloride solution [J]. Corrosion Science, 2019, 154: 246-253. DOI: 10.1016/j.corsci.2019.04.026.
[36] LIU Xia, YUAN Yi-zhi, WU Zhu-ying, TIAN Gao-deng, ZHENG Yu-gui. Synergistic corrosion inhibition behavior of rare-earth cerium ions and serine on carbon steel in 3% NaCl solutions [J]. Journal of Central South University, 2018, 25(8): 1914-1919. DOI: 10.1007/s11771-018-3881-x.
[37] CHEN Jing-lin, LI Zhou, Zhao Yu-yuan. Corrosion characteristic of Ce Al brass in comparison with As Al brass [J]. Materials and Design, 2009, 30: 1743-1747. DOI: 10.1016/j.matdes.2008. 07.041.
(Edited by HE Yun-bin)
���ĵ���
ӵ�г���ǿ�ȵ�ʱЧ̬Cu-20Ni-20Mn�Ͻ����ѧ���ܺ�ʴ��Ϊ
ժҪ��ͨ����������Ʊ���ӵ�г���ǿ�ȵ�Cu-20Ni-20Mn�Ͻ𣬲��о�������ѧ���ܺ�ʴ��Ϊ���������������һϵ�б��κ��ȴ������պúϽ���ֳ�1204 MPa�ij�������ǿ�ȣ����쳤�ʸߴ�6.2%�����źϽ���3.5%NaCl��Һ�б�¶��ʴʱ����ӳ����Ͻ���Ʒ�ĸ�ʴ�������ͣ�����ʴ����ļ�������͵��ת�Ƶ������ӡ���ʴ�����ڱ�¶1 dʱ���ںϽ�������γɣ�����һ����ʴ��ʹ�ø�ʴ����������ܡ���ʴ�������ǿ�˺Ͻ����ʴ���ܣ������Ͻ����ܽ�һ���ĸ�ʴ��
�ؼ��ʣ�CuNiMn�Ͻ𣻳���ǿ�ȣ��쳤�ʣ���ʴ
Foundation item: Project(2017YFB0306105) supported by the National Key R&D Program of China; Projects(51601227, 51701241) supported by the National Natural Science Foundation of China
Received date: 2020-03-03; Accepted date: 2020-03-27
Corresponding author: XIAO Zhu, PhD, Associate Professor; Tel: +86-13974910804; E-mail: xiaozhumse@163.com; ORCID: 0000- 0001-7042-8860

